
Amgen Q2 2026 Earnings Presentation
Hızlı Navigasyon
Etiketler
Slaytları paylaş
Amgen Q2 2026 Earnings Presentation
Her slayt sayfasının detaylı görünümü, düzen, temel içerik ve görsel öğeler dahil.
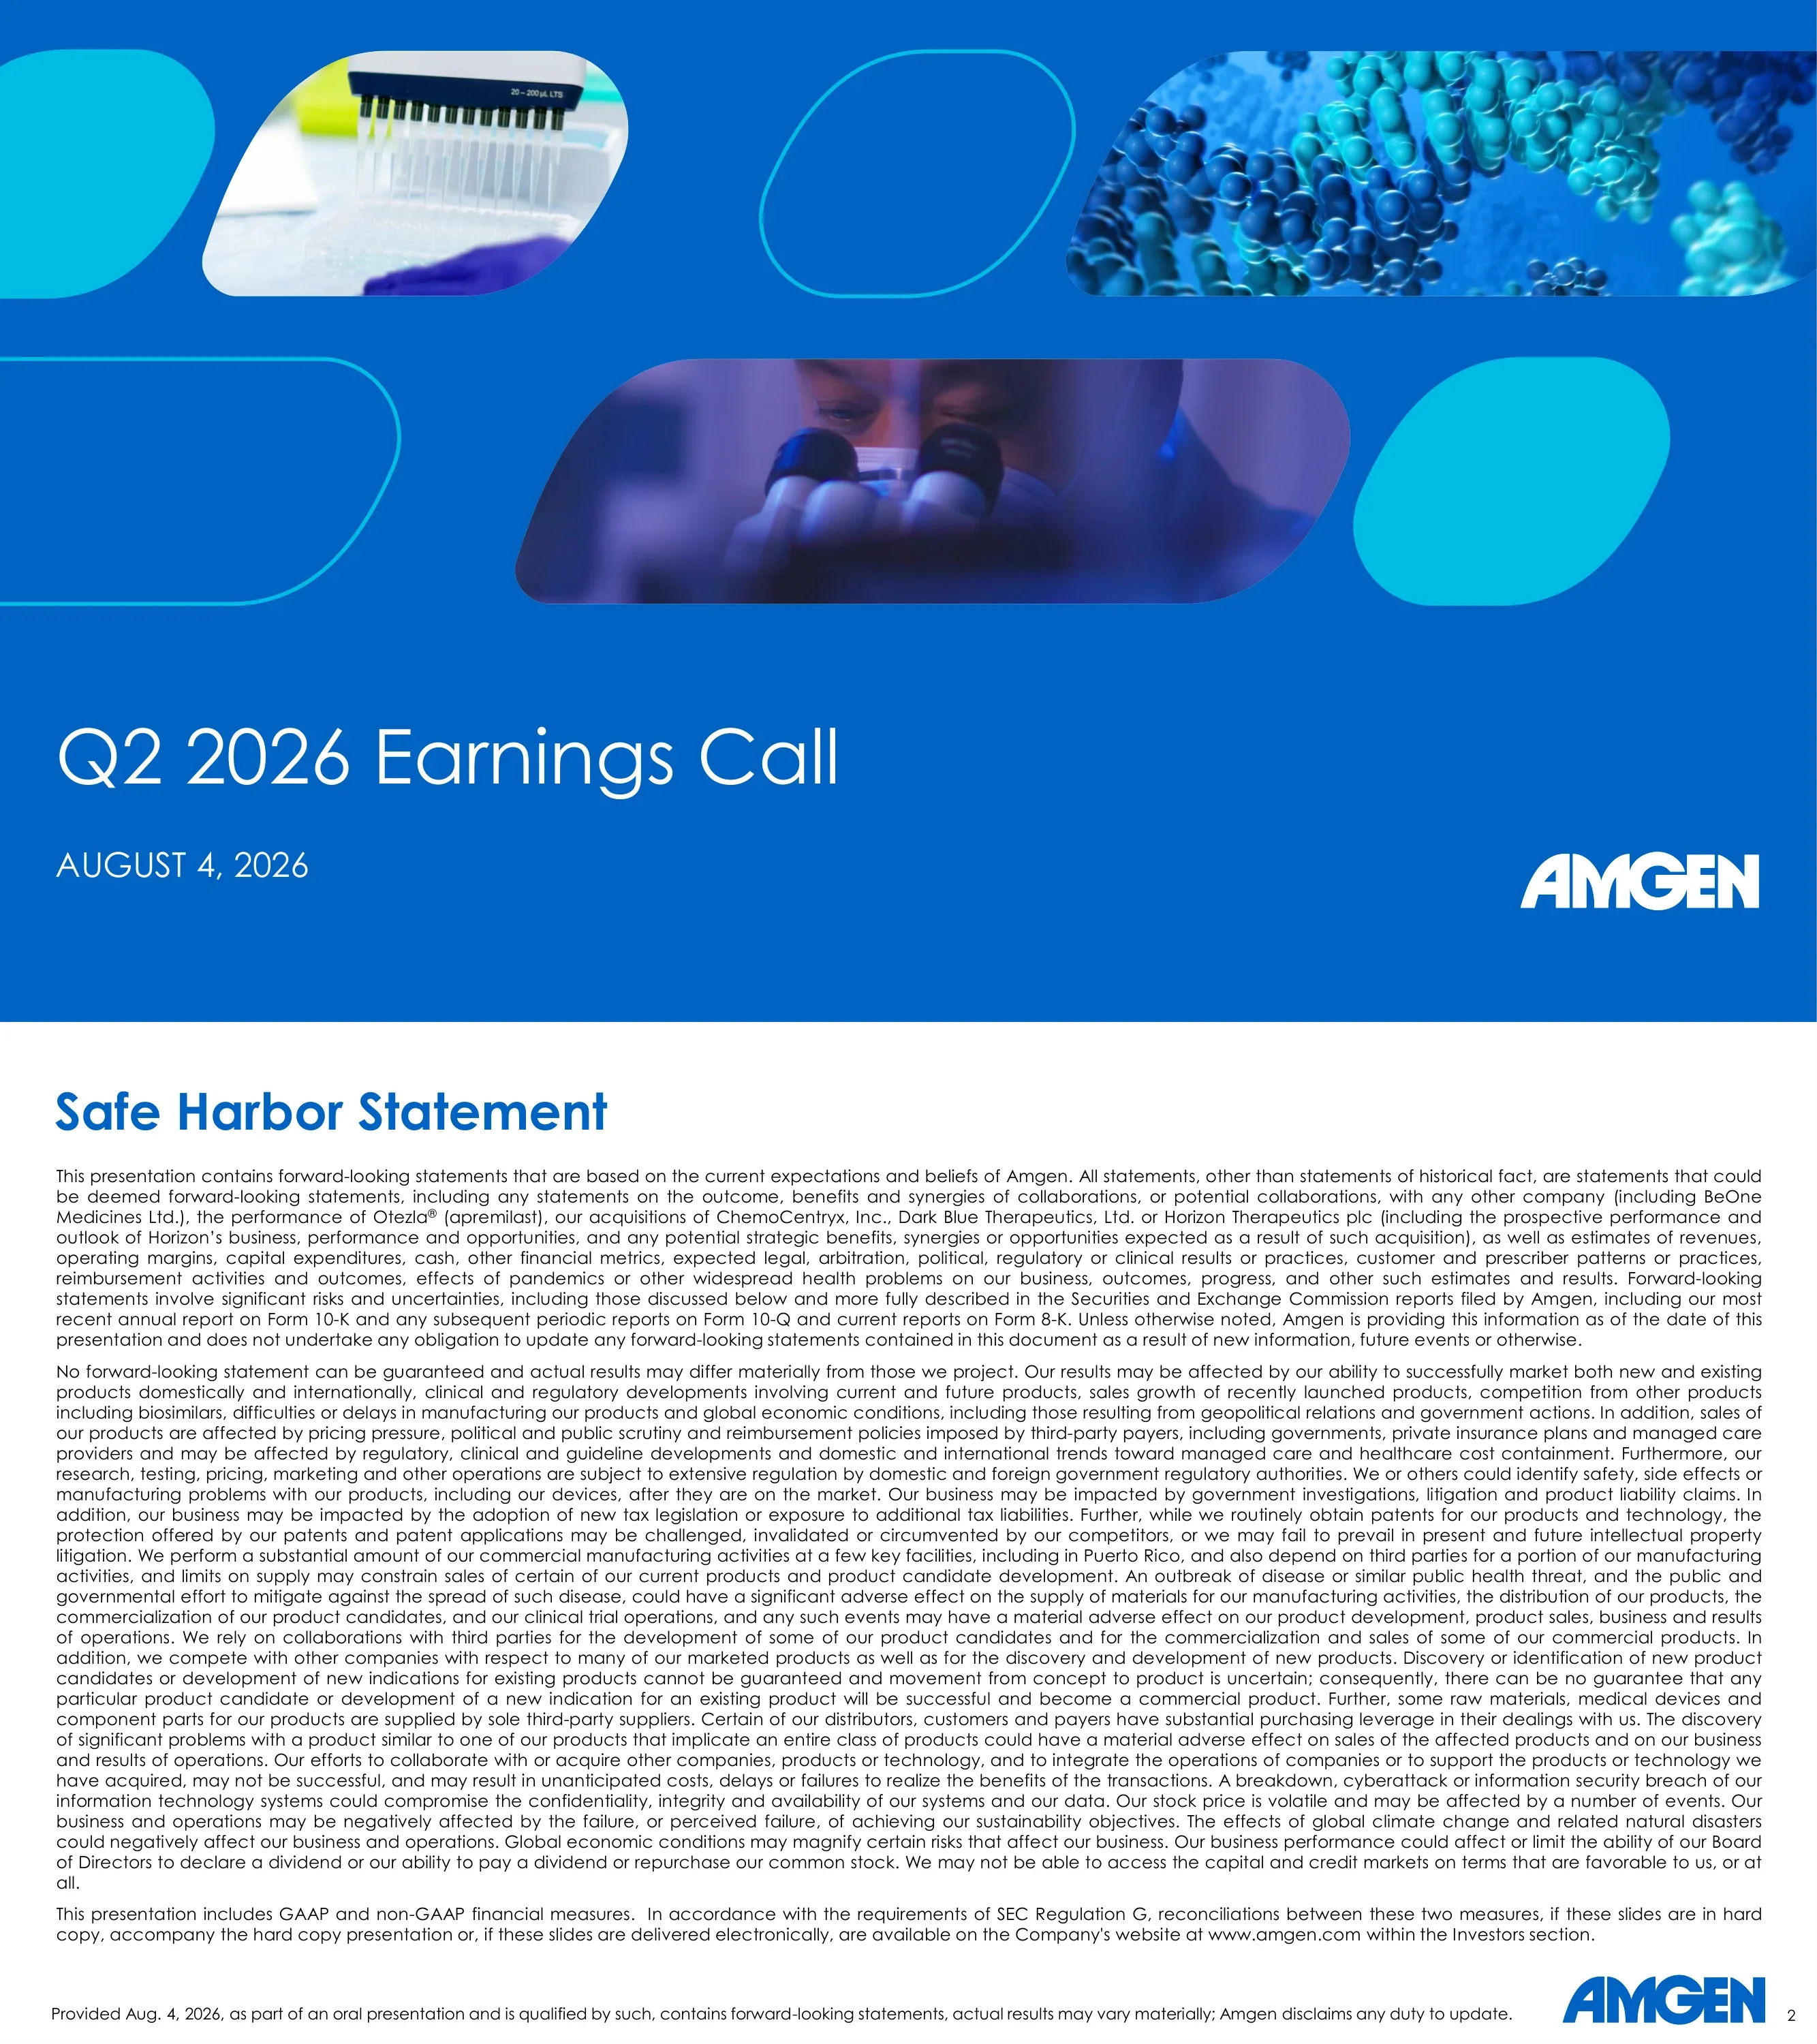
Cover slide for Amgen's Q2 2026 earnings call, dated August 4, 2026.
Full-bleed royal blue background. The upper two-thirds hold a collage of rounded parallelogram 'pill' shapes: some filled with cyan, some outlined, some containing photos of a lab pipette, a scientist at a microscope and a molecular structure. A large thin white title sits bottom-left with the date below it and a white AMGEN wordmark bottom-right.
Forward-looking statements disclaimer. It names risks tied to collaborations (including BeOne Medicines), Otezla, and the ChemoCentryx, Dark Blue Therapeutics and Horizon acquisitions, and explains that the deck contains GAAP and non-GAAP measures under SEC Regulation G.
White slide with a bold blue title top-left and three dense justified paragraphs of small black text across the full width. A standard footer disclaimer line, blue AMGEN logo and page number sit along the bottom.
CEO Robert A. Bradway's quote: the six key growth drivers grew 26% YoY and made up nearly 70% of Q2 product sales. KPIs: total revenues $10.1B (+10%), EPS $6.29 (+4%), R&D expense $1.9B (+10%) and operating margin 48%. Growth drivers: Repatha +37%, EVENITY +38%, TEZSPIRE +42%, Rare Disease +21%, Innovative Oncology +18%, Biosimilars +29%. R&D highlights cover Repatha, UPLIZNA, Sunakiment and IMDELLTRA.
A dashboard slide. A blue quote with large teal quotation marks runs across the top, with the CEO's headshot and name at top-right. Below are three panels: a blue gradient column of stacked KPIs on the left, a light-gray 2x3 grid of product logo and category pill badges with large gray growth percentages in the center, and a cyan-outlined R&D highlights box with checkmark lists and a therapeutic-area color legend on the right.
Section divider opening the commercial performance section.
Blue-to-cyan gradient background with a wide rounded parallelogram window showing a 3D molecular chain image across the top half. A thin cyan outline shape sits at the left edge, a light white title is placed lower-left and a white AMGEN logo sits bottom-right.
Total revenues grew from $8.4B in Q2 '24 to $9.2B in Q2 '25 and $10.1B in Q2 '26. Three stats: 10% total revenue growth, 22 products with at least double-digit sales growth, and 17 products annualizing at $1B+ based on Q2 sales.
Two columns. On the left, a rounded cyan-to-blue gradient card holds a three-bar column chart with white bars and white value labels. On the right, three stacked stat rows are separated by thin cyan rules, each with a very large light-blue numeral beside a black description.
Q2 '26 product sales were $9.5B (+9% YoY). Growth-driver sales: Repatha $1.0B, EVENITY $0.7B, TEZSPIRE $0.5B, Rare Disease $1.6B, Innovative Oncology $2.0B and Biosimilars $0.9B.
A large donut chart on the left, with a blue-cyan gradient segment for about 70% and gray for the remainder, and $9.5B centered inside. A connector line leads to a rounded white card on the right with a 3x2 grid of product logos and category icons, each above a cyan rule and a large blue dollar value.
Repatha grew +37%, with adoption expanding in primary care and cardiology and about 100M patients not at LDL-C goal. EVENITY grew +38%, building bone first for about 2M U.S. women at high fracture risk. TEZSPIRE grew +42% in severe asthma, and its CRSwNP launch is underway.
Three equal columns separated by thin gray vertical rules. Each column has an outlined pill-shaped logo badge on top, a huge bold blue percentage with an asterisk and centered black descriptive text. Decorative blue and outlined pill shapes bleed off the left and right edges.
Rare Disease grew +21%, with UPLIZNA momentum across NMOSD, IgG4-RD and gMG and TEPEZZA expanding globally. Innovative Oncology grew +18%, with IMDELLTRA improving overall survival in small cell lung cancer. Biosimilars grew +29%, with PAVBLU adoption expanding among retina specialists.
Mirrors page 7: three columns, each with a filled pill header badge (teal with a zebra icon for Rare Disease, blue with a magnifier icon for Oncology, slate gray with a vial icon for Biosimilars), a giant blue percentage and centered text, divided by thin gray rules.
Section divider opening the research and development section.
Same template as the page 4 divider: a blue-cyan gradient, a molecular image inside a wide rounded parallelogram, a light white title bottom-left and a white logo bottom-right.
Amgen's R&D framework in three pillars. Therapeutic areas: General Medicine, Rare Disease, Inflammation and Oncology. Modalities: small molecules, siRNA and biologics. AI & Data: accelerating discovery and development with AI at scale.
Three equal full-height image panels (a scientist in a lab, a 3D protein and virus rendering, a glowing circuit-board chip). Each has a blue gradient caption band on its lower third with a large uppercase white heading, a light subtitle and faint pill-shape texture.
Phase 3 programs by area. General Medicine: MariTide (7 indications, including chronic weight management, ASCVD, heart failure, OSA and type 2 diabetes) and olpasiran (3). Rare Disease and Inflammation: UPLIZNA, TEPEZZA, TAVNEOS, dazodalibep and TEZSPIRE. Oncology: BLINCYTO, IMDELLTRA (4 studies), xaluritamig, LUMAKRAS and Nplate. Biosimilars: ABP 206, ABP 234, ABP 692 and ABP 938.
A blue-to-cyan gradient banner reads 'Pursuing Novel Innovative Molecules and Late-Stage Expansions in Phase 3 Studies'. Below it are four columns of light-tinted boxes, each with a colored left border bar (navy, teal/cyan, blue, slate) listing a bold molecule name and its indication. A pill-shaped legend with five therapeutic-area color chips sits bottom-right.
As of June 30, 2026, Amgen had 43K patients on study and 298 clinical trials (including pipeline and real-world evidence trials). Q2 2026 achievements include a positive CHMP opinion for Repatha, the Phase 2/3 UPLIZNA AIH study start, IMDELLTRA approvals by the European Commission and China NMPA for 2L ES-SCLC, completed enrollment of BLINCYTO's Phase 3 Golden Gate study and a Phase 3 Nplate study start in untreated ITP.
Left: a tall blue gradient card with two huge white stats (43K with a people icon, 298 with a microscope icon), each above a thin rule and an uppercase label. Right: a cyan-outlined rounded box titled 'In Q2 2026…' with product names marked by colored pill chips and green-checkmark achievement lists, plus a therapeutic-area legend at the bottom.
In 6,002 high-risk diabetes patients with and without known atherosclerosis, Repatha showed a 29% reduction in 3-P MACE, a 21% reduction in 4-P MACE and a nominal 21% reduction in all-cause death. The Kaplan-Meier chart shows HR 0.71 (95% CI 0.59-0.86), p=0.0004.
A cyan-outlined container with a gradient pill tab header reading 'High-Risk Diabetes With and Without Atherosclerosis Subgroup Analysis'. Inside are two white shadowed cards: the left has the VESALIUS-CV logo, a bold lead-in and large bullet stats; the right has a cumulative-incidence line chart (blue placebo line vs red evolocumab line over 4 years) with TIMI, BWH and Harvard logos.
In 3,627 patients with a prior PCI, Repatha showed a 30% reduction in 3-P MACE, an 18% reduction in 4-P MACE and a 50% reduction in heart attack risk, with effects seen as soon as 6 months, plus nominal reductions of 34% in CV death and 24% in all-cause death. The chart shows HR 0.50 (0.36-0.70), p<0.001, with MI rates of 6.1% vs 3.0%.
Same two-card template as page 13, with a tab header reading 'Prior Percutaneous Coronary Intervention (PCI) Subgroup Analysis'. The left card has nested bullets. The right card has a KM step chart for MI rate (placebo n=1807 vs evolocumab n=1820) with a number-at-risk table under the x-axis.
Among IgG4-RD patients who continued UPLIZNA in Year 1 of the OLP, 100% remained flare-free and 71.4% achieved both flare-free and glucocorticoid-free complete remission, with consistent safety and efficacy. Data were presented at EULAR, June 3-6, 2026.
Same outlined container and pill tab ('New Data from Year 1 of OLP in IgG4-RD'). The left card has bullet findings. The right card has a probability-of-no-flare Kaplan-Meier chart over 1,093 days (teal INEB vs gray PBO lines, with dashed vertical markers at 365 and 729 days) and a number-at-risk table.
Study initiations: MariTide Phase 3 switching from weekly GLP-1 and CWM maintenance extensions (both done), MariTide type 2 diabetes (3 studies), UPLIZNA AIH (done) and UPLIZNA CIDP in H2 2026-H1 2027. Study completions: TEPEZZA OBI in H1 and Sunakiment Phase 2 asthma in H1 (both done), dazodalibep systemic and symptomatic Sjögren's in H2, and TEZSPIRE EoE in H2. Major approvals: UPLIZNA gMG in the EU and IMDELLTRA approvals in the EU, China and Japan (all checked).
Three columns, each headed by a black pill banner with white uppercase text (STUDY INITIATIONS, STUDY COMPLETIONS, MAJOR APPROVALS) and flanked by cyan pill accents. Items are listed with therapeutic-area color chips, and large green checkmarks mark completed milestones. A color legend pill sits at the bottom.
Section divider opening the financial results section.
Same gradient and molecular-image divider template as pages 4 and 9, with a light white title and white logo.
Total revenues were $10.1B (+10%), non-GAAP R&D expense $1.9B (+10%), non-GAAP EPS $6.29 (+4%), non-GAAP operating margin 48% of product sales, free cash flow $3.5B and capital expenditures $0.5B. A banner states that R&D investment rose 10% while the operating margin was 48%.
A 3x2 KPI grid on white. Each tile has a thin cyan top rule, a bold black metric label, a small value line and a very large bold blue number. A full-width solid blue band near the bottom carries a white bold summary sentence.
Q2 '26 vs Q2 '25 ($B): revenues $10.1 vs $9.2 (+10%), product sales $9.5 vs $8.8 (+9%), other revenues 0.5 vs 0.4 (+27%), operating expenses 5.4 vs 4.9 (+11%), operating income 4.6 vs 4.3 (+7%; 48.4% vs 48.9% of product sales), net income 3.4 vs 3.3 (+5%) and EPS $6.29 vs $6.02 (+4%).
A clean financial table with black pill-shaped column headers (Q2 '26, Q2 '25, % Inc/(Decr)). Row labels are in blue, with bold primary lines and indented light sub-lines, and thin teal horizontal separators. Values are centered in black.
Cash flow: capex $0.5B vs $0.4B, free cash flow $3.5B vs $1.9B, share repurchases $0.0 in both periods, a 6% YoY dividend increase and dividends paid per share of $2.52 vs $2.38. Balance sheet: cash and equivalents $14.0B (6/30/26) vs $9.1B (12/31/25), and debt outstanding $57.3B vs $54.6B.
Two stacked tables, 'Cash Flow Data' and 'Balance Sheet Data', each with a bold black section title, black pill period headers, blue bold row labels and teal row dividers. The subtitle notes units in $ billions.
Raised full-year 2026 guidance: revenues $38.2B-$39.4B (previously $37.1B-$38.5B) and non-GAAP EPS $22.30-$23.50 (previously $21.70-$23.10). The non-GAAP tax rate stays at 15.0%-16.5% and capex at about $2.6B.
A rounded gray-outlined card holding a four-row table. Black pill headers read Current Guidance and Previous Guidance. Current values are in bold black and previous values in light gray, with blue row labels and teal separators.
Divider slide for the question-and-answer session.
Solid royal blue background with a large cyan-outlined rounded parallelogram framing a light white 'Q&A' title. Rows of translucent and outlined pill shapes form a pattern in the lower-left, and a white logo sits bottom-right.
Divider slide introducing the GAAP to non-GAAP reconciliation appendix.
Same template as the Q&A divider: a solid blue background, a cyan outline pill frame containing the white 'Reconciliations' title and a translucent pill pattern below.
GAAP income statement for Q2 and the first six months. Q2 2026 total revenues were $10,054M vs $9,179M, operating income $3,514M vs $2,656M, net income $2,375M vs $1,432M, and diluted EPS $4.37 vs $2.65. Six-month total revenues were $18,672M and net income $4,194M.
A traditional financial-statement layout on white: a bold black multi-line title top-left and a right-aligned four-column numeric table (three and six months, 2026 and 2025) with underlines and double-underlined totals. There is no color apart from the logo.
Balance sheet at June 30, 2026 vs December 31, 2025: total assets $95,639M vs $90,586M, cash $13,989M vs $9,129M, long-term debt $51,859M vs $50,005M, stockholders' equity $11,688M vs $8,658M, and shares outstanding 541M vs 539M.
Accounting-format two-column table with bold Assets and Liabilities and Stockholders' Equity section headings, indented line items and double-underlined totals, on white with a black title top-left.
Line-by-line reconciliation of cost of sales, R&D, SG&A, operating expenses, operating income, other income, taxes and net income. For example, Q2 2026 GAAP operating income of $3,514M plus $1,098M of adjustments gives non-GAAP operating income of $4,612M (48.4% of product sales), and GAAP net income of $2,375M reconciles to non-GAAP net income of $3,423M.
A very dense two-panel table, left and right halves each with four period columns, in small type with dotted leader lines, footnote letters (a-h) and underlined subtotals.
Diluted EPS computation: Q2 2026 GAAP $4.37 vs non-GAAP $6.29 on 544M shares, and Q2 2025 $2.65 vs $6.02. For the six months, 2026 was $7.71 vs $11.44 and 2025 was $5.84 vs $10.92. Footnotes a-h explain the adjustments (Horizon acquisition amortization, the BeOne equity fair value adjustment, litigation and an effective tax rate on adjustments of 16.1%).
Two stacked GAAP/Non-GAAP comparison tables (three months and six months) with underlined column headers, followed by a lettered footnote list in small justified text across the lower half.
Q2 2026 operating cash flow was $4,002M vs $2,280M. Investing was -$569M and financing -$1,482M, and cash ended the period at $13,989M. Free cash flow was $3,489M in Q2 2026 vs $1,911M (operating cash flow less $513M capex) and $4,966M for the six months vs $2,891M.
Two right-aligned accounting tables with generous white space: the cash flow summary on top and the free cash flow derivation below. Each has three- and six-month column groups with double-underlined results.
2026 GAAP diluted EPS guidance of $15.80-$17.08 plus acquisition-related expenses of $6.04-$6.12, net losses from equity investments of $0.42 and other items of -$0.04 gives non-GAAP EPS guidance of $22.30-$23.50. The adjustments are net of about $1.29 per share in tax impact. GAAP tax rate guidance of 14.5%-16.0% plus 0.5% gives the non-GAAP rate of 15.0%-16.5%.
Two reconciliation blocks on white, each with a bold black multi-line heading, a low/high range table with em-dash separators and double-underlined totals, and an explanatory note paragraph between the blocks.
Bu slayt ve temel sunum içeriği hakkında yaygın sorular.
It is the 29-slide deck from Amgen's August 4, 2026 earnings call. It opens with a cover and safe harbor, then a CEO summary dashboard. Next come a Commercial Update (revenue trend and growth drivers), an R&D Update (Phase 3 pipeline, Q2 data readouts and 2026 milestones) and a Financial Update (KPIs, non-GAAP results, cash flow and balance sheet, 2026 guidance). It ends with a Q&A divider and a seven-page GAAP reconciliation appendix.
The slides report total revenues of $10.1B (+10% YoY), product sales of $9.5B (+9%), non-GAAP EPS of $6.29 (+4%), non-GAAP R&D expense of $1.9B (+10%), a non-GAAP operating margin of 48% of product sales, free cash flow of $3.5B and capital expenditures of $0.5B. GAAP diluted EPS was $4.37.
Yes. The 2026 Guidance slide shows revenues of $38.2B-$39.4B, up from $37.1B-$38.5B, and non-GAAP EPS of $22.30-$23.50, up from $21.70-$23.10. The non-GAAP tax rate of 15.0%-16.5% and capex of about $2.6B are unchanged.
It names six growth drivers that grew 26% in aggregate and made up about 70% of Q2 sales: Repatha (+37%, $1.0B), EVENITY (+38%, $0.7B), TEZSPIRE (+42%, $0.5B), Rare Disease (+21%, $1.6B), Innovative Oncology (+18%, $2.0B) and Biosimilars (+29%, $0.9B).
The palette is royal blue and cyan, with gradient section dividers that frame molecular imagery inside rounded parallelogram 'pill' shapes. Headlines are bold blue geometric sans-serif. Black pill shapes serve as table column headers, and a five-color legend (navy, teal, cyan, blue, slate) codes therapeutic areas. Content slides are white, with a standard footer disclaimer and a blue AMGEN logo bottom-right.
Useful patterns include: a one-page CEO dashboard that combines a quote, KPI sidebar, growth-driver grid and R&D highlights; oversized percentages for product growth; a reusable two-card clinical slide (bullets beside a survival curve); a milestone tracker with green checkmarks for completed items; guidance tables that gray out previous ranges; and an appendix of reconciliations set apart by its own divider.
Three slides share one template: an outlined container with a gradient tab header, bullet takeaways on the left and a Kaplan-Meier chart on the right. They cover the Repatha VESALIUS-CV diabetes subgroup (29% lower 3-P MACE, HR 0.71), the prior-PCI subgroup (50% lower heart attack risk, HR 0.50) and UPLIZNA MITIGATE Year 1 OLP data (100% flare-free, 71.4% in complete remission).
Yes. You can download the original PDF and an editable PPTX. The PPTX was machine-converted from the PDF, so some layouts, fonts or charts may need touch-ups. The content belongs to Amgen and is shown for reference and study. It is not investment advice.
Official source of the Q2 2026 earnings call presentation (August 4, 2026).

Create Your Own Slides
Turn your ideas into professional presentations in seconds with 2slides AI.
Profesyonel tasarımları referans alın, stilinizi seçin ve mükemmel metin oluşturma ile slaytlar oluşturun. Nano Banana ile desteklenir—şimdi sunumunuzu oluşturmaya başlayın.
Your AI Agent for slides. Save time, shine faster with intelligent presentation creation.




© 2026 2slides. All rights reserved.