
AMD's Q2 2026 financial results presentation (August 4, 2026) — a 27-slide quarterly earnings deck covering record revenue of $11.5B (up 50% year over year), GAAP and non-GAAP results side by side, per-segment performance for Data Center, Client and Gaming, and Embedded, Q3 guidance, and six appendix reconciliation tables.
Hızlı Navigasyon
Etiketler
Slaytları paylaş
AMD's Q2 2026 financial results presentation (August 4, 2026) — a 27-slide quarterly earnings deck covering record revenue of $11.5B (up 50% year over year), GAAP and non-GAAP results side by side, per-segment performance for Data Center, Client and Gaming, and Embedded, Q3 guidance, and six appendix reconciliation tables.
Her slayt sayfasının detaylı görünümü, düzen, temel içerik ve görsel öğeler dahil.
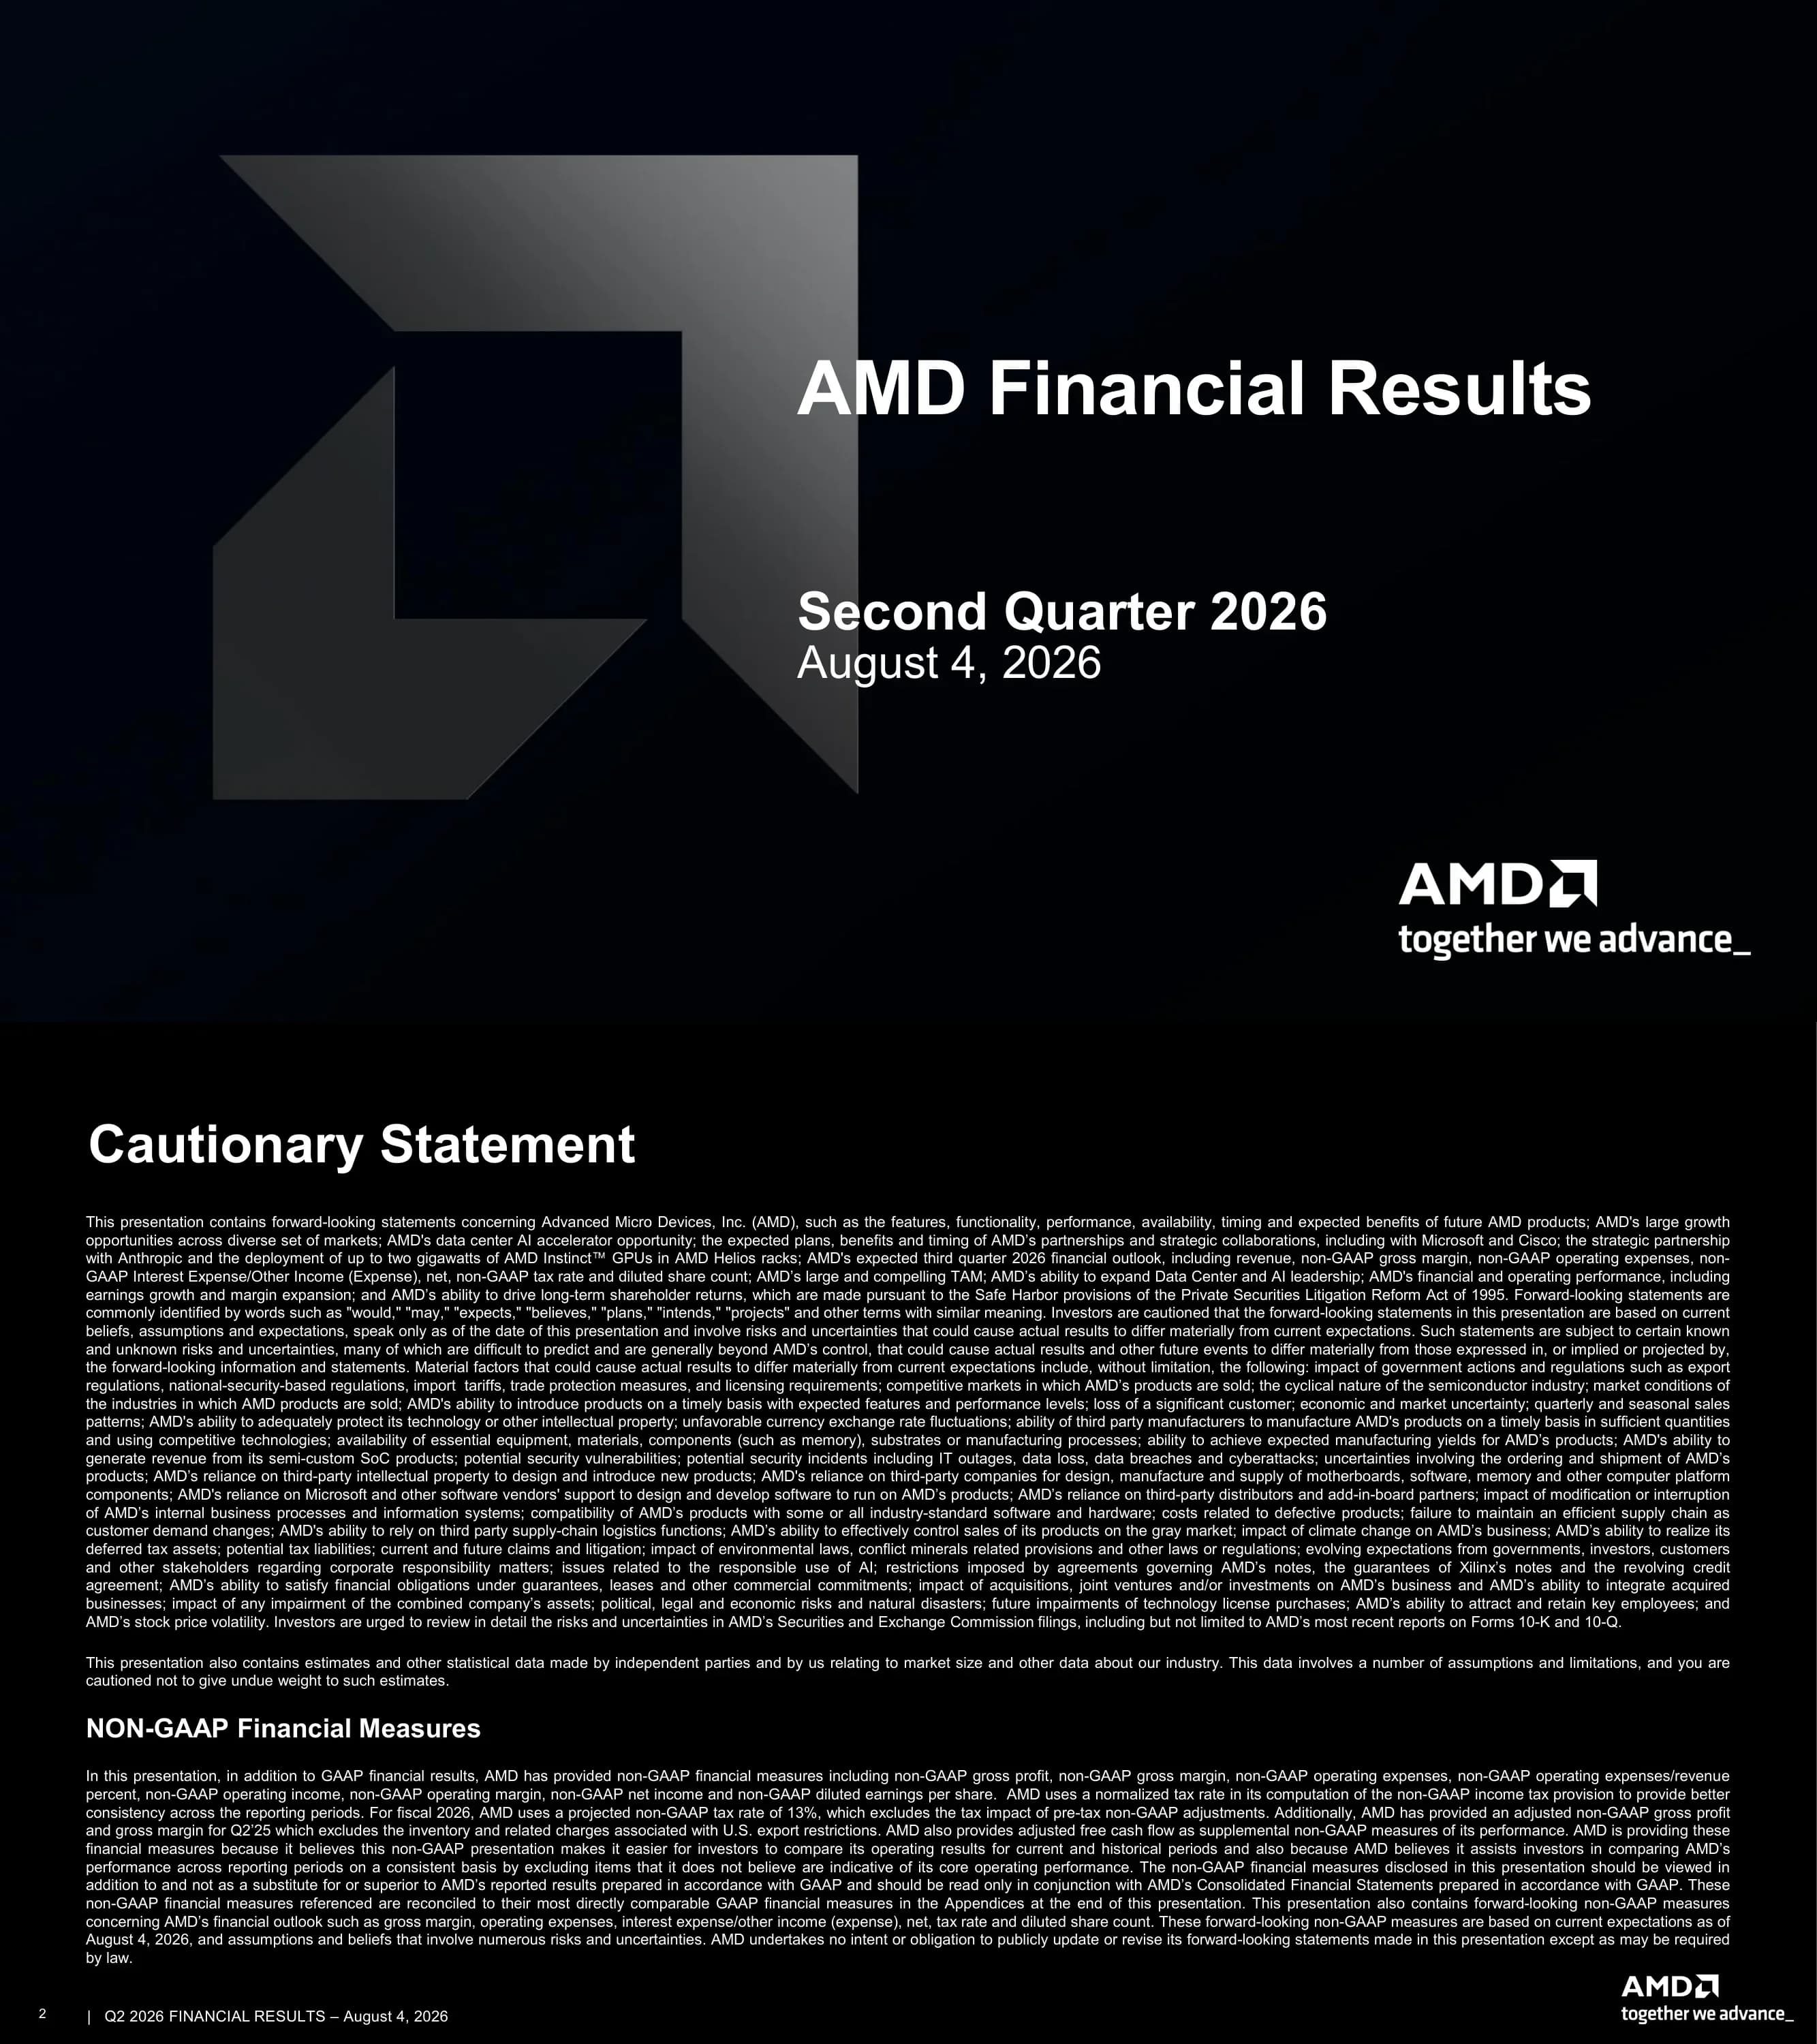
Cover slide for AMD's second quarter 2026 financial results, dated August 4, 2026.
Near-black ground with an oversized dark-grey AMD arrow mark bleeding off the left edge; title and date set right of centre; the AMD wordmark and 'together we advance_' tagline sit bottom right.
Forward-looking statements notice covering product roadmap, the Anthropic agreement for up to two gigawatts of AMD Instinct GPUs in Helios racks, partnerships with Microsoft and Cisco, and Q3 2026 outlook; followed by a section defining the non-GAAP measures used and the 13% projected fiscal 2026 tax rate.
Two dense justified text blocks under a bold heading, with a second sub-heading partway down; small type, no graphics.
Four themes framing the presentation: leadership product portfolio, expanding customer and partner ecosystem, data center and AI growth, and strong financial foundation.
Logo and section title on the left third; four gold icon tiles stacked down the right with labels beside them, separated by thin rules.
Four strategic pillars: extend compute technology leadership (CPU, GPU, FPGA, networking, SoC, chiplets and packaging); expand data center leadership (cloud, enterprise and rack-scale); open software platforms and developer enablement (production-grade ROCm); and powering AI everywhere (high-performance, adaptive and custom AI platforms).
Four equal cards in a row, each a photograph above a bold title, a hairline, and a gold supporting line; gold underscore anchors each card.
Three market groupings — Data Center, Client and Gaming, and Embedded — each with a positioning line and the product brands serving it (EPYC, Instinct, Alveo, Versal, Kintex, Solarflare, Zynq; Ryzen and Radeon; the embedded variants plus Kria and Spartan).
Three columns, each a photograph over a gold header band, a grey description block, and a dark panel listing brand lockups in a grid.
Record revenue of $11.5 billion, up 50% year over year from $7.7 billion, driven by more than a doubling of Data Center revenue plus growth in Embedded and Client and Gaming.
Two stacked takeaway blocks at left, each with a gold chevron marker and a gold underline; a two-bar chart at right — grey prior year, gold current — with values above each bar.
GAAP gross margin rose from 40% to 54%; non-GAAP from 43% to 56%, with the prior-year bar showing 54% on a comparable basis once the $800 million export-restriction inventory charge is excluded. Comparable non-GAAP gross margin was up more than 200 basis points on higher Data Center revenue mix.
The deck's signature split: a GAAP panel at left and a non-GAAP panel at right, each with its own header band and a two-bar chart; the non-GAAP prior-year bar carries a lighter stacked segment showing the adjustment; a full-width grey takeaway band runs beneath.
GAAP operating income went from a $(0.1) billion loss to $2.0 billion; non-GAAP from $0.9 billion to a record $3.1 billion, driven by higher revenue.
Same GAAP / non-GAAP split-panel layout; the GAAP prior-year bar sits below the zero line.
GAAP diluted EPS rose from $0.54 to $1.38; non-GAAP from $0.48 (or $0.43 of export-restriction EPS impact stacked above it) to a record $1.66, up 82% year over year on a comparable basis.
Same split-panel layout, with each panel carrying its own takeaway sentence rather than one shared band.
Full GAAP income statement summary: revenue $11,536M (up 50% Y/Y, up 13% Q/Q), gross profit $6,203M, gross margin 54%, operating expenses $4,213M, operating income $1,990M versus a $(134)M loss a year ago, net income $2,297M, diluted EPS $1.38.
Single table with a gold header row; five columns (Q2'26, Q2'25, Y/Y, Q1'26, Q/Q); alternating row shading with the current-quarter column highlighted in a lighter grey band; sub-metrics indented under their parent line.
The same table on a non-GAAP basis: gross profit $6,488M, gross margin 56%, operating expenses $3,394M (29% of revenue), operating income $3,094M (27% margin), net income $2,760M, diluted EPS $1.66.
Identical table structure to the previous slide so the two can be read side by side.
Segment revenue and operating income: Data Center $6,718M revenue (up 107%) and $2,103M operating income versus a $(155)M loss; Client & Gaming $3,841M revenue (up 6%) and $582M operating income (down 24%); Embedded $977M revenue (up 19%) and $386M operating income (up 40%).
Table grouped into three segment blocks, each with a gold segment label row followed by indented net revenue and operating income rows.
Cash, cash equivalents and short-term investments at a record $13,111M (up 6% Q/Q); accounts receivable $7,281M (up 21%); inventories $8,468M (up 5%); total debt $3,226M (flat).
Compact four-row table with only Q2'26, Q1'26 and Q/Q columns; a grey takeaway band spans the full width beneath.
Data Center revenue $6.7 billion, up 107% year over year, with operating income of $2.1 billion versus a $(0.2) billion loss and a 31% operating margin. Strategic highlights include the Helios rackscale launch, Instinct MI450 Series GPUs, 6th Gen EPYC, the Anthropic agreement for up to 2 GW of MI450 GPUs, an expanded Microsoft Azure collaboration, ROCm.ai, and the MI350P launch.
Three-panel segment template: revenue chart, operating margin chart, and a Strategic Highlights panel at right listing brand lockups over bulleted announcements; each chart sits above a dark figure block and a grey explanatory band.
Client and Gaming revenue $3.8 billion, up 6%, split into Client $3.1B and Gaming $0.8B; operating income $582 million versus $767 million a year ago, with operating margin falling from 21% to 15% on higher operating expenses. Highlights include Ryzen AI Halo systems, the Ryzen PRO 9000 Series with 3D V-Cache, and a Cisco collaboration.
Same three-panel template; the revenue bars are internally stacked to split Client from Gaming.
Embedded revenue $977 million, up 19%, with operating income of $386 million versus $275 million and operating margin rising from 33% to 40%. Highlights include Ryzen AI Embedded X100 Series, Kria AI solutions for physical AI, and Versal Premium Series Gen 2.
Same three-panel template; the brand lockup grid in the highlights panel runs to two rows.
Q3 2026 guidance: revenue approximately $13 billion plus or minus $300 million; gross margin approximately 56%; operating expenses approximately $3.65 billion; other income net of interest expense approximately $55 million; effective tax rate 13% of pre-tax income; diluted share count approximately 1.66 billion shares.
Single two-column table with a gold header, alternating row shading, gold row labels and centred values; two long footnotes explain why a GAAP reconciliation is not practicable.
Four summary tiles: revenue $11.5B up 50%; segment revenue (Data Center $6.7B up 107%, Client & Gaming $3.8B up 6%, Embedded $977M up 19%); gross margin 54% GAAP and 56% non-GAAP; diluted EPS $1.38 GAAP and $1.66 non-GAAP. A gold band closes with 'Record revenue with continued earnings growth and margin expansion'.
Four dark tiles in a row, each topped by a thin gold rule; a full-width gold band with black type runs beneath.
Environmental, Social and Governance positioning statements, supported by external ratings and recognitions: CDP Climate 2025 A-, 100 Best Corporate Citizens 2025, HRC Equality 100, EcoVadis Gold top 5%, MSCI ESG AA as of July 2026, and ISS ESG Prime.
Three columns with gold header bands over description blocks; a row of six ratings badges sits beneath on a lighter ground, with a long MSCI disclaimer footnote.
Five closing pillars: large and compelling TAM, technology leadership, expanding data center and AI leadership, world-class execution and focus, and strong balance sheet — all framed as driving long-term shareholder returns.
Five dark tiles in a row, each with a thin gold top rule; a full-width gold band with black type closes the slide.
Two tables. GAAP gross profit $6,203M (54% margin) bridges to non-GAAP $6,488M (56%) via stock-based compensation, amortization of acquisition-related intangibles, acquisition-related costs and a legal loss contingency. GAAP operating expenses $4,213M (37% of revenue) bridge to non-GAAP $3,394M (29%).
Two stacked tables, each with a gold header row and three quarter columns (Q2'26, Q1'26, Q2'25); GAAP starting lines in bold, adjustments indented, non-GAAP subtotals in bold; margin lines set in italic.
GAAP operating income $1,990M (17% margin) bridges to non-GAAP $3,094M (27%) through stock-based compensation $503M, amortization of acquisition-related intangibles $544M, acquisition-related and other costs $40M, and a $17M legal loss contingency; prior-year GAAP was a $(134)M loss at (2%) margin.
Single table in the same style, occupying only the upper third of the slide; the rest is left empty.
GAAP net income $2,297M / $1.38 per share bridges to non-GAAP $2,760M / $1.66, with each adjustment shown in both dollars and per-share terms — including a $(483)M gain on long-term investments, a $(161)M income tax provision adjustment, and discontinued operations relating to the ZT Systems manufacturing divestiture.
Wide table with paired dollar and per-share columns for each of three quarters; three explanatory footnotes beneath.
GAAP net cash provided by operating activities of continuing operations $2,366M (21% operating cash flow margin), less purchases of property and equipment $(808)M, giving free cash flow of $1,558M at a 14% free cash flow margin.
Compact single-column table in the upper portion of an otherwise empty slide.
Weighted average share counts: Q2'26 actual basic 1,632M plus 27M dilutive impact from employee equity grants giving 1,659M diluted; Q3'26 estimate 1,636M basic plus 25M giving 1,661M diluted, based on an average stock price of $534 between June 29 and July 24, 2026 versus $398 in Q2'26.
Small table with a two-tier header (quarter over Actual/Estimate); explanatory paragraph and two footnotes beneath.
Isolates the prior-year comparability adjustment: Q2'25 GAAP gross profit $3,059M (40% margin) plus $267M of standard non-GAAP items plus the $800M inventory and related charges from U.S. export restrictions gives adjusted non-GAAP gross profit of $4,126M at a 54% margin.
Single table with a single quarter column; the final adjusted-margin row is set in bold italic to mark it as the comparability figure used elsewhere in the deck.
Closing slide showing the AMD logo.
Near-black field with the white AMD wordmark and arrow centred; page footer retains the quarter and date.
Bu slayt ve temel sunum içeriği hakkında yaygın sorular.
The full 27-slide AMD Q2 2026 financial results presentation as both PDF and editable PowerPoint, plus a page-by-page preview so you can see every slide first. The PPTX keeps layouts, tables and text editable so you can substitute your own figures.
Yes. It is the Q2 2026 Earnings Slides that AMD published on its investor relations site alongside the August 4, 2026 results, including the cautionary statement and all six appendix reconciliation tables.
The GAAP / non-GAAP split panel, used four times here for gross margin, operating income and EPS. Each slide puts the GAAP chart on the left and the non-GAAP chart on the right with identical scales, so the size of the adjustment is visible immediately instead of being left to the appendix.
The prior-year quarter included an $800 million inventory charge from U.S. export restrictions. Rather than only footnoting it, the deck stacks the adjustment as a lighter band on top of the prior-year bar, so you can read both the reported figure and the comparable figure from the same chart. Slide 26 then reconciles that adjustment on its own.
Yes, two ways. One table slide gives revenue and operating income for Data Center, Client & Gaming and Embedded with Y/Y and Q/Q columns, and then each segment gets its own slide with a revenue chart, an operating margin chart, and a strategic highlights panel.
Open the PPTX and check each chart before committing — exported investor decks often mix native PowerPoint charts with pasted images. Layouts, tables, text and colours stay editable either way, so a flattened chart can still be replaced in place.
Near-black backgrounds throughout, with gold for the current period and grey for the prior-period comparison. Gold header bands label chart panels, gold row headers label tables, and takeaway sentences sit in grey bands beneath each chart. No third accent colour appears in any chart.
Each reconciles exactly one line item — gross profit, operating expenses, operating income, net income and EPS, free cash flow, and share count — plus a seventh isolating the prior-year export-restriction adjustment. Splitting them keeps each table short enough to read and lets the body slides footnote the specific one that applies.
AMD publishes each quarter's Earnings Slides, press release and financial statements on this page; this deck is the Q2 2026 entry.

Create Your Own Slides
Turn your ideas into professional presentations in seconds with 2slides AI.
Profesyonel tasarımları referans alın, stilinizi seçin ve mükemmel metin oluşturma ile slaytlar oluşturun. Nano Banana ile desteklenir—şimdi sunumunuzu oluşturmaya başlayın.
Your AI Agent for slides. Save time, shine faster with intelligent presentation creation.




© 2026 2slides. All rights reserved.