
อยู่ในคอลเลกชัน ตัวอย่างงานนำเสนอสำหรับนักลงทุน · ตัวอย่างพรีเซนเทชันนักลงทุนออสเตรเลีย
Woodside Energy Capital Markets Day 2026 — investor-day strategy presentation (Sydney, 5 November 2026; lodged with the ASX on 5 November 2026) setting out a single capital framework, a new 20-40% AOCF shareholder distribution policy, a 12-15% ROACE target by the mid-2030s and more than US$40 billion of adjusted operating cash flow from 2027-2032 (all amounts in US dollars, as Woodside reports).
ใช้หน้าปกของงานนำเสนอนี้เป็นต้นแบบสไตล์สำหรับสไลด์ที่สร้างจากเนื้อหาของคุณเอง หรือเลือกหน้าใดก็ได้ด้านล่างเพื่อใช้เลย์เอาต์ของหน้านั้นเป็นต้นแบบ
การนำทางด่วน
แท็ก
แชร์สไลด์
Woodside Energy Capital Markets Day 2026 — investor-day strategy presentation (Sydney, 5 November 2026; lodged with the ASX on 5 November 2026) setting out a single capital framework, a new 20-40% AOCF shareholder distribution policy, a 12-15% ROACE target by the mid-2030s and more than US$40 billion of adjusted operating cash flow from 2027-2032 (all amounts in US dollars, as Woodside reports).
มุมมองรายละเอียดของแต่ละหน้าสไลด์ รวมถึงlayout เนื้อหาหลักและองค์ประกอบภาพ
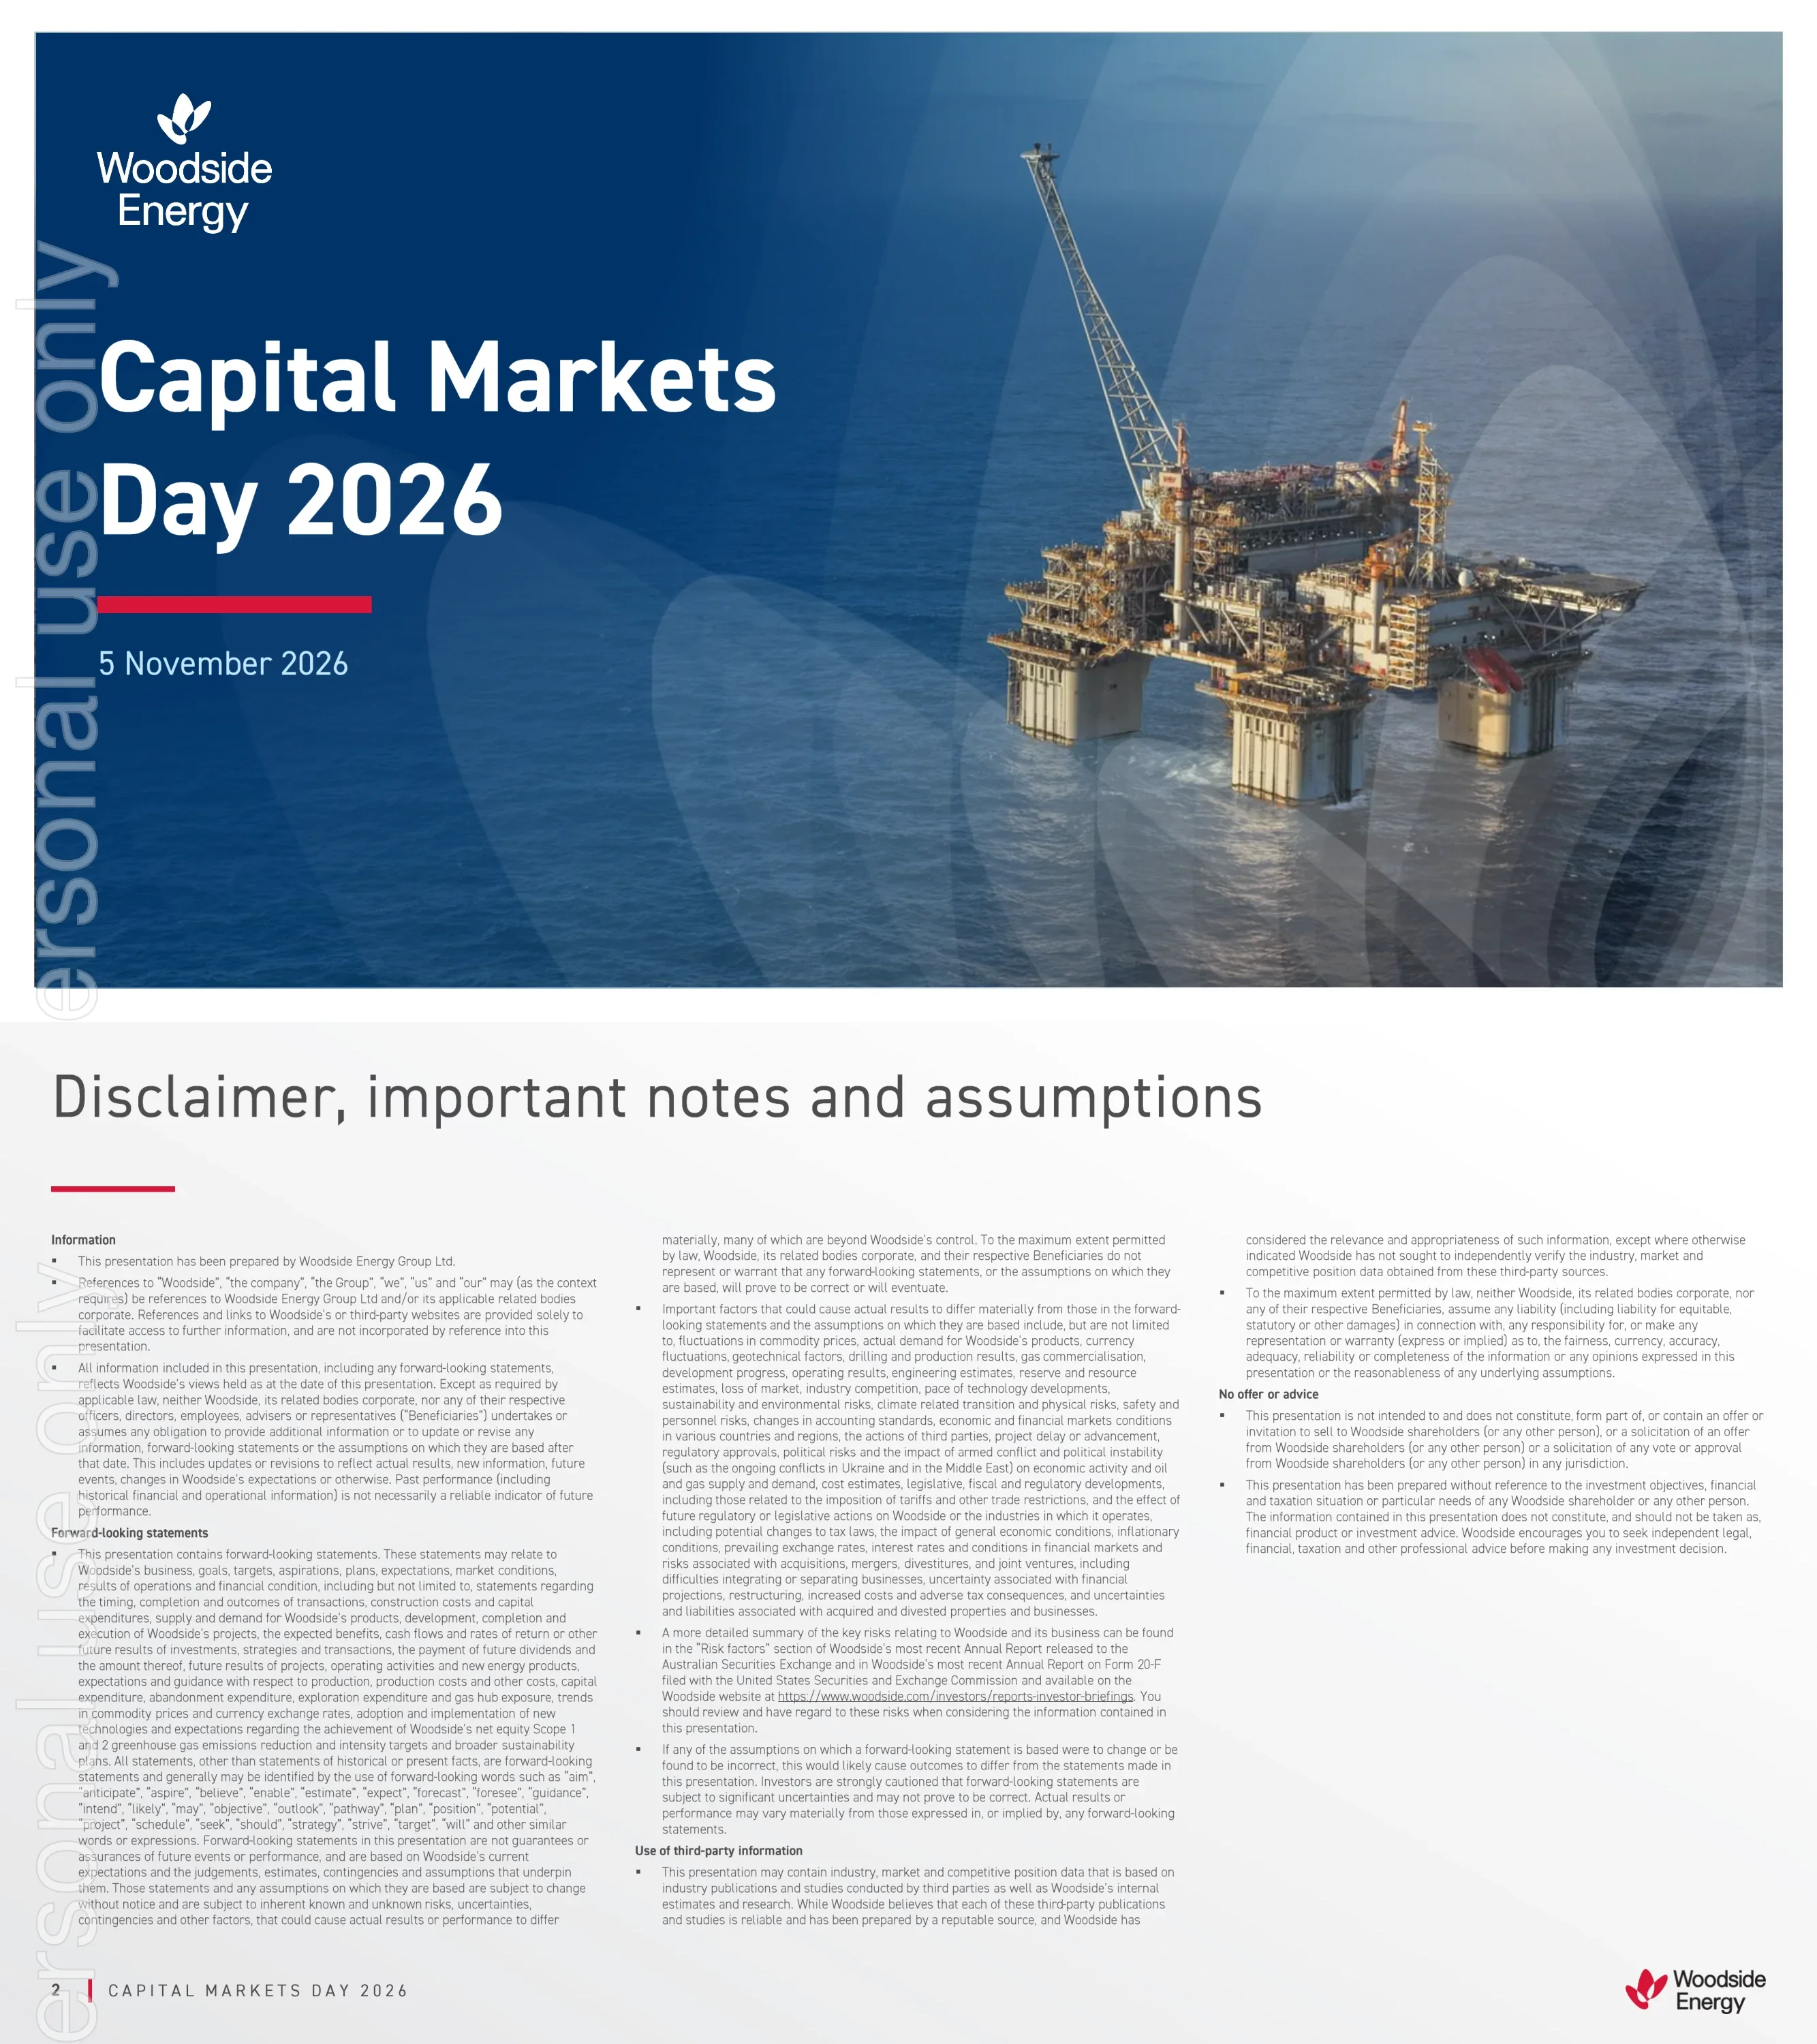
Cover slide for Woodside Energy's Capital Markets Day 2026, dated 5 November 2026.
Full-bleed photo with navy gradient on the left holding the logo, title, red accent bar and date
Legal disclaimer covering information, forward-looking statements, use of third-party information and a no-offer-or-advice notice.
Three columns of dense small-print bullets under a large grey title
Reserves disclosure and US investor cautionary note, planning assumptions (US$70/bbl Brent, US$10 JKM, US$9 TTF, US$3.50 Henry Hub), climate data notes, non-IFRS measures, and a note that all dollar figures are US currency.
Three columns of small-print bullets with bold section subheads
Thirteen numbered notes on how reserves and contingent resources are estimated and reported (SEC and SPE-PRMS), including the 5.7 Bcf per MMboe conversion factor and the qualified reserves evaluator.
Two-column numbered list of notes
Event running order from 10:00am to 11:15am: welcome, introduction, strong foundation, market fundamentals, sharpen execution, disciplined capital strategy, active portfolio management, closing remarks and Q&A, with presenters Vanessa Martin, Liz Westcott, Graham Tiver and Mark Abbotsford.
Timed agenda table on the left with presenter names in a second column; photo of hard-hatted workers on the right
Section divider introducing CEO and Managing Director Liz Westcott.
Navy gradient divider with section title, presenter line and cut-out portrait on the right
Three themes of the day: strong foundation, sharpen execution and maximise value, each with a one-line explanation.
Translucent white panel with three chevron-led headlines over an industrial plant photo
Seven action areas (deliver, cost-out, capital, returns, emissions, marketing, portfolio) alongside headline targets: ~280 MMboe annual sales in 2032, more than US$40 billion adjusted operating cash flow 2027-2032 and a 12-15% ROACE target by the mid-2030s. Woodside reports in US dollars.
Blue gradient table of seven labelled rows on the left; three large KPI figures on a dark ocean photo on the right
Section divider for the Strong foundation section.
Navy gradient divider with title and photo of two workers in orange coveralls
Diverse, LNG-led portfolio across Australia, North America, Africa and Asia; ~19 Mtpa operated LNG capacity, 40+ years operating experience and ~US$13 billion returned to shareholders since 2022.
Text and three KPIs on the left; world map with key asset, corporate office and marketing office markers on the right
North West Shelf, Pluto LNG, Scarborough and Bass Strait footprint; 2,188.1 MMboe 2P reserves and US$5.6 billion FY2025 EBITDA; sales of 131 MMboe in 2025 and ~118 MMboe in 2032.
Bullets on the left; grey panel with Australia map, key stats and a stacked bar chart of sales by product
US Gulf of America oil (Shenzi, Atlantis, Mad Dog), Sangomar in Senegal, Trion in Mexico and Louisiana LNG; 811.4 MMboe 2P reserves, US$3.4 billion FY2025 EBITDA, sales growing from 66 MMboe in 2025 to ~155 MMboe in 2032.
Bullets on the left; grey panel with Americas and Africa map, key stats and stacked bar chart
Five advantages with proof points: US$30/bbl 2027-2028 average breakeven, 98% operated LNG reliability, 21.5 Mtpa LNG capacity under construction, more than 7,700 LNG cargoes since 1989, and Baa1/BBB+ credit ratings.
Numbered list on grey, matching metrics in a blue column, and a worker portrait photo on the right
Three priority pillars (operational excellence, disciplined execution, sustained value creation) with three actions each, supported by enablers: One Team culture, digital and AI innovation, critical capabilities.
Three colour-coded column headers with stacked statements, enabler strip below, vertical plant photo on the right
What we do, what it delivers and why it matters: safe operations, lower emissions intensity and community trust lead to lower costs, stronger cash flows and higher returns.
Three white cards with chevron headers over a photo of field workers
98% average operated LNG reliability from 2022 to Q3 2026, Tier 1 and Tier 2 process safety events by year, methane emissions down 36% from 2024 to 2025, ~75% reported at OGMP 2.0 Level 5, and on track for Gold Standard status in 2027.
Three grey cards (bar chart, stacked bar chart, KPI text) with a vertical offshore platform photo
Scarborough (8 Mtpa LNG, 99% complete, first LNG cargo Q4 2026, ~US$2.9 billion p.a. AOCF), Trion (100,000 bbl/day, 71% complete, first oil 2028) and Louisiana LNG (16.5 Mtpa, 32% complete, first LNG 2029).
Three project cards with photo backgrounds and dark text overlays
More than 30% sales growth 2025-2032, AOCF of roughly US$7 billion per year through 2032, and three deployment options: discretionary distributions, portfolio and balance sheet, and growth.
Two bar charts in grey cards plus a third card listing deployment options
Four growth avenues: tiebacks in Australia and the Gulf of America, Sangomar Phase 2 backfill, Browse brownfield/greenfield (14.4 Tcf gross 2C gas, share rising to 41.27%), and the Louisiana LNG Trains 4 and 5 expansion adding 11.1 Mtpa.
2x2 grid of navy tiles, each pairing a photo with bullet text
Three takeaways: enduring competitive advantages, more than US$40 billion AOCF from 2027-2032, and multiple options to sustain growth beyond 2032.
Dark translucent panel with three numbered statements over an ocean photo
Section divider for Market fundamentals.
Navy gradient divider with title and an Asian city skyline at dusk
S&P Global base case primary energy demand by fuel, 2015-2045, for OECD (population 1.3B to 1.4B) and non-OECD (6.1B to 8.0B) economies.
Short statements on the left; two side-by-side stacked area charts on the right
Change in global energy mix by fuel from 2025 to 2045 under Current Realities and Emissions Reduction pathways; oil and gas stay above 40% of the mix, and US$8.1 trillion of upstream investment is needed.
Table of multipliers shown as coloured pills, with a navy KPI panel on the right
Recent disruptions (Russia-Ukraine, Red Sea-Panama Canal, Strait of Hormuz, new US LNG capacity, data centre growth) mapped to market responses and to demand for LNG and oil.
Two-column development/response table on grey; navy panel listing LNG and oil demand drivers
Emerging Asia gas demand versus declining domestic production, plus a Korea case study where SK Gas LNG displaces coal and waste wood, cutting ~0.2 Mt CO2-e per year from 2027.
Statements on the left, area/line chart in the centre, case study photo and bullets on the right
LNG supply (operational and under construction) against a demand range from 2015 to 2045, showing new investment is needed.
Statements on the left; stacked bar chart with a grey demand band on the right
Global oil supply and demand outlook to 2045 with onstream decline, plus OECD vs non-OECD demand change bars.
Statements on the left; area and line chart in the centre; bar chart on the right
Oil and gas remain material across decarbonisation scenarios, LNG need is long-term, and volatility raises the value of disciplined execution.
Dark translucent panel with three numbered points over an LNG jetty photo
Section divider for Sharpen execution and maximise value.
Navy gradient divider with title and close-up worker portrait
Strengths (cash today, more than US$40 billion AOCF 2027-2032, market need for LNG) versus why sharpening execution matters (flexibility, low cost, project delivery, risk-adjusted competition, focus).
Split layout: grey checklist on the left, navy star-bullet list on the right
US$400 million per year structural cost reduction from 2028: US$100m portfolio optimisation, US$130m streamlined processes, US$170m external spend; pathways include exits from Calypso, Sunrise and Bonaparte CCS, AI maintenance and 500+ workforce reduction.
Navy panel with large target figure and breakdown; grey panel listing delivery pathways
2030 absolute net equity emissions target (-30%), new 2035 intensity target (30% below a 33.3 kg CO2-e/boe 2025 baseline) and 2050 net zero aspiration, with a waterfall chart showing the intensity pathway.
Vertical timeline of three targets on the left; waterfall bar chart on the right
ROACE bridge: ~10% from the strong foundation, plus cost-out (~0.5%), marketing (~1%) and capital and returns (~1-3%), reaching a ~12-15% ROACE target by the mid-2030s.
Three rounded panels progressing from foundation to execution levers to the navy target card
Business entering its next phase, positioning for the long term, and ROACE growth through portfolio management and capital allocation.
Dark translucent panel with three numbered points over a steel construction photo
Section divider introducing EVP and CFO Graham Tiver.
Navy gradient divider with title, presenter line and portrait
What stays the same (safe operations, shareholder returns, discipline, investment grade), what changes (single capital framework, new distribution policy, ROACE target) and the value created.
Three columns: two on grey, the value column on navy
Single framework: cash from safe operations funds Priority 1 (20% AOCF base dividend, sustaining and committed capital), then Priority 2 (up to an extra 20% AOCF distributions, balance sheet, growth at IRR above 12%), with an investment grade guardrail and a 12-15% ROACE goal.
Layered navy block diagram with priority labels on the left and chevron connectors
More than US$40 billion AOCF 2027-2032 (above US$50 billion at high prices), ~US$7 billion in 2032 at US$70 Brent, US$30/bbl breakeven, and 2027 sensitivities of +US$90 million per US$1 Brent and +US$204 million per US$1 JKM.
Bullets and a sensitivity box on the left; stacked AOCF bar chart by asset with low/mid/high markers on the right
Forecast sustaining and committed capital falling after 2028 as Louisiana LNG and Trion complete, leaving rising cash for Priority 2 after the 20% AOCF base dividend.
Statements on the left; two bar charts on the right
~US$17 billion available for Priority 2 from 2027-2032 at US$70 Brent, rising by ~US$9 billion at US$85 Brent; options are discretionary distributions, portfolio and balance sheet, and growth.
Statements on the left; paired bar chart of sources and uses by price case; light blue options panel
Average annual AOCF of ~US$7 billion leaves ~US$4.6 billion for Priority 2 after ~US$1 billion sustaining capital and ~US$1.4 billion base dividend; growth capacity ~US$3-4 billion per year; assessment criteria wheel around the 12-15% ROACE goal.
Statements on the left, vertical allocation bar in the centre, circular criteria diagram on the right
Target of 20% of AOCF as base dividend plus up to 20% as additional dividends or buybacks, with Board discretion; changes reflect cash generation, predictability, flexibility and peer alignment.
Left card with two percentage tiles joined by a plus sign; right card with four check-marked benefits
From 2H24 to 1H26, US$4.2 billion paid at 80% of underlying NPAT versus an illustrative US$5.4 billion at 40% of AOCF; half-year bar chart compares the methods.
KPI figures on the left, stacked bar chart in the centre, navy look-forward panel on the right
Debt maturity profile (drawn and undrawn) to 2054, and net debt and gearing before Priority 2 turning to a net cash build by 2032.
Statements on the left; debt maturity bar chart and net debt/gearing combo chart on the right
Single framework for higher ROACE, returns linked to cash generation, and a strong balance sheet that creates choices.
Dark translucent panel with three numbered points over a welding photo
Section divider introducing EVP and Chief Commercial Officer Mark Abbotsford.
Navy gradient divider with title, presenter line and portrait
Shape the portfolio (NWS asset swap, Calypso and Sunrise exits, BNA review, Browse pre-emption), optimise every molecule (marketing worth ~1% ROACE) and grow with discipline.
Three white cards with chevron headers and sub-cards over an LNG carrier photo
Three focus areas (multi-basin LNG, deepwater oil, market-led new energy) and four participation models along an ownership spectrum: own/operate, partner, contract, recycle capital.
Three photo tiles on top; four coloured participation headers and a gradient arrow below
Sales rising from 212 MMboe in 2025 to ~280 MMboe in 2032, with ~11 Mtpa of LNG SPAs signed in two years, including KOGAS, JERA, CPC, SK Gas, China Resources, Petronas, Uniper, BOTAS and QatarEnergy.
Statements on the left; stacked bar chart and SPA table in a grey panel
~75% of LNG volumes committed for 2027-2028, with LNG and total portfolio exposure split by crude-linked, fixed, gas hub and uncommitted volumes for 2027-2028 and 2029-2032.
Statements on the left; two pairs of 100% stacked bars on the right
Evolution from equity marketing to integrated portfolio to physical-backed trading, projected to add ~1% ROACE by the early 2030s.
Three-step model progression on top, four icon pills below, navy value-creation panel on the right
Asian LNG demand ~3x by 2040, European LNG demand up more than 30%, US$8.1 trillion upstream investment need; Pacific basin, Atlantic basin and backfill growth options.
Three grey cards with headline metrics and option lists; navy disciplined-growth panel on the right
Actively shape the portfolio, optimise value from products and assets, and pursue growth that uses competitive advantages.
Dark translucent panel with three numbered points over an LNG plant photo
Section divider introducing the CEO's closing remarks.
Navy gradient divider with title, presenter line and portrait
Summary of headline numbers: more than US$40 billion AOCF 2027-2032, ~280 MMboe sales in 2032, oil and gas above 40% of 2045 energy mix, US$8.1 trillion investment need, US$400 million per year cost-out, 12-15% ROACE target and a 20-40% AOCF distribution policy.
Four white KPI cards over a dimmed industrial photo
Investment case: differentiated global platform, raising an already high bar, and a step-up in cash generation.
Translucent panel with three chevron themes on the left; numbered explanations on a navy overlay on the right
Divider for the Q&A session.
Navy gradient divider with title only
Divider for the appendix.
Navy gradient divider with title only
Timeline from 1984 domestic gas from NWS through the BHP petroleum merger (2022), Louisiana LNG FID (2025), Scarborough first LNG (Q4 2026), Trion first oil (2028) and Louisiana LNG first LNG (2029).
Horizontal decade timeline with alternating above/below milestones over an FPSO photo
Opportunities in the reference case and low/mid/high price decks: Brent US$55/70/85, Henry Hub US$2.5/3.5/4.5, JKM US$7/10/13, TTF US$6/9/12, carbon US$80/t and AUD:USD 0.65.
Two tables side by side with navy headers
Louisiana LNG accounting treatment (100% consolidation with NCI) and how adjusted operating cash flow under the 2026 methodology compares with the 2025 methodology.
Explanatory text on the left; methodology comparison table on the right
Reconciliation from net operating cash flow (US$13,659 million total) to AOCF (US$13,521 million) for 2H24-1H26, with a 20-40% payout of ~US$2.7-5.4 billion versus US$4,218 million paid at 80% NPAT.
Full-width financial table with comments column
Guidance: production 174-181 MMboe, capex US$4,000-4,500 million, production costs US$1,500-1,800 million, D&A US$4,200-4,700 million, income tax and PRRT paid US$1,300-1,700 million; unchanged from the Q3 report.
Full-width guidance table with units, ranges, references and comments
CMD 2026 AOCF by asset compared with CMD 2025; variances are immaterial after adjusting for pricing, removal of Beaumont New Ammonia and the Louisiana LNG expansion.
Bullets on the left; stacked bar chart with orange CMD 2025 markers on the right
Processing up to 8 Mtpa of Scarborough gas through Pluto Trains 1 and 2 over time, with up to 225 TJ/d of domestic gas.
Key facts on the left; period-by-period gas flow table on the right
Ownership of Scarborough JV (Woodside 74.9%), Pluto Train 2 JV (51%/GIP 49%), Pluto JV, Pluto Train 1 Co. and Burrup Common Facilities Co., with physical and toll flows.
Box-and-arrow structure diagram with partner logos and percentages
HoldCo (Woodside 90%, Williams 10%), InfrastructureCo (60% HoldCo, 40% Stonepeak), Driftwood Pipeline (Woodside 20%) and LNG offtake of 8 Mtpa to the Woodside portfolio.
Left-to-right box-and-arrow diagram linking pipeline, gas supply, HoldCo, InfraCo and offtake
16.5 Mtpa split between Woodside portfolio sales (~8 Mtpa), strategic partners, Williams (1.5 Mtpa) and third-party buyers such as Uniper and QatarEnergy.
Bullets on the left; donut chart with labelled segments on the right
Definitions from US dollar units and AOCF through EBITDA, FID, free cash flow and gearing.
Three-column two-cell glossary table
Definitions from GHG through LNG, net debt, net GHG emissions, NPAT, OGMP 2.0 and operator terms.
Three-column two-cell glossary table
Definitions from other cash cost margin through ROACE, Scope 1-3 emissions, starting base, sustainability, Tier 1/2 process safety events and unit production cost.
Three-column two-cell glossary table
Woodside head office (Mia Yellagonga, Perth), postal address, phone, email, ABN and social media links.
White contact panel on the left, large photo of a worker reviewing documents at an LNG plant on the right
คำถามทั่วไปเกี่ยวกับสไลด์นี้และเนื้อหาการนำเสนอพื้นฐาน
It is the 72-page slide deck Woodside Energy Group presented at its Capital Markets Day in Sydney on 5 November 2026 and lodged with the ASX the same day. It covers strategy, market fundamentals, the new capital framework, shareholder distribution policy and portfolio management.
No. This is an investor-day strategy event deck, not a quarterly or half-year results release. It sets out medium- and long-term targets and frameworks; the 2026 full-year guidance on page 63 is restated as unchanged from the Q3 report.
Woodside reports in US dollars. All dollar amounts in the deck, such as more than US$40 billion of AOCF from 2027-2032 and the US$400 million per year cost-out target, are in US$ unless stated otherwise.
The deck targets a portfolio ROACE of 12-15% by the mid-2030s, ~280 MMboe of sales in 2032 (more than 30% growth from 2025), a US$400 million per year structural cost reduction from 2028, and more than US$40 billion of adjusted operating cash flow from 2027-2032 at US$70 Brent. These are indicative, not guidance.
Woodside targets a base dividend of 20% of adjusted operating cash flow plus up to a further 20% of AOCF as additional dividends, buybacks or both, with the Board keeping discretion. It replaces the previous payout based on underlying NPAT.
Scarborough (99% complete, first LNG cargo targeted Q4 2026), Trion in Mexico (71% complete, first oil 2028) and Louisiana LNG (16.5 Mtpa, 32% complete, first LNG 2029), plus growth options such as Browse, Sangomar Phase 2 and Louisiana LNG Trains 4 and 5.
Yes, as a design and structure reference. It shows how to sequence an investor day with section dividers, key takeaways, KPI slides, capital framework diagrams and a detailed annexure. The content itself belongs to Woodside and should not be presented as your own.
Pages 58-71 include a company timeline, key price assumptions (low/mid/high Brent, Henry Hub, JKM and TTF), alternative performance measure definitions, a dividend look-back reconciliation, 2026 full-year guidance, Scarborough and Louisiana LNG structure diagrams, and a three-page glossary.
Official investor relations page referenced in the deck's disclaimer, where Woodside publishes its presentations and reports.

Create Your Own Slides
Turn your ideas into professional presentations in seconds with 2slides AI.
อ้างอิงการออกแบบมืออาชีพ เลือกสไตล์ของคุณ และสร้างสไลด์ด้วยการแสดงผลข้อความที่สมบูรณ์แบบ ขับเคลื่อนโดย Nano Banana—เริ่มสร้างการนำเสนอของคุณตอนนี้
เอเจนต์ AI ของคุณสำหรับสไลด์ ประหยัดเวลา เปล่งประกายเร็วขึ้นด้วยการสร้างงานนำเสนออัจฉริยะ


© 2026 2slides สงวนลิขสิทธิ์