
Texas Instruments Capital Management 2026 — TI's annual capital management call deck (February 24, 2026) covering its free-cash-flow-per-share objective, 2025 scorecard results and 2026 targets, 300mm manufacturing investment, market segmentation, R&D allocation and cash returns to shareholders.
การนำทางด่วน
แท็ก
แชร์สไลด์
Texas Instruments Capital Management 2026 — TI's annual capital management call deck (February 24, 2026) covering its free-cash-flow-per-share objective, 2025 scorecard results and 2026 targets, 300mm manufacturing investment, market segmentation, R&D allocation and cash returns to shareholders.
มุมมองรายละเอียดของแต่ละหน้าสไลด์ รวมถึงlayout เนื้อหาหลักและองค์ประกอบภาพ
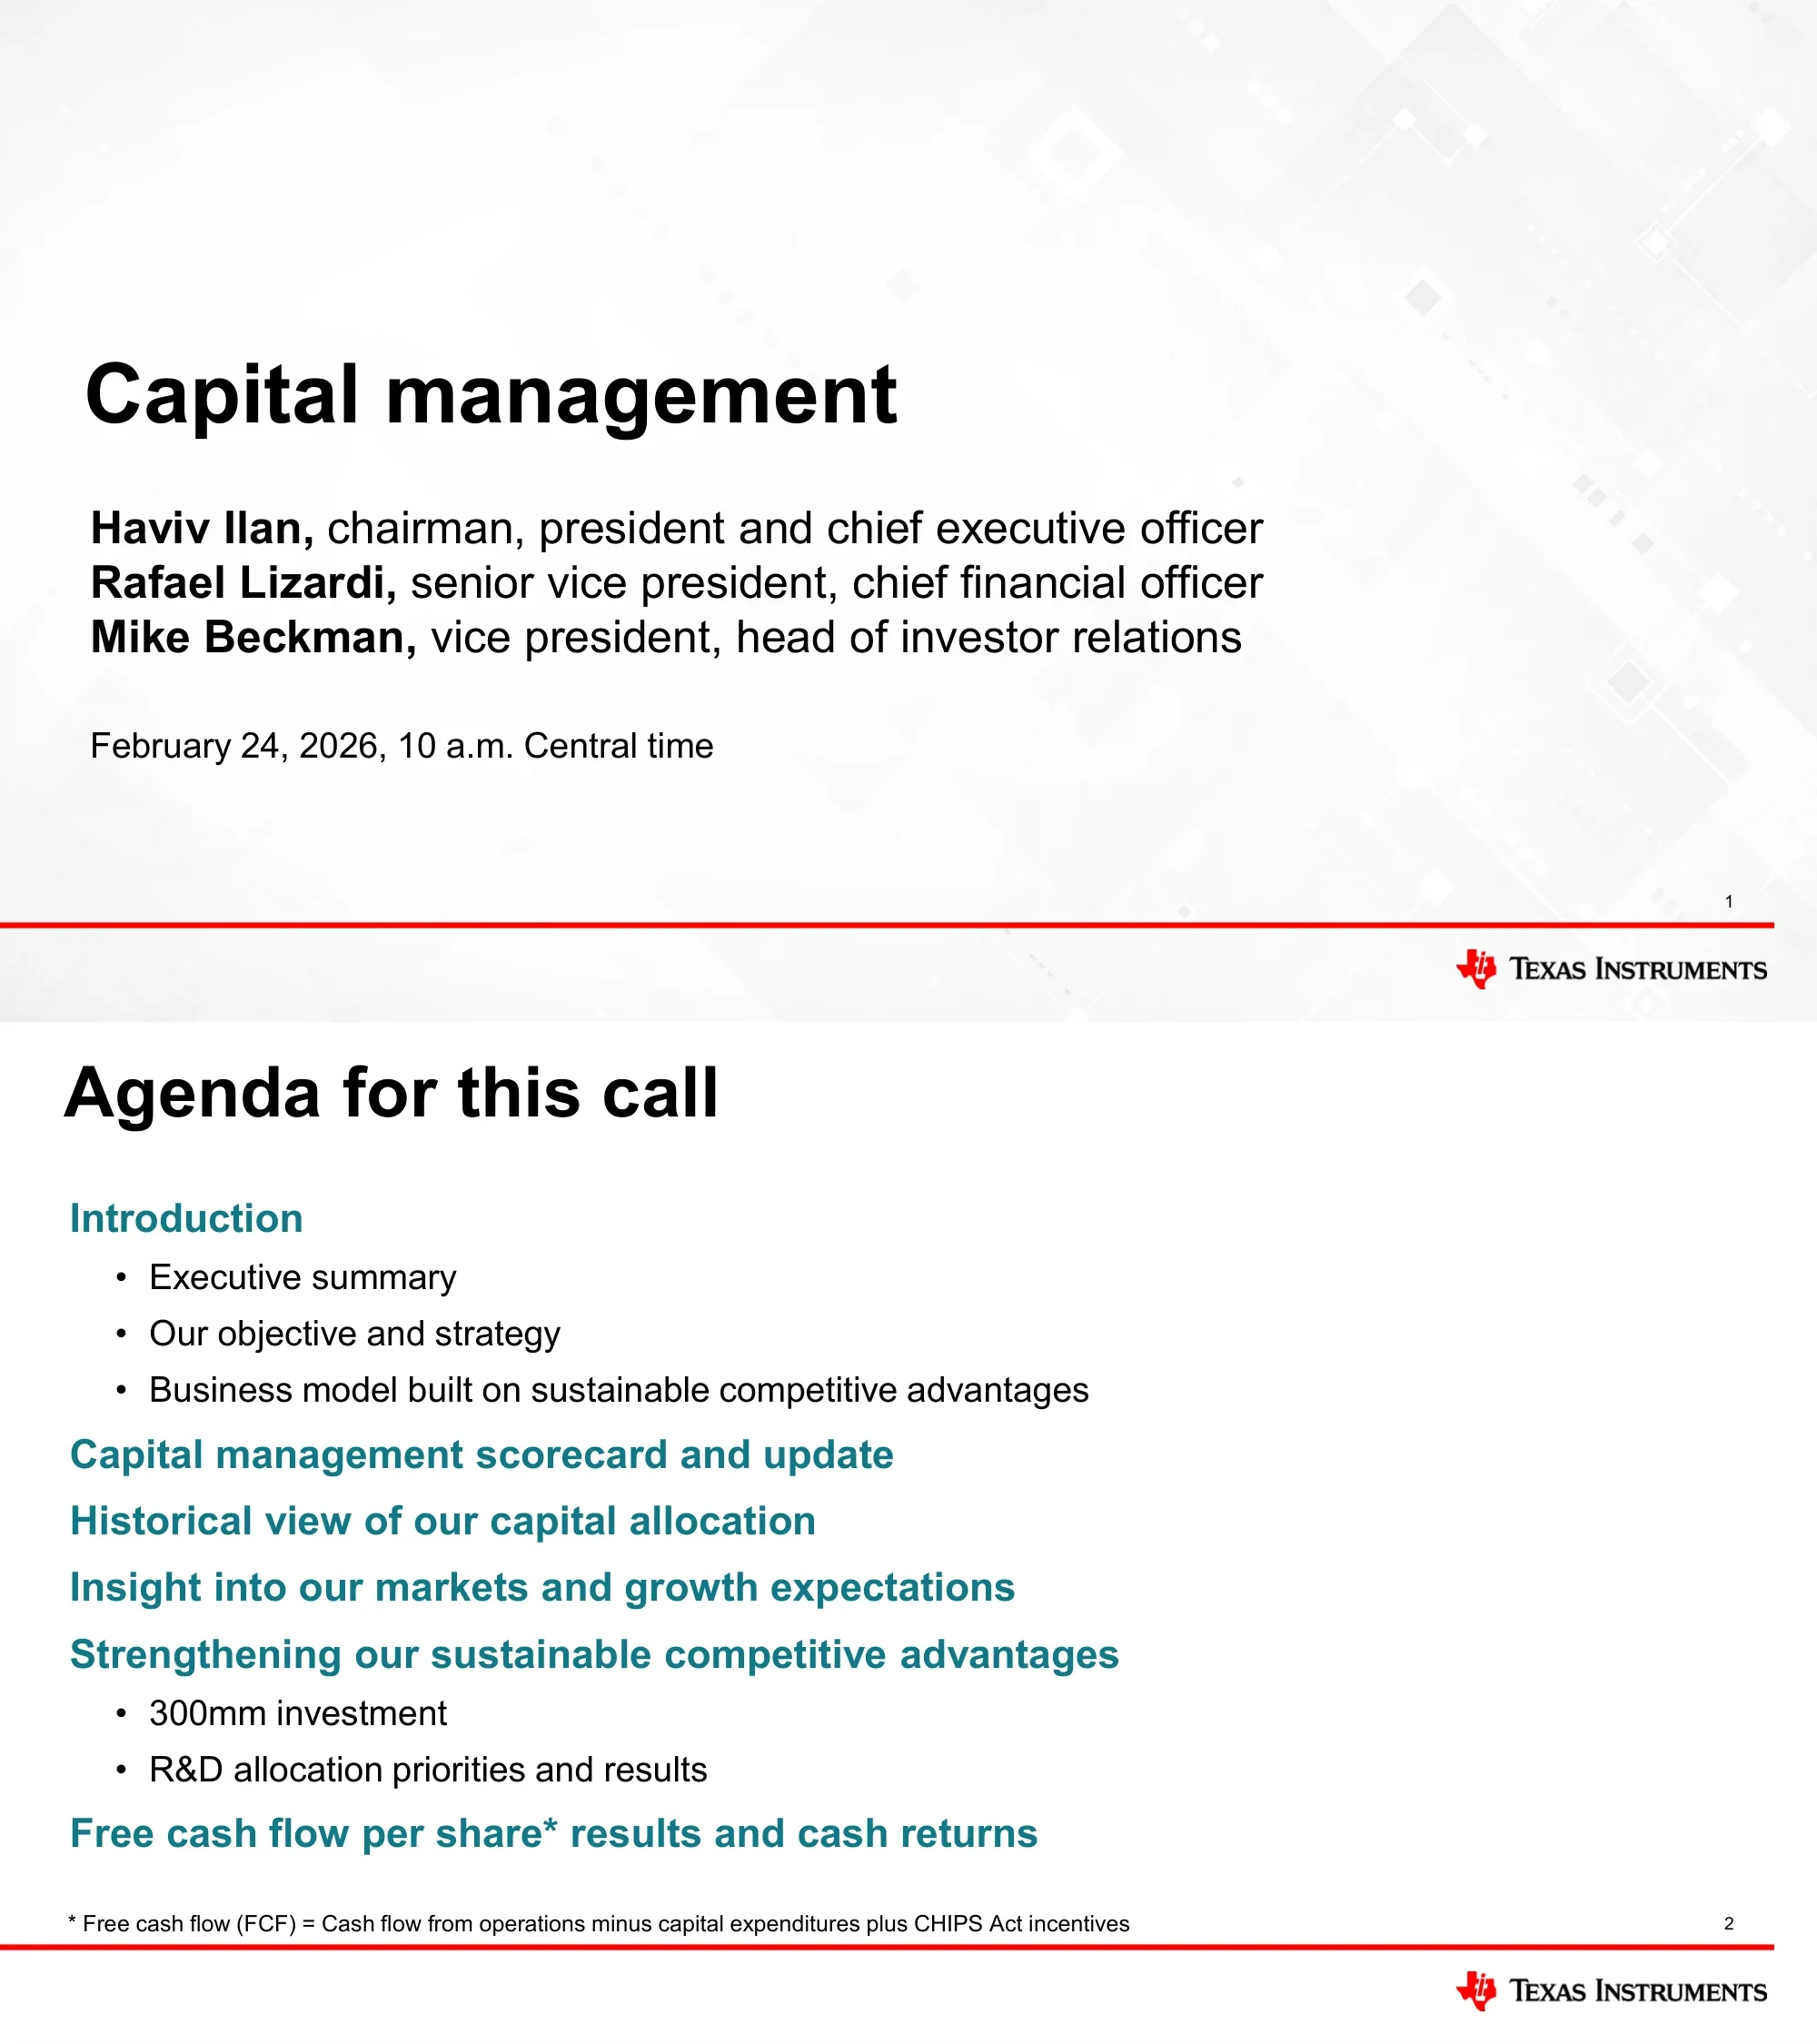
Title slide for TI's capital management call on February 24, 2026, 10 a.m. Central time, presented by Haviv Ilan (chairman, president and CEO), Rafael Lizardi (SVP and CFO) and Mike Beckman (VP, head of investor relations).
Left-aligned bold title with speaker names and roles below on a light gray abstract circuit-pattern background; red rule and Texas Instruments logo in the footer.
Agenda covering introduction (executive summary, objective and strategy, business model), capital management scorecard and update, historical view of capital allocation, market and growth expectations, strengthening competitive advantages (300mm investment, R&D allocation) and FCF per share results and cash returns. A footnote defines free cash flow as cash flow from operations minus capital expenditures plus CHIPS Act incentives.
Single-column agenda with teal section headings and indented gray bullet sub-items; definition footnote at bottom.
Six principles: TI runs the company as a long-term owner; growth of free cash flow per share is the primary driver of long-term value; strategy is a great business model, disciplined capital allocation and efficiency; the business model rests on four competitive advantages; and after accretive investments, remaining cash is returned via dividends and share repurchases.
Teal sub-heading 'At Texas Instruments:' followed by six bullets separated by thin horizontal rules in a list-table style.
Objective: maximize long-term growth of free cash flow per share. Strategy: (1) a great business model focused on analog and embedded products built on four sustainable competitive advantages, (2) discipline in allocating capital to the best opportunities, (3) efficiency, meaning more output for every dollar spent.
Two stepped gray panels, 'Objective' top-left and 'Strategy' bottom-right, connected by a large gray elbow arrow; numbered list with bold key phrases.
A pyramid of four competitive advantages (manufacturing and technology, broad portfolio of analog and embedded products, reach of market channels, diversity and longevity) mapped to tangible benefits: lower costs and supply chain control, more opportunity per customer, access to more customers and sockets, and less single-point dependency with longer returns.
Left-side layered pyramid diagram with connector lines leading to four benefit statements under a teal 'What we get (tangible benefit)' heading, on a light gray panel.
Scorecard of eight metrics with long-term objective, target and result: FCF target 25-35% of revenue vs. 17% result; gross CapEx ~$5B per year for 2023-2025; inventory 130 to >200 days; cash at 10% of TTM revenue plus NTM dividends; debt when economics make sense; return all FCF; dividends at 40-80% of FCF with a 4% increase; repurchases equal to FCF minus dividends. Most rows are marked with checkmarks.
Full-width four-column table with teal header row (Metric, Long-term objective, Target, Result) and alternating light gray rows; footnote that gross CapEx excludes CHIPS Act benefits.
Updated targets for 2026: FCF 25% to 35% of TTM revenue; gross CapEx ~$2B to $3B in 2026 with 2027+ dependent on revenue and expected growth; inventory raised to 150 to 250 days with a revised objective of competitive and stable lead times; cash, debt, cash return, dividend (40% to 80% of FCF) and repurchase targets unchanged. Changed targets are shown in red.
Three-column teal-header table (Metric, Long-term objective, Target) mirroring the prior slide, with red text flagging revised targets.
TI allocated $109B of capital from 2016 to 2025. The largest share went to R&D, sales/marketing, CapEx and inventory (organic growth, roughly $50B), followed by dividends (appeal to a broader set of investors), share repurchases (accretive capture of future FCF) and a small amount for acquisitions (inorganic growth).
Left panel horizontal bar chart in billions under a teal 'Capital allocated: $109B' header; teal arrows point right to a 'Purpose' column of gray boxes matching each bar.
Section divider introducing the discussion of market environment and growth expectations.
Large bold left-aligned section title on a light gray abstract geometric background.
Line chart of semiconductor market units shipped (WSTS, excluding memory, TTM monthly average in billions) from the late 1980s to 2025 with a long-term trendline. Takeaways: market recovery is continuing, at a more modest pace than previous upturns, while secular content growth continues and confidence in the strategic opportunity remains high.
Left two-thirds line chart with red dots marking cycle peaks and a gray extrapolated trend curve; right-side bullet commentary.
TI re-segmented its end markets. Previous 2025 segmentation: industrial 34%, automotive 33%, personal electronics 20%, enterprise systems 6%, comms equipment 5%. Updated segmentation: industrial 33%, automotive 33%, data center 9%, personal electronics 21%, comms equipment 3%. Industrial, automotive and data center made up ~75% of 2025 revenue and receive additional strategic emphasis; calculators were about 1% of revenue.
Two stacked 100% columns (previous vs. updated) in red, gray, teal and dark gray with a black arrow between them and a bracket labeling 75% of revenue; right-side gray panel with bold-emphasis bullets.
Three columns for automotive (~$5.8B 2025 revenue), industrial (~$5.8B) and data center (~$1.5B), each listing applications (e.g., ADAS, EV powertrain, industrial automation, robotics, rack power) and general-purpose vs. application-specific products such as mmWave radar, GaN power stages, real-time control MCUs and multiphase controllers. Banner: TI industrial, automotive and data center grew at an 8% CAGR from 2013 through 2025.
Three-column grid with colored headers (red automotive, gray industrial, teal data center), photo strips, and two sub-columns of product bullets; dark footer banner with the CAGR statement.
Summary of the growth section: industrial, automotive and data center grew from about 43% of revenue in 2013 to about 75% in 2025; breadth of analog and embedded products plus process and package technology investment strengthens the portfolio; exposure to large, diverse, fast-growing markets positions TI to capture the opportunity ahead.
Single light gray content panel with teal top rule containing three bold-lead bullets.
Section divider introducing the discussion of 300mm manufacturing investment and R&D allocation.
Two-line bold section title on the light gray abstract background.
Revisits the competitive-advantage pyramid with 'Manufacturing and technology' highlighted, framing the goal of extending TI's 300mm cost advantage and gaining greater control of its supply chain.
Pyramid diagram on the left with the base tier outlined in red; large black headline and teal subheadline on the right, inside a gray panel.
Four benefits: support for growth (manufacturing capacity supports growth for decades); control of supply (>90% of wafers, assembly and test manufactured internally); optimal technology (28nm to 130nm process technology optimized for analog and embedded); structural cost advantage (300mm provides ~40% lower cost and ~2.3x chips per wafer vs. 200mm). Banner: providing geopolitically dependable capacity.
Four equal columns each led by a teal triangle marker and teal heading with bolded key facts; full-width teal banner at the bottom.
Illustration of gross margin impact for an example part selling at $1.00: chip cost falls from $0.20 on 200mm to $0.12 on 300mm, assembly/test/other stays at $0.20, total cost drops from $0.40 to $0.32, and gross margin rises from 60% to 68%.
Centered comparison table with teal column headers (200mm vs. 300mm wafer) and red curved arrows linking the price and gross margin values.
Three-phase plan delivered on time and on budget: Phase 1 (2021-2026) transfers and incremental growth (equip RFAB2, shut 150mm fabs, qualify LFAB1, move foundry wafers into LFAB1); Phase 2 (2022-2026) new fab preparation (LFAB2 cleanroom, SM1 pilot line, SM2 shell); Phase 3 (2026+) modular capacity ramped to demand to deliver FCF per share growth. A Gantt timeline runs from before 2020 to 2035+ for Richardson, Lehi and Sherman.
Three phase columns with colored headings (black, red, teal) and bullets above a horizontal Gantt chart with teal year header and gray, dark gray, red and teal bars per site.
Same three-phase roadmap and Gantt chart as the previous slide, now annotated with status: RFAB2, LFAB1 qualifications, SM1 cleanroom/pilot line and SM2 shell marked complete, and LFAB2 cleanroom marked ongoing.
Build of the prior slide with green checkmark 'complete' badges and an 'ongoing' tag overlaid on the timeline bars.
Profiles of three sites: Richardson, Texas (RFAB), with RFAB2 more than doubling RFAB1 capacity since 2021; Lehi, Utah (LFAB), where LFAB1 supports external foundry transfers including Silicon Labs products in 28nm to 65nm and LFAB2 shell construction is on track; Sherman, Texas (SM), where the SM1 cleanroom and pilot line are complete and the SM2 shell is complete. All use 28nm to 130nm nodes.
Three-column layout with gray header labels, labeled aerial photos of each fab campus and bullet descriptions; teal footer banner.
Bar chart of gross CapEx from 2019 to 2026, with an elevated CapEx period in 2021-2025 peaking around $5B and 2026 estimated at ~$2B to $3B. Key metrics 2022 vs. 2026: wafers internal 80% to >90%, internal wafers on 300mm 40% to >70%, assembly internal 60% to >85%; target of >95% internal wafers and >80% on 300mm by 2030.
Left column bar chart in teal with a boxed 'Elevated CapEx' region and a lighter range bar for 2026, above a small teal-header metrics table; bullet commentary on the right.
Section intro on R&D investments strengthening technology and the product portfolio while improving diversity and longevity, with the pyramid highlighting 'Broad portfolio of analog and embedded products' and 'Diversity and longevity'.
Pyramid diagram on the left with two tiers outlined in red; large black headline and teal subheadline on the right inside a gray panel.
Table of R&D investment direction and share of TI revenue for 2013, 2024 and 2025: industrial up broadly (28%, 33%, 33%), automotive up broadly (12%, 35%, 33%), data center up broadly (3%, 6%, 9%), personal electronics steady (37%, 22%, 21%), communications equipment steady (15%, 3%, 3%).
Full-width table with teal merged header ('% of TI revenue' spanning three years) and alternating gray rows.
Same R&D table with red ovals circling the industrial, automotive and data center shares, showing their combined total rising from 43% in 2013 to 75% in 2025.
Build of the previous table with hand-drawn-style red ellipses and red totals (43% and 75%) overlaid on the 2013 and 2025 columns.
Section divider introducing results on free cash flow per share and returns to shareholders.
Two-line bold section title on the light gray abstract background.
Combo chart from 2004 to 2025 of operating cash flow (teal bars), CapEx (gray bars) and CapEx as % of revenue (red line). 2025 operating cash flow was $7.2B including $300M of inventory growth; CapEx was $4.6B, or 26% of revenue, and is declining as capacity expansions near completion.
Dual-axis clustered bar and line chart on the left (billions and percent), bullet commentary on the right.
Line chart of TXN free cash flow per share from 2004 with a 2004-2022 trendline growing ~11% annually; FCF per share dropped during the elevated CapEx period and is beginning to approach the trendline in 2026. TI says it is on track to deliver more than $8 of FCF per share at the current 2026 revenue consensus (CapIQ as of 2/20/2026).
Line chart with red exponential trendline, a boxed 'Elevated CapEx' region and a teal range bar for 2026; bullets on the right and footnotes below.
Annual dividend per share from $0.09 in 2004 to $5.68 (Q4 2025 annualized). TI has increased its dividend for 22 consecutive years, including a 4% increase to $1.42 per share in Q4 2025, with ~8% five-year and ~15% ten-year CAGR and a 2.58% yield as of 2/20/2026.
Full-width teal column chart with data labels above each bar, followed by three bullets and a footnote.
Column chart of basic shares outstanding (billions) from 2004 to 2025 showing a 47% reduction. TI repurchases steadily when discounted cash flow value exceeds the stock price, stays disciplined with stock-based compensation and had $18.8B of authorization remaining as of December 31, 2025.
Full-width teal declining column chart with bold chart title, bullets beneath.
Stacked column chart of TXN cash returned per share from 2004 to 2025, split into dividends (teal) and repurchases (gray). 2025 return was $7.13 per share, up 14% vs. 2024; TI returned 130% of free cash flow over the last ten years, with 13% compound annual growth from 2004 to 2025.
Stacked column chart on the left with legend; right-side callout panel with the headline figure and bullets.
Three S&P 500 distribution charts: FCF as % of revenue (TI 52nd percentile; 87th percentile on operating cash flow), cash returns as % of revenue (TI 94th percentile) and return on invested capital (TI 70th percentile). Source: CapIQ and public filings as of 02/20/2026.
Three side-by-side panels with gray headers, each containing a gray descending area distribution with a red marker line and teal arrow callouts for TI's position.
Closing principles: TI's engineers pursue making electronics more affordable through semiconductors; the founders built a culture to thrive long term; long-term growth of FCF per share remains the ultimate measure of value; and TI will think like owners, adapt and behave in a way that makes stakeholders proud.
Four bullets separated by thin rules, matching the executive summary format on page 3.
Brand closing slide showing the Texas Instruments logo.
Large red TI state-outline emblem with black serif wordmark centered-left on a white background with subtle gray geometry.
Forward-looking statement notice referencing the Private Securities Litigation Reform Act of 1995 and Item 1A of TI's Form 10-K, plus a non-GAAP disclosure explaining that free cash flow and related ratios are non-GAAP, with a reconciliation at www.ti.com/ir, and that FCF per share is not an alternative to EPS.
Two text paragraphs, the first in black and the non-GAAP paragraph in red, with the IR link underlined.
Legal disclosure for TI's February 4, 2026 agreement to acquire Silicon Labs for $231.00 per share in cash, an enterprise value of about $7.5B, expected to close in the first half of 2027 and be accretive to EPS in the first full year excluding transaction costs; TI remains committed to returning 100% of FCF over time. Also covers additional information and participants in the proxy solicitation.
Full-page small-type legal text with bold section headings.
States the communication is not an offer to sell or solicitation to buy securities, and provides the cautionary statement on forward-looking statements for the Silicon Labs transaction, listing risks such as regulatory approval (Hart-Scott-Rodino), stockholder approval, business disruption, litigation, unexpected costs and the global memory chip shortage.
Full-page small-type legal text under two bold headings.
คำถามทั่วไปเกี่ยวกับสไลด์นี้และเนื้อหาการนำเสนอพื้นฐาน
It is the 36-slide deck from TI's annual capital management call held on February 24, 2026, presented by CEO Haviv Ilan, CFO Rafael Lizardi and IR head Mike Beckman. It explains TI's objective of maximizing long-term free cash flow per share, reviews the 2025 capital management scorecard, sets 2026 targets and covers 300mm manufacturing, R&D allocation, dividends and buybacks.
Highlights include 2025 operating cash flow of $7.2B, CapEx of $4.6B (26% of revenue), $109B of capital allocated from 2016 to 2025, 2026 gross CapEx guidance of ~$2B to $3B, more than $8 of expected FCF per share at 2026 consensus revenue, a 4% dividend increase to $1.42 per quarter, $7.13 of cash returned per share in 2025 and a 47% reduction in shares outstanding since 2004.
It opens with a title, agenda, executive summary and objective/strategy slides, then moves through the 2025 and 2026 scorecards and capital allocation history, a growth-expectations section on markets and segmentation, a competitive-advantages section on 300mm fabs and R&D, and a free-cash-flow and cash-returns section, before closing with a summary, logo slide and legal disclosures. Section divider slides separate each part.
It says 300mm wafers provide about 40% lower chip cost and ~2.3x chips per wafer versus 200mm, illustrated as gross margin rising from 60% to 68% on an example $1.00 part. A three-phase Gantt roadmap covers the Richardson, Lehi and Sherman fabs, with a target of more than 90% internal wafers by 2026 and more than 95% internal and over 80% on 300mm by 2030.
It uses a clean corporate style on a white background with a teal primary color, red accents and gray panels. Headlines are bold black sans-serif, and every slide has a thin red footer rule with the Texas Instruments logo at the bottom right. Tables get teal header rows, and charts mostly use teal bars with red trendlines or highlight markers.
Useful patterns include the metric/objective/target/result scorecard table, the pyramid-to-benefits framework diagram, the before/after stacked columns for a segment mix change, the multi-site Gantt timeline with completion badges, the dual-axis cash flow and CapEx chart, the dividend-per-share column chart with data labels and the three-panel S&P 500 percentile ranking.
TI replaced its enterprise systems category with a data center segment. On the updated basis, 2025 revenue was industrial 33%, automotive 33%, data center 9%, personal electronics 21% and comms equipment 3%. Industrial, automotive and data center together made up about 75% of revenue, up from about 43% in 2013.
The official deck, non-GAAP reconciliations and related filings are on the Texas Instruments Investor Relations site at investor.ti.com.
Official source for TI's capital management presentations, earnings materials, non-GAAP reconciliations and SEC filings.

Create Your Own Slides
Turn your ideas into professional presentations in seconds with 2slides AI.
อ้างอิงการออกแบบมืออาชีพ เลือกสไตล์ของคุณ และสร้างสไลด์ด้วยการแสดงผลข้อความที่สมบูรณ์แบบ ขับเคลื่อนโดย Nano Banana—เริ่มสร้างการนำเสนอของคุณตอนนี้
Your AI Agent for slides. Save time, shine faster with intelligent presentation creation.




© 2026 2slides. All rights reserved.