
อยู่ในคอลเลกชัน ตัวอย่างงานนำเสนอสำหรับนักลงทุน · ตัวอย่างพรีเซนเทชันนักลงทุนญี่ปุ่น
Shionogi H1 FY2026 Earnings Presentation — Shionogi & Co., Ltd. (TSE: 4507) results for the six months ended September 30, 2026, an upward revision of the FY2026 forecast, the planned acquisition of IntraBio (AQNEURSA), and financial policy. This is a Japanese-language deck (original title 2026年度 第2四半期(中間期)決算説明資料) dated October 29, 2026 and published on TDnet, the Tokyo Stock Exchange's timely disclosure system; all figures are in ¥100 million (億円) unless noted.
ใช้หน้าปกของงานนำเสนอนี้เป็นต้นแบบสไตล์สำหรับสไลด์ที่สร้างจากเนื้อหาของคุณเอง หรือเลือกหน้าใดก็ได้ด้านล่างเพื่อใช้เลย์เอาต์ของหน้านั้นเป็นต้นแบบ
การนำทางด่วน
แท็ก
แชร์สไลด์
Shionogi H1 FY2026 Earnings Presentation — Shionogi & Co., Ltd. (TSE: 4507) results for the six months ended September 30, 2026, an upward revision of the FY2026 forecast, the planned acquisition of IntraBio (AQNEURSA), and financial policy. This is a Japanese-language deck (original title 2026年度 第2四半期(中間期)決算説明資料) dated October 29, 2026 and published on TDnet, the Tokyo Stock Exchange's timely disclosure system; all figures are in ¥100 million (億円) unless noted.
มุมมองรายละเอียดของแต่ละหน้าสไลด์ รวมถึงlayout เนื้อหาหลักและองค์ประกอบภาพ
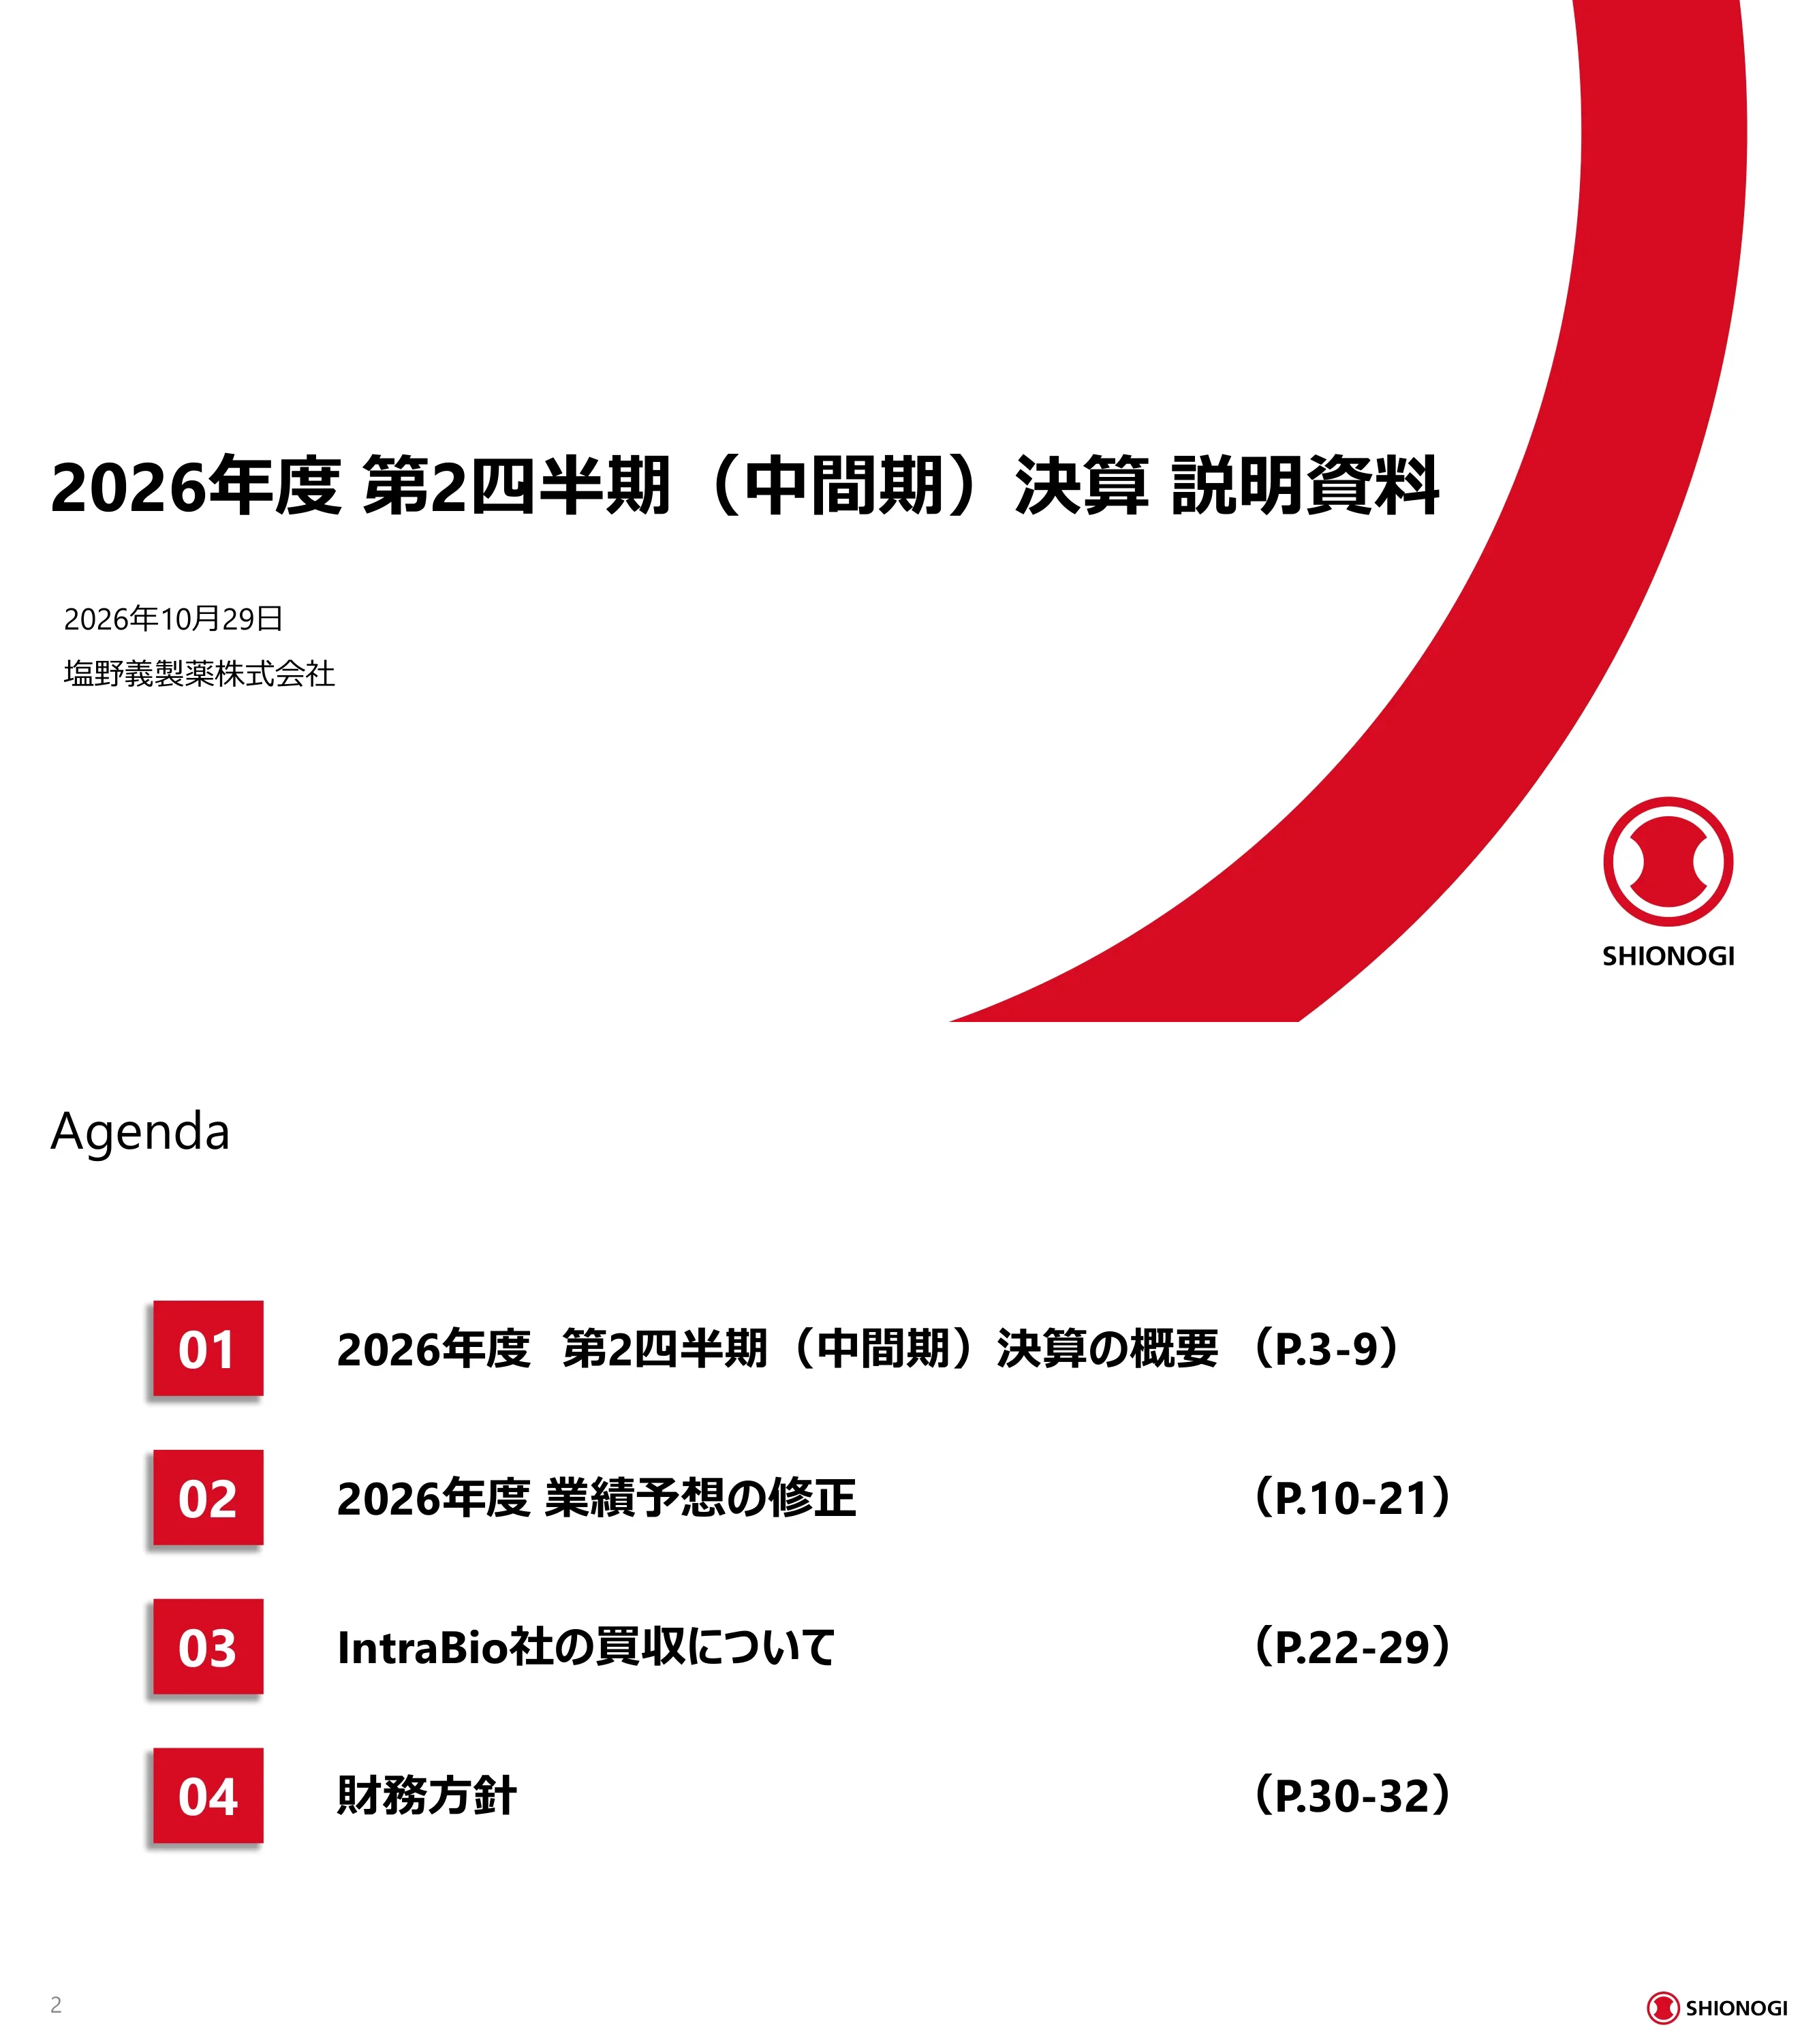
Title slide for Shionogi & Co., Ltd.'s FY2026 second-quarter (interim) results briefing (2026年度 第2四半期(中間期)決算 説明資料), dated October 29, 2026.
White background with a large left-aligned title, date and company name beneath it, and a sweeping red arc on the right ending in the circular Shionogi logo.
Four sections: 01 FY2026 Q2 (interim) results overview (p.3-9); 02 FY2026 forecast revision (p.10-21); 03 Acquisition of IntraBio (p.22-29); 04 Financial policy (p.30-32).
Vertical numbered list with red square number badges on the left, section titles in the middle and page ranges on the right.
Opens section 1, the overview of first-half FY2026 results.
Section divider reusing the cover's red arc and logo with a single left-aligned heading.
H1 revenue ¥3,504 (100 million yen) vs. plan ¥3,400 (103.1%) and +64.5% YoY (+¥1,374); operating profit ¥1,152 (120.0% of plan, +55.8%); profit before tax ¥1,073 (+9.9%); profit attributable to owners ¥1,195 (+44.0%); EBITDA ¥1,746 (+103.4%). Full-year plan at the time: revenue 7,000, operating profit 2,200. FY2025 figures restated after completing PPA for the JT Group pharma acquisition.
Headline message under a red rule, followed by a wide table: FY2026 full-year plan, H1 plan, H1 actual and achievement rate, FY2025 H1 actual, and YoY growth/change, with actual and YoY columns shaded pink.
Waterfall bridges from revenue to operating profit for Q1 (revenue 1,633, COGS 308, SG&A 602, R&D 318, other +107, OP 513) and Q2 (revenue 1,871, COGS 330, SG&A 605, R&D 356, other +61, OP 640). Q2 vs Q1: revenue +¥238 (100M yen, +14.5%), operating profit +¥127 (+24.8%), operating margin 31.4% → 34.2%.
Two side-by-side waterfall charts on the left two-thirds; a right-hand panel of three pink KPI cards with large red numbers.
Line-by-line P&L: COGS 638 (18.2% of revenue), gross profit 2,866, SG&A + R&D 1,881 (SG&A 1,206; R&D 674 at 19.2%), other income 167, finance income/costs -80 (vs +236 a year ago), PBT 1,073. Drivers: revenue up on royalties, domestic drugs and overseas; COGS up on Torii products and one-off edaravone inventory step-up; SG&A up on amortisation of acquired intangibles (JT pharma, edaravone) and US commercial costs; other income up on ViiV equity-method profit, partly offset by a loss on the planned sale of the China generics business; finance income down as ViiV dividends are now booked against the equity-method investment, plus FX losses; net profit lifted by recognition of deferred tax assets.
Dense P&L table on the left with ratio percentages in small red text above values; right column of grey-headed boxes explaining key YoY drivers per line.
Domestic prescription drugs 743 (+101.7%); overseas subsidiaries/exports 950 (+210.2%), including Shionogi Inc. (US) 740 with RADICAVA 509 and Fetroja 226, Shionogi B.V. (Europe) 131 with Fetcroja 104, China 27 (-8.8%); contract manufacturing 66; OTC 78; royalty income 1,654 (+27.9%), of which HIV franchise 1,485 and other 169 (+381.8%, from former JT pharma royalties). RADICAVA US/Canada sales were US$319.0M vs US$323.7M a year earlier under Tanabe Pharma (-1.5%).
Segment table with indented sub-lines on the left and three driver boxes on the right; dashed footnote box beneath for RADICAVA.
Acute respiratory infection drugs (Xocova for COVID-19; Xofluza and Rapiacta for influenza) 49, down 44.0%; Quviviq 40 (+843%); Zurzuvae 4 (42.4% of plan); Radicut 35; Symproic 35 (+19.4%); oxycodone products 23; Torii-related products 394 (+614.4%, or +17.3% on a like-for-like basis vs ¥33.6bn under JT); other 162. Domestic total 743 (+101.7%).
Product-level table with plan, actual, achievement and YoY columns; two dashed footnote boxes at the bottom.
Growth investments made in FY2025 are paying off: H1 revenue 2,130 → 3,504 (+64.5%), operating profit 740 → 1,152 (+55.8%), EBITDA 858 → 1,746 (+103.4%).
Three paired bar charts (FY2025 H1 vs FY2026 H1) with dotted red growth arrows; the revenue bars are stacked by business.
Opens section 2 on the revised full-year forecast.
Red-arc section divider with a single heading.
Revenue and all profit lines raised. Revenue: domestic Quviviq and Torii products up, acute respiratory drugs cut for the H1 shortfall (H2 unchanged), Zurzuvae slower; overseas Shionogi Inc./B.V. up, AQNEURSA revenue to be booked after the IntraBio deal closes, cefiderocol solid; HIV royalties from ViiV strong. Costs: COGS up for inventory step-up after closing; SG&A up for intangible amortisation and AQNEURSA launch, with cost management continued; R&D reprioritised across the integrated pipeline. Other income up on ViiV equity-method profit, offset by the China generics divestment loss.
Four grey-headed panels (Revenue, COGS, Expenses, Other income/expense) with bulleted text; red marks positive and blue negative factors.
FY2026 forecast revised: revenue 7,000 → 7,200 (+200), operating profit 2,200 → 2,300 (+100), PBT 2,200 → 2,205, profit attributable to owners 2,100 → 2,125, EBITDA 3,150 → 3,360 (+210). Versus FY2025 actual: revenue +44.1% (4,997), operating profit +35.1% (1,703), net profit +1.6% (2,092), EBITDA +79.0%. Revenue, operating profit and net profit all at record levels.
Table comparing original vs revised forecast and FY2025 actual, with red-highlighted revised columns.
Revised full year: COGS 1,250 (17.4%), gross profit 5,950, SG&A 2,650 (+250), R&D 1,400 (-150), other income 400, operating profit 2,300 (31.9% margin), finance costs -95. Implied H2: revenue 3,696, operating profit 1,148 (-92 vs original H2), net profit 930.
Wide P&L grid with full-year and H2 blocks (original, revised, change) plus FY2025 actual and YoY columns; ratios in red.
Domestic 1,786 → 1,720 (-67); overseas 1,752 → 1,913 (+160), of which Shionogi Inc. 1,505 (RADICAVA 1,003), Shionogi B.V. 253, China 52; contract manufacturing 133; OTC 173; royalties 3,106 → 3,235 (+129), HIV franchise 2,890. Total 7,200, +44.1% vs FY2025.
Segment forecast table with original/revised/change for full year and H2, FY2025 actual and YoY.
Acute respiratory infection drugs cut 416 → 302 (-113); Quviviq raised 67 → 89; Zurzuvae cut 40 → 10; Radicut 70 unchanged; Symproic 70; oxycodone 46; Torii products 792 (+16); other 340. Domestic total 1,720, +39.3% vs FY2025.
Product-level forecast table mirroring page 14 with a footnote box listing the respiratory drugs.
Strong growth in QOL (quality-of-life) disease areas expands the domestic earnings base to a forecast ¥172.0bn. Infectious diseases: continued preparation for respiratory seasons with Xocova, Xofluza and Rapiacta. QOL: Quviviq (insomnia) adoption rising in psychiatry and internal medicine; psychiatric presence extended to Zurzuvae (depression); co-promotion of Torii's Corectim and Vtama; Radicut ALS early-diagnosis awareness.
Stacked bar chart (FY2024, FY2025, FY2026 forecast) on the left; right side panels for infectious and QOL franchises with product boxes and process icons.
Overseas forecast ¥191.3bn, driven by infectious disease and a RADICAVA-anchored rare-disease franchise. Rare disease: RADICAVA early-diagnosis and persistence support; AQNEURSA (after closing) for NPC and A-T. Infectious disease: cefiderocol growth in the US/EU and new indications/regions; ensitrelvir US expansion and EU approval.
Stacked bar chart (infectious, rare disease, other) on the left; blue rare-disease and green infectious-disease panels on the right.
2011: entered China by acquiring C&O Pharmaceutical (network to ~300,000 clinics, hospitals and pharmacies). 2020: Ping An Shionogi JV formed with Ping An Insurance (51/49), cefiderocol filing and early access, AI drug discovery. 2025 onward: acquired Ping An's 49% stakes, making the Shanghai and Hong Kong JVs wholly owned (Shionogi China) and shifting to a new-drug-centred model.
Three-column timeline with grey headers, bullets, and a row of chevron arrows progressing from light pink to red.
Due to price pressure from policy changes and intensifying competition, China revenue fell about 50% over three years; Shionogi will sell the generics subsidiaries (a Shenzhen sales company and a Nanjing development/manufacturing company), recording a loss of about ¥7.2 billion (72億円) after reassessing asset values.
Left: bullet points and a declining bar chart FY2020-FY2025 with a red arrow and '~50% down in 3 years' badge. Right: org chart of the two subsidiaries to be divested inside a dashed box.
Aim to build a new-drug business in China that contributes to global growth. Two pillars: (1) continued new-drug launches — approved cefiderocol and naldemedine (sales agreement with Chia Tai Tianqing), pipeline olorofim (invasive aspergillosis) whose Phase 3 met its primary endpoint; (2) strengthening the business base with stable earnings and product-specific approaches.
Left column with two numbered pillars and product boxes; right side a blue gradient background with a large red upward arrow and slogan text.
ViiV's long-acting injectable (LAI) sales grew +£144M (+30%) YoY at constant exchange rates. CY2026 Q3: Cabenuva (cabotegravir + rilpivirine, treatment) £478M, +35%; Apretude (cabotegravir, PrEP) £143M, +21%.
Quarterly stacked bar chart CY2021-CY2026 Q3 in £M on the left; two rounded KPI cards with product logos on the right.
Opens section 3. Closing is subject to antitrust waiting periods and regulatory clearances; expected closing November-December 2026.
Red-arc divider with heading and a short legal note beneath.
Accelerate rare-disease expansion by acquiring a promising commercial asset and expertise: (1) further expand the overseas business with a marketed product, leveraging the US RADICAVA infrastructure; (2) strengthen rare-disease development via IntraBio's network with patient groups, KOLs and researchers.
Two equal white cards with red circular icons, joined by a large grey multiplication sign.
IntraBio Inc. (private), founded November 2015, headquartered in Texas, ~60 employees, revenue about US$68 million (FY ended December 2025, AQNEURSA sales). Lead product AQNEURSA (levacetylleucine), an oral small molecule improving lysosomal function and energy metabolism, approved for neurological manifestations of NPC (US/EU) and ataxia in A-T (US). Strong partnerships with NPC and A-T patient groups.
Company-profile table on the left; product card with AQNEURSA logo and indications on the upper right; red partnership box below.
Rare inherited lysosomal disorder caused by NPC1/NPC2 mutations that lead to lipid accumulation; symptoms include ataxia, cognitive decline, eye-movement disorder and hepatosplenomegaly. Incidence about 1 in 100,000; about 400 diagnosed patients in the US and 500 in the EU5. Existing therapies mainly slow progression.
Left: lysosome illustration with membrane-transport diagram and four symptom tiles. Right: three stacked KPI cards (incidence, diagnosed patients, treatment landscape).
Serious rare genetic disease from ATM mutations impairing DNA repair, affecting the nervous, immune and respiratory systems; symptoms include ataxia, immunodeficiency, recurrent infections, lung disease, higher cancer risk and telangiectasia. Incidence about 1 in 40,000-100,000; about 1,500 diagnosed patients in the US and 800 in the EU5. AQNEURSA is the first approved therapy.
Same template as page 25: DNA/cell illustration with six symptom tiles on the left, three KPI cards on the right.
Global Phase 3 trials IB1001-301 (NPC, NCT05163288) and IB1001-303 (A-T, NCT06673056) in children and adults, 12 weeks, primary endpoint improvement in SARA score. NPC: 1.97 vs 0.60 placebo (N=59/58, p<0.001). A-T: 1.92 vs 0.14 placebo (N=69/72, p<0.001). No drug-related serious adverse events.
Top band with trial design; lower-left SARA explainer with daily-function bubbles; lower-right efficacy and safety text plus two bar charts.
NPC: Phase 3 started June 2022; US filing Jan 2024, approval and launch Sept 2024; EU filing June 2024, approval Jan 2026. A-T: Phase 3 started March 2025; US filing March 2026, approval and label expansion Sept 2026; EU filing June 2026.
Two horizontal swim-lane timelines (blue for NPC, red for A-T) with milestones for Phase 3 start, filing, approval and launch.
US: combine IntraBio's network (patient groups, specialist centres, KOLs) with RADICAVA's patient-support infrastructure to accelerate AQNEURSA uptake. Europe: use the newly approved rare-disease drug to build a rare-disease organisation (talent, patient-group ties) and establish presence.
Two columns (US in pink, Europe in red) with icon rows, downward chevrons and outcome boxes with red text.
Opens section 4 on financial policy.
Red-arc divider with heading.
Cash available ¥940.0bn (9,400億円): operating cash flow before R&D ¥480.0bn plus carried-over cash ~¥460.0bn. Planned uses: R&D ¥155.0bn, business/capital investment ¥720.0bn (with flexibility for higher dividends, buybacks or debt repayment) and dividends ¥65.0bn. H1 progress: R&D ~¥68.0bn, investments ~¥335.0bn (assuming the US$2.0bn IntraBio share purchase), dividends ¥32.3bn. Policies: investment judged against cost of capital; return quickly to a net cash position; DOE target of 4% or more and opportunistic buybacks.
Cash-in vs cash-out block diagram on the left, H1 progress column in the centre, policy panels on the right.
Record dividend increase: interim raised by ¥2 and year-end by ¥8 versus prior guidance, for an annual dividend of ¥86 per share (interim ¥40, year-end ¥46), up ¥15 from ¥71 in FY2025 — the 15th consecutive increase. DOE forecast 4.2%. History table shows buybacks, cancellations, ROE and DOE from FY2012 (split-adjusted for the October 2024 3-for-1 stock split).
Bullet points top-left; bar chart of dividends per share FY2012-FY2026 with the FY2026 bar in pink/red; data table beneath with buybacks, ROE and DOE.
Opens the appendix.
Red-arc divider with 'Appendix' heading.
Average-rate assumptions: USD ¥153.0 (May 12) → ¥159.0 (Oct 29), actual Apr-Sep ¥159.49; GBP ¥205.0 → ¥213.4, actual ¥214.16; EUR ¥184.0 → ¥184.4, actual ¥184.44.
Single centred table with grey header and red-highlighted actual column.
Q1 results were restated to reflect completed edaravone PPA and provisional ViiV PPA: amortisation of product intangibles reduced by 9 (158 → 150), other income cut by 165 (272 → 107), so operating profit falls from 669 to 513, PBT from 737 to 581 and net profit from 977 to 818. Revenue unchanged at 1,633.
Reconciliation table with pre-restatement, change and restated columns plus a description column.
Q1 (Apr-Jun): operating profit 513 + finance income 68 + tax benefit 237 (deferred tax asset recognition) = net profit 818 (+306). Q2 (Jul-Sep): operating profit 640 - finance costs 148 - income tax 114 = net profit 377 (-262), with FX weighing on finance results.
Two waterfall charts side by side, red increments for Q1 and blue decrements for Q2, with central callout badges.
Dermatology 116 (+9.5%): Corectim 53 (+15.2%), Vtama 12 (-21.4%); allergen and other 278 (+20.8%). Torii-related total 394, +17.3% vs 336 under JT Group in the prior-year period.
Compact product table with plan, actual, achievement and YoY columns.
Full-year Torii-related revenue raised 776 → 792: dermatology 225 (Corectim raised to 105, Vtama cut to 28), allergen and other 567 (+21). +15.4% vs FY2025 pro forma 686.
Forecast table with full-year and H2 original/revised blocks plus FY2025 and YoY.
2025 sales: Cabenuva (CAB+RPV LAI, IM every 2 months, treatment) £1,402M; Apretude (CAB LAI, PrEP) £439M; Dovato (DTG+3TC oral) £2,678M; Juluca (DTG+RPV oral) £656M; Tivicay (DTG) £1,323M; Triumeq (DTG+ABC+3TC) £991M.
Colour-banded product table (blue LAIs, red two-drug orals, yellow single/three-drug) with formulation, compound, route, frequency, indication and sales columns.
No competing integrase-inhibitor LAI expected to be approved before 2030. Shionogi/ViiV combined proof that two-drug oral regimens work (Dovato, Juluca) with a compound that sustains blood levels. Cabotegravir is the world's only approved integrase-inhibitor LAI: dolutegravir-like potency and resistance barrier, dosing every two months (SOLAR study), and patent protection to 2040 via additional patents.
Left grey panel with two overlapping circles and a multiplication sign; arrow to right panel with three icon-led strength boxes.
Extending Cabenuva's dosing from six to three times a year: reliability from Cabenuva clinical experience; treatment days cut from 365 (daily oral) to 3; about 2x clinic capacity; capture switching from orals and competitors. Phase 3 CUATRO study started June 2026; approval targeted CY2028; aim to extend protection to 2047 (cabotegravir compound patent expires 2031).
Regimen card on the left feeding four numbered benefit tiles; schedule and patent-strategy boxes below.
Two-drug regimen of S-365598 (VH184, third-generation integrase inhibitor with a distinct resistance profile) and VH499 (capsid inhibitor with low drug-drug interaction risk), aiming for six-month dosing for the broadest patient population. VH184 INNOVATE Phase 2b ongoing; VH499 Phase 2b CINERGY study to start CY2026 H2; Phase 3 start CY2028. Compound patents expire in the 2040s, with protection targeted to at least 2047.
Same template as page 41: regimen card, four numbered tiles, schedule and patent boxes.
Single-agent cabotegravir for PrEP every four months: reliability proven by Apretude (over 99% efficacy and 4+ years of real-world evidence), one IM injection per visit, schedule aligned with routine STI testing, favourable injection-site reaction and DDI profile. EXTEND 4M pivotal data in CY2026 H2; approval targeted CY2027; protection sought to 2045.
Same four-tile pipeline template with schedule and patent boxes.
Standard disclaimer: the deck contains forward-looking statements subject to risks including economic conditions, FX, clinical and regulatory outcomes, healthcare reforms and manufacturing; product information is not advertising or medical advice; the deck is not a solicitation to invest.
Full-width bulleted text slide.
คำถามทั่วไปเกี่ยวกับสไลด์นี้และเนื้อหาการนำเสนอพื้นฐาน
It covers Shionogi's results for April-September 2026 (the first half of FY2026, which runs April 2026 to March 2027), the upward revision of full-year guidance, the planned acquisition of IntraBio and its rare-disease drug AQNEURSA, the China restructuring, the ViiV long-acting HIV pipeline, and cash allocation and dividend policy, across 44 slides.
Yes. The original is a Japanese-language results briefing deck (決算説明資料, titled 2026年度 第2四半期(中間期)決算説明資料) released on October 29, 2026 via TDnet, the Tokyo Stock Exchange's timely disclosure system, under securities code 4507. The page-by-page summary on this page is written in English, with amounts kept in the company's ¥100 million (億円) units.
Revenue was ¥350.4 billion (+64.5% YoY), operating profit ¥115.2 billion (+55.8%), profit attributable to owners ¥119.5 billion (+44.0%) and EBITDA ¥174.6 billion (+103.4%). Royalty income, mostly from ViiV's HIV franchise, was ¥165.4 billion.
Full-year revenue was raised from ¥700.0 billion to ¥720.0 billion, operating profit from ¥220.0 billion to ¥230.0 billion and EBITDA from ¥315.0 billion to ¥336.0 billion. The annual dividend forecast rose to ¥86 per share, up ¥15 and the 15th consecutive increase.
IntraBio markets AQNEURSA (levacetylleucine) for Niemann-Pick disease type C and ataxia-telangiectasia. Shionogi plans to use its US RADICAVA infrastructure to grow AQNEURSA and to build a rare-disease presence in Europe. The deal assumes a share purchase of about US$2.0 billion and is expected to close in November-December 2026.
Yes. The page offers the original PDF and an editable PPTX converted from it. Because the source is Japanese, the slide text in both files is in Japanese; the conversion may need minor layout touch-ups.
Investors and analysts covering Japanese pharma or the HIV long-acting injectable market, BD teams studying rare-disease acquisitions, and IR professionals who want a well-structured example of a half-year results deck with a forecast revision and an M&A section.
Original Japanese-language PDF filed on TDnet on October 29, 2026.

Create Your Own Slides
Turn your ideas into professional presentations in seconds with 2slides AI.
อ้างอิงการออกแบบมืออาชีพ เลือกสไตล์ของคุณ และสร้างสไลด์ด้วยการแสดงผลข้อความที่สมบูรณ์แบบ ขับเคลื่อนโดย Nano Banana—เริ่มสร้างการนำเสนอของคุณตอนนี้
เอเจนต์ AI ของคุณสำหรับสไลด์ ประหยัดเวลา เปล่งประกายเร็วขึ้นด้วยการสร้างงานนำเสนออัจฉริยะ


© 2026 2slides สงวนลิขสิทธิ์