
อยู่ในคอลเลกชัน ตัวอย่างงานนำเสนอสำหรับนักลงทุน · ตัวอย่างพรีเซนเทชันนักลงทุนอินเดีย
Reliance Industries Limited (RIL) Q2 FY27 financial results and earnings presentation, filed with BSE and NSE (India's stock exchanges) on 30 October 2026 for the quarter ended 30 September 2026. The 68-page deck walks through consolidated performance and each business segment: Jio Platforms (digital services), Reliance Retail, FMCG (Reliance Consumer Products), JioStar media, Oil to Chemicals (O2C) and Oil and Gas. Headline numbers include record consolidated EBITDA of ₹62,409 crore (+23.9% YoY), PAT of ₹29,550 crore (+33.8%), revenue of ₹362,268 crore (+27.8%), O2C EBITDA up 67.9%, and the Jio Platforms IPO, India's largest at ₹30,188 crore.
ใช้หน้าปกของงานนำเสนอนี้เป็นต้นแบบสไตล์สำหรับสไลด์ที่สร้างจากเนื้อหาของคุณเอง หรือเลือกหน้าใดก็ได้ด้านล่างเพื่อใช้เลย์เอาต์ของหน้านั้นเป็นต้นแบบ
การนำทางด่วน
แท็ก
แชร์สไลด์
Reliance Industries Limited (RIL) Q2 FY27 financial results and earnings presentation, filed with BSE and NSE (India's stock exchanges) on 30 October 2026 for the quarter ended 30 September 2026. The 68-page deck walks through consolidated performance and each business segment: Jio Platforms (digital services), Reliance Retail, FMCG (Reliance Consumer Products), JioStar media, Oil to Chemicals (O2C) and Oil and Gas. Headline numbers include record consolidated EBITDA of ₹62,409 crore (+23.9% YoY), PAT of ₹29,550 crore (+33.8%), revenue of ₹362,268 crore (+27.8%), O2C EBITDA up 67.9%, and the Jio Platforms IPO, India's largest at ₹30,188 crore.
มุมมองรายละเอียดของแต่ละหน้าสไลด์ รวมถึงlayout เนื้อหาหลักและองค์ประกอบภาพ
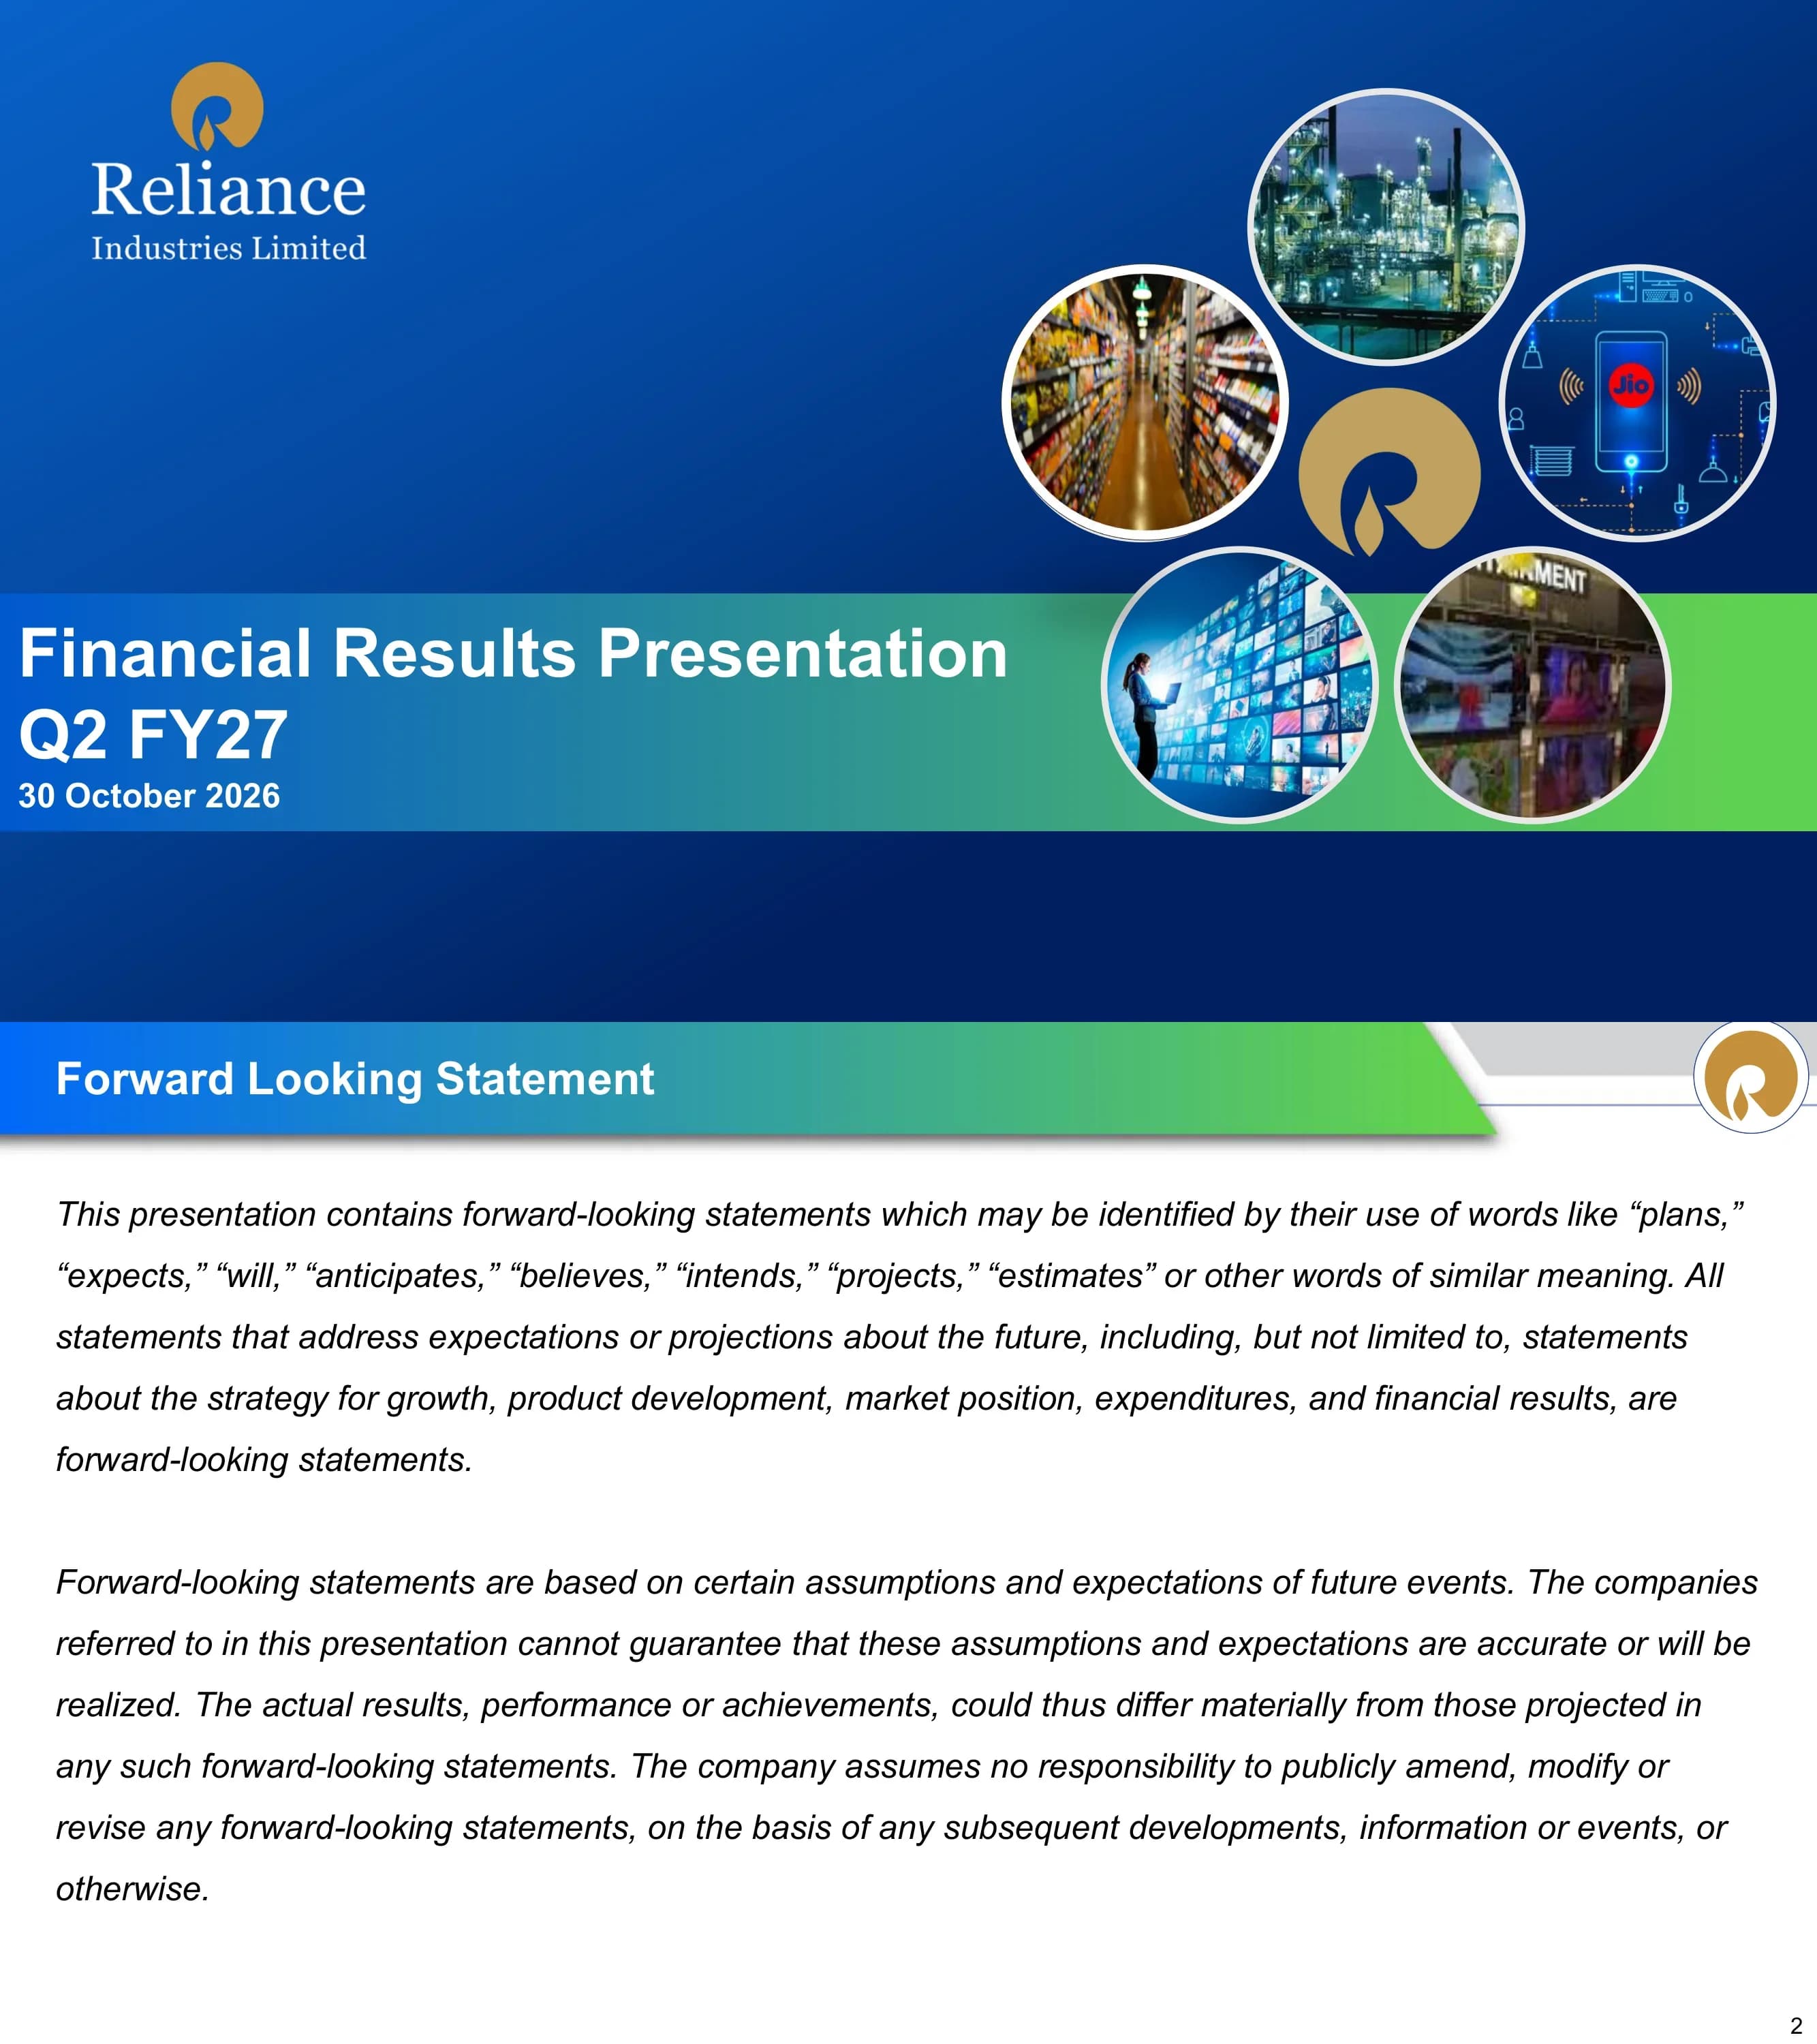
Cover slide of Reliance Industries Limited's Financial Results Presentation for Q2 FY27, dated 30 October 2026.
Full-bleed royal-blue background with a blue-to-green gradient band; circular photos arranged around a central gold RIL logo, with title text on the band
Standard forward-looking statement disclaimer set out in two paragraphs of italic text.
Text-only slide with two italic disclaimer paragraphs under the standard title ribbon
Seven lettered sections with page numbers: A Consolidated Financial Performance (p4), B Jio Platforms (p12), C Retail (p19), D FMCG (p34), E Media (p39), F Oil to Chemicals (p45) and G Oil and Gas (p63).
Table with lettered rows on the left and page numbers on the right
Section divider for part A, which covers consolidated key highlights, results, segment performance and balance sheet (pages 5 to 11).
Divider slide with a large letter A on a paper-tab graphic and the section name
Strongest quarterly performance ever: highest-ever EBITDA of ₹62,409 crore (+23.9% YoY) and record quarterly PAT of ₹29,550 crore (+33.8% YoY), with H1 FY27 PAT past ₹50,000 crore on a recurring basis. O2C EBITDA rose about 68% on all-time-high fuel cracks and feedstock advantage, and the JPL IPO made Jio India's 2nd most valuable company with market cap over ₹13,00,000 crore ($137 bn).
Two-column bullet layout with a blue takeaway banner at the bottom reading 'Robust, diversified portfolio delivered consistent growth amid an uncertain global environment'
Geopolitical conflicts tightened energy markets, yet O2C delivered record performance despite elevated opex, crude premiums and a surge in freight and insurance. Crude sourcing shifted to the Americas and Mediterranean, the ethane advantage was the widest, and H1 FY27 is tracking annualized O2C EBITDA of over ₹80,000 crore; New Energy earnings contribution starts from FY28.
Bullet-led text slide organized into themes with a takeaway banner at the bottom
Jio has 542.4 Mn subscribers, 300 Mn 5G subscribers and 30 Mn fixed broadband customers (FWA more than 50% of the base). Monetization levers for sustainable high-teen growth are the connectivity base, digital services layering and tech IP for international markets.
Headline KPI callouts on the left with a bulleted list of monetization levers on the right and a takeaway banner
Retail strategy is unchanged from Q1 FY27: disciplined online build, store cash flows funding digital commerce, and FY28-FY29 conversion of scale into value. Grocery B2C online revenue grew 42% YoY, online share rose 270 bps in grocery B2C and 100 bps in apparel and footwear, RCPL accelerated capacity and distribution, and Media has the widest reach across digital and linear.
Bulleted strategy slide with proof-point figures and a takeaway banner at the bottom
Revenue ₹362,268 crore (+27.8% YoY, $37.8 bn) and EBITDA ₹62,409 crore (+23.9%, $6.5 bn); PBT ₹38,613 crore (+32.6%) and PAT ₹29,550 crore (+33.8%, $3.1 bn). Revenue growth was led by O2C (+44%) and Digital (+11%); RIL standalone PAT rose 68.2% to ₹15,354 crore, JPL PAT was ₹8,387 crore (+13.7%) and RRVL PAT was ₹2,611 crore (-24.3%).
Financial table with Q2 FY26, Q2 FY27, US$ bn and YoY columns, the current-quarter column highlighted in beige, with commentary bullets and a banner
Segment EBITDA (Q2 FY26 to Q2 FY27, ₹ crore): O2C 15,008 to 25,203 (+67.9%), Oil & Gas 5,002 to 4,901 (-2.0%), Digital Services 18,882 to 22,223 (+17.7%), Retail 6,817 to 6,120 (-10.2%), Others 4,658 to 3,962 (-14.9%); total 50,367 to 62,409 (+23.9%). Retail was hit by a festive demand shift and online investment, summed up in the banner 'Soft quarter for retail'.
Segment EBITDA table with commentary bullets per segment and a banner at the bottom
Net debt fell from ₹122,914 crore (Jun-26) to ₹117,140 crore ($12.2 bn, Sep-26); annualized EBITDA rose from 216,268 to 249,636 ($26.0 bn), taking net debt to EBITDA from 0.57x to 0.47x. Capex was ₹38,153 crore across new energy, retail densification for hyperlocal delivery and O2C expansion; ratings are A- and Baa1.
Compact table of balance sheet metrics with capex and credit rating callouts and a takeaway banner
Section divider for part B, Jio Platforms, covering the business update, KPIs and financials on pages 13 to 18.
Divider slide with a paper-tab letter B, section title and a Jio logo badge
India's largest IPO at ₹30,188 crore (US$3.2bn); Jio listed at a 26.7% premium with market cap of ₹13.1 lakh crore, the 2nd largest Indian company by mcap on Day 1 behind only RIL. It has 542.4 Mn subscribers (36 Mn net adds in 12 months) and 300 Mn on 5G, FBB of 30 Mn with 7.5 Mn net adds, and AirFiber is the world's largest FWA with about 15.1 Mn connections and over 78% FWA share.
Dense bullet slide grouped by theme (IPO, mobility, home broadband, enterprise) with Jio logo badge and takeaway banner
Eight KPI cards: customers 542.4 Mn (+36 Mn), 5G 300 Mn (+66 Mn), broadband homes 30 Mn (+7.3 Mn), 44.2 GB/month data (about 14% YoY), ARPU ₹218.8/month (+3.5%), revenue from operations ₹40,475 crore (+11.4%), EBITDA ₹21,879 crore (+16.6%, 54.1% margin), and H1 EBITDA less capex ₹32,130 crore (+98%). The ARPU card has a typo on the slide ('Cconnectivity').
Grid of eight KPI cards, two rows of four, each with a large figure and YoY delta
Two bar charts over five quarters (Sep-25 to Sep-26). Operating revenue went 31,857 / 32,751 / 33,381 / 34,212 / 35,307 (₹ crore, +10.8% YoY); EBITDA went 17,874 / 18,408 / 18,771 / 19,590 / 20,505 (+14.7%), with margin rising from 56.1% to 58.1% (+200 bps).
Two side-by-side bar charts with data labels, one for revenue and one for EBITDA with a margin line
Table of Q2 FY27, Q1 FY27, Q2 FY26, H1 FY27 and H1 FY26: customers 542.4 / 533.3 / 506.4 Mn, ARPU 218.8 / 215.6 / 211.4, data traffic 71.3 bn GB in Q2, JPL consolidated revenue 40,475 / 39,173 / 36,332, EBITDA margin 54.1 / 53.3 / 51.6%, net leverage 0.10 vs 0.55 a year ago, and ROACE 11.0%.
Wide five-column KPI table with the current quarter highlighted
JPL consolidated (₹ crore, Q2 FY26 to Q2 FY27): gross revenue 42,652 to 47,485 (+11.3%), operating revenue 36,332 to 40,475 (+11.4%), EBITDA 18,757 to 21,879 (+16.6%), margin 51.6% to 54.1% (+250 bps), EBIT 12,082 to 14,268 (+18.1%), finance costs 2,145 to 3,009 (+40.3%) and PAT 7,375 to 8,387 (+13.7%).
Financial table with green up-arrows next to growth figures and a banner reading 'Scale up of digital services complementing connectivity platform growth'
Six strengths: a full-stack tech company with proprietary IP, nation-scale service to consumers, homes and businesses, unmatched distribution, a culture of innovation, multiple growth engines in India and globally, and proven scale, growth and profitability with a strong balance sheet.
Six numbered pill-shaped rows stacked vertically
Section divider for part C, Retail, which runs from page 20 to page 33.
Divider slide with a paper-tab letter C and the section title
Gross revenue ₹91,716 crore (+6.4% YoY, adjusted for the Consumer Brands demerger) without a festive season; more than 400 million registered customers (+10%) and transactions +7%; 303 stores opened for a total of 19,947 stores in 7,000+ towns. EBITDA was ₹6,228 crore at 7.8% margin before a one-time ₹108 crore charge, down 120 bps; Navratri (11 Oct) and Diwali (8 Nov) fell entirely in Q3, and grocery B2C online revenue grew 42%.
Bullet-based highlights slide with Reliance Retail logo badge and a takeaway banner
Four trends: inflation at a two-year high (CPI 5.5%, food inflation 7.7% in September), the rupee near its low making imported electronics and fashion costlier, a monsoon deficit weighing on food prices and rural demand, and a festive calendar that falls in Q3. The takeaway: consumption held up and the festive season shifted into Q3.
Four rounded cards in a row with a banner below
Store footprint across India with six KPI tiles: 400 Mn+ registered customers (+10%), 19,947 stores (303 opened in Q2), retail space 77.5 Mn sq ft, warehousing 24.5 Mn sq ft, transactions +7% and 4 Mn+ business customers. Net store count is 222 lower than Q1 as underperformers were exited.
India dot-map on one side with six KPI tiles arranged around or beside it
Gross revenue ₹91,716 crore (+6.4% YoY) and net revenue ₹80,220 crore (+5.8%); EBITDA before one-time items ₹6,228 crore (-8.6%, margin 7.8%, -120 bps), a one-time ₹108 crore 7-Eleven impairment, and EBITDA after ₹6,120 crore (-10.2%). Depreciation was ₹1,820 crore (+18.1%), finance cost ₹905 crore (+53.9%), PBT ₹3,395 crore (-27.6%) and PAT ₹2,611 crore (-24.3%); Q2 FY26 is adjusted for the Consumer Brands demerger.
Detailed P&L table with Q2 FY27, Q1 FY27, QoQ, Q2 FY26 and YoY columns and a footnote on the demerger adjustment
FY27 is about building online scale (growing JioMart and omni-channel, availability, speed and reliability, market-by-market unit economics, dark store expansion). FY28-FY29 converts scale into value through repeat purchase, basket and lifetime value, own brands and marketplace income, productivity and fulfilment density, and compounding revenue, margin and cash.
Two-column comparison with a blue header bar for FY27 and a dark-green header bar for FY28-FY29
Four FY27 priorities against what moved: JioMart and omni-channel (grocery B2C online +42%, online share +270 bps in grocery and +100 bps in apparel and footwear, 5,000+ stores in 1,000+ cities), availability and speed (97% of resQ services within 48 hours, 250+ new fashion options weekly), unit economics (units per order +24%), and dark store expansion funded by store profits.
Four-row table pairing each FY27 priority with the evidence of progress
Four KPI families used to judge online growth: Customer (active customers, repeat rate, order frequency, NPS/trust), Commercial (net revenue, basket size, own-brand mix, delivered gross margin), Operations (availability, on-time fulfilment, cost per order, returns/cancellations) and Financial (contribution margin, working capital, cash-to-cash days, EBITDA).
Four rounded cards each listing four KPIs
Divider introducing the basket-level pages that follow, stating the same customer, supply chain and data platform across every format.
Full-bleed blue-green collage with logo, fashion model, store fronts, JioMart phone and AJIO app screenshot, with overlay text
Grocery like-for-like revenue grew 3% and digital share of grocery B2C revenue rose 270 bps, with input-cost inflation not fully passed on. Regional festivals and the 'Har Ghar Annapurna' campaign supported staples, dairy, frozen and bakery; margin recovery depends on space productivity, assortment and vendor base.
Text-led bullet slide with an execution priority box and campaign imagery
Grocery B2C online revenue grew 42% and units per order rose 24%; 5,000+ stores are on the JioMart network across 1,000+ cities, with consumer electronics big-box range offered with two-hour delivery. Marketplace and seller services are being monetized, dark store cohorts are maturing and smaller cities are in focus.
Bullet list with key figures beside the 'Bappa Ka Address' festive campaign image
B2B revenue grew 10% YoY with 4 Mn+ business customers across kiranas, HoReCa and institutions. Growth came from beverages, dairy, frozen and bakery and staples, supported by the 'METRO Ka Vaada, Fayda Sabse Zyada' and 'Mehangai Se Azaadi, Bachat Ki Azaadi, Vyapar Ki Tarakki' campaigns.
Bullet text with a B2B store photograph
Like-for-like revenue grew 8% and distribution gross revenue 20% (mobiles, laptops); 97% of resQ services were delivered within 48 hours. Reliance is India's largest retailer of premium products including Apple and Samsung phones, at lower margins as a strategic investment, with a Q3 priority of winning the festive season and attaching service and finance.
Bullet text with a Reliance Digital mobile exchange advert (₹10,000 cashback on Apple phones)
Like-for-like revenue grew 3%, digital share in apparel and footwear rose 100 bps and own-brand contribution rose 710 bps. AJIO's catalogue reached 3.3 Mn+ (+23%) with 250+ new options weekly, premium and luxury has 1,000+ exclusive brand outlets, and AJIO Luxe has 1,040 brands (22 new); Fabletics launched, with an exclusive SKIMS partnership and Hugo and Madden NYC sub-brands.
Bullet slide with brand highlights and a festive trends campaign photograph
Revenue grew in a quarter with no major festivals and every basket grew. Online scale is building as planned, margins reflect digital commerce investment and absorbed inflation (funded by store profits), the store network was reshaped (303 opened, underperformers exited), and Q2 and Q3 should be read together because the festive season fell entirely in Q3.
Plain bullet slide with five takeaways
Section divider for part D, FMCG, which covers Reliance Consumer Products (RCPL) on pages 35 to 38.
Divider slide with paper-tab letter D and section title
Q2 gross revenue of ₹8,266 crore (1.6x vs Q2 FY26) and H1 FY27 gross revenue of ₹16,900 crore (1.8x), about 80% of last year's total sales in six months. Daily Essentials (Independence) grew 1.7x with about ₹7,000 crore of H1 sales, Beverages (Campa) had ₹5,250+ crore of H1 sales, and RCPL entered dairy with ice creams as India's first accessible premium dairy brand.
Headline KPIs with category commentary and rows of product thumbnails
Beverages grew 2.1x YoY, ranking #3 NARTD player in India with double-digit share in several states. Daily Essentials (Independence and Good Life) is pan-India with dry fruits and edible oil as drivers and Udhaiyam and Independence leading in pulses; Other FMCG is led by Glimmer in home and personal care, with biscuits a focus category.
Three columns, one per category, each with bullets and product photos
Campa launched in Coles and Woolworths in Australia backed by local production, in Kenya, Ghana and Nigeria in Africa, and in the UAE, Oman and Malaysia across GCC and SE Asia. Six integrated food and beverage greenfield projects were initiated and multiple new high-speed beverage lines commissioned.
Regional bullet blocks alongside photographs of stores and bottling plants
Three activation types: new category entry (ice cream with real dairy cream in cone, stick, tub, cup and brick formats), festive activations (Campa 'Tayyari Big, Tyohaar Bada Big', Navratri, Ganesh Chaturthi) and on-ground presence (Campa as Associate Partner of BCCI, stadium boards).
Three columns with campaign imagery under each heading
Section divider for part E, JioStar (listed as Media in the table of contents), covering digital, sports, entertainment and financials on pages 40 to 44.
Divider slide with paper-tab letter E and section title
JioHotstar had about 440 Mn MAUs in Q2 FY27, up 10% YoY (400 vs 440 in the bar chart). Conversational Discovery active users grew 75% QoQ, food ordering is integrated into the entertainment experience, and JioHotstar launched in Singapore, the UK and Canada.
Small MAU bar chart with bullets and app screenshots (Koffee With Karan, food order)
England-India (5 T20s + 3 ODIs) saw digital viewership +12% and CTV +11%; Premier League 2026/27 digital +25% and CTV +13% (data to Game Week 8, 25/10/26); India-West Indies (3 ODIs + 5 T20s) digital +12% and CTV +13%. The banner notes H1 momentum carrying into H2 with stronger monetisation.
Three panels, one per series, each with match posters and viewership deltas, plus a banner
Bigg Boss franchise watch time +12% on JHS, Khatron Ke Khiladi 15 its best season with 2x growth, Pritam and Pedro the highest-performing streaming original on JHS, and Drishyam 3 reached ₹500 crore global NBO with a top-three Hindi opening weekend.
Four poster cards grouped by genre: Unscripted, Originals, Theatrical
Digital (conversational discovery, food delivery integration complete, JioHotstar launched in Singapore, UK and Canada, 30% subscriber increase post relaunch), Sports (biggest bilateral overseas series on JioHotstar, India-WI record monetization) and Entertainment (digital watch time +15% YoY, strong CTV ad revenue growth, six Bigg Boss editions with +12% digital watch time).
Three blue-to-pink gradient label blocks with supporting bullets
Operating revenue ₹6,806 crore (+10% YoY) versus ₹6,179 crore; EBITDA ₹1,502 crore (-14%) versus ₹1,738 crore, with margin 22.1% (-600 bps); PBT ₹1,139 crore (-14%). Subscription revenue was strong, linear TV advertising is in transition and sports advertising was strong on more cricket.
Financial table with Q2 FY26, Q2 FY27, YoY and Q1 FY27 columns and commentary bullets
Section divider for part F, Oil to Chemicals, the longest business section, running pages 46 to 62 and covering operating context, results, refining, petchem and downstream chemicals.
Divider slide with paper-tab letter F and section title
Product balances were unprecedentedly tight after damage to refining infrastructure in the Middle East and Russia and export bans; Strait of Hormuz shipments are recovering, SPR and commercial inventories are at multi-year lows, and Asian chemical operating rates were 71%. Petchem margins (PE/PP/PET) rose versus pre-conflict, Brent ranged about US$70-130/bbl with a physical premium, and opex was elevated.
Bulleted market context slide grouped into supply, inventory and chemicals themes
Revenue ₹231,601 crore (+44.2%) and EBITDA ₹25,203 crore (+67.9%) with margin 10.9% (+160 bps); EBITDA rose 48.2% QoQ. Fuel cracks were up 3 to 3.7x and polyester chain margin up 33%; headwinds were the SAED levy on MS/HSD/ATF, crude premiums, freight and insurance, domestic retail under-recovery and lower alkylate and petchem output. Banner: multi-decade high crack spreads.
Financial table on the left, tailwinds and headwinds bullets on the right, banner at the bottom
Throughput was 20.6 MMT versus 20.8 MMT, transportation fuels 12.0 versus 12.1, polymers 1.6 versus 1.7, intermediates and polyesters 2.0 versus 2.2, others 2.5 versus 2.1, with total production for sale flat at 18.1 MMT. Crude runs were a record despite Strait of Hormuz disruption, with the first-ever low sulphur jet fuel to South Africa and twice normal LPG to the domestic market.
Operating table in MMT with commentary bullets
Compares Q2 with pre-conflict: Brent $97 vs $69, Strait of Hormuz crude transit 7.1 mb/d vs 16 mb/d, refinery outages of 11.8 mb/d and global refinery runs 79% vs 82%. Diesel cracks were up 3.5x YoY, jet kero 3.7x and gasoline 3x, with product inventories 6 to 10% below the 5-year average.
Comparison table of Q2 versus pre-conflict metrics with crack spread callouts
Total demand was 105.9 mb/d in Q2 FY26, 99.1 in Q1 FY27 and 102.5 in Q2 FY27; gasoline 28.0 / 26.9 / 27.7, diesel 29.6 / 28.3 / 29.3 and ATF 8.2 / 7.5 / 8.1 mb/d. IEA estimates a CY2026 demand decline of 2.6 mb/d (sources: IEA, Energy Aspects).
Bar chart of total demand with product cluster bars beside it and a source note
Gasoline cracks were $8.4/bbl in Q2 FY26, $25.6 in Q1 FY27 and $24.9 in Q2 FY27 versus a 5-year average of about $12, driven by lower refinery runs in the Middle East, Russia and APAC, low US inventories and lower China exports. RIL's share in East and South Africa rose from 30% to about 50%, with premium grades 98R in Australia, 95R in South Africa and 93R in Kenya-Tanzania.
Crack spread bar chart with drivers and RIL positioning bullets
Gasoil cracks were 18.7 / 63.0 / 65.8 $/bbl (5-year average label partially cut off, about 28) and ATF cracks 16.1 / 62.9 / 59.3 $/bbl (5-year average 25.5). The middle bar is labelled 1Q FY26 on the slide, likely a typo for 1Q FY27. Drivers include Strait of Hormuz diesel disruption, attacks on Saudi refining, a Russia diesel export ban and low US and ARA inventories.
Two crack spread bar charts (gasoil and ATF) with drivers bullets
India oil demand was 57.1 MMT, flat YoY; gasoline 10.4 / 11.4 / 11.3 MMT (+8.5% YoY), diesel 20.7 / 25.7 / 22.3 (+7.5%) and ATF 2.14 / 2.28 / 2.16 (+1.0%). Petrol was lifted by personal mobility and diesel by monsoon irrigation, freight and construction, while LPG and naphtha were the drag (sources: PPAC, DGCA).
Demand bar charts by product with YoY labels and explanatory bullets
Volumes: MS and HSD 1.83 Mn KL (+4.2%), ATF 36.3 TKL, e-mobility 15.8 GWh (+60%), CBG and CNG 18.1 TMT (+121%). Market share MS 3.86%, HSD 5.46%, ATF 1.3%; network of 2,304 retail outlets, 5,943 charge points, 200 CBG/CNG stations and 184 convenience stores, with Jio-bp Pulse at 1,100+ locations and 95% uptime.
Three colour-coded tile groups for volumes, market share and network
Dynamics: ex-China capacity additions of about 0.3 mb/d against about 0.6 mb/d closures in 2026, global demand -2.6 mb/d in CY2026 then +2.0 mb/d in CY2027, Middle East crude and freight uncertainty, and margins supported as inventories rebuild. Priorities are agile actions, multi-geography sourcing, complexity for wide crude range, high utilization and end-to-end value chain optimization.
Two columns with dark-blue header for dynamics and green header for priorities
Naphtha flow from the Middle East was 6.5 vs 12.5 MMT pre-conflict, and ethane 24.3 vs 23.2 cpg; global capacity impacted is PE 41.2 MMTA, MEG 12.8 MMTA and PTA 32 MMTA. Cracker utilization was about 71% globally vs 81%, with ME&A about 48% vs 78%; polyester chain margins hit a 3-year high, up about 30%, and ethane was the most competitive feedstock.
Q2 versus pre-conflict comparison table with margin commentary
Crude and naphtha prices rose sharply on prolonged Strait of Hormuz disruption and Middle East naphtha flows were about 6 MMT per quarter below pre-war. Naphtha AG-Japan freight went from $86/MT in July 2026 to $186/MT in September (Q2 average $122/MT, about 3x YoY), and the ethane vs naphtha cracking differential was $557/MT, 2.3x the CY2025 average (sources: CMA, RIL estimates).
Price and freight charts with explanatory bullets and a source note
Grouped bars for Q2 FY26 / Q1 FY27 / Q2 FY27: Global 81 / 68 / 71%, APAC 82 / 68 / 72%, ME & Africa 79 / 40 / 48%, US 89 / 89 / 90%. China operating rate improved to 79%, NE Asia was hit by naphtha costs and the US is most cost advantaged (source: S&P Platts).
Grouped bar chart by region and quarter with commentary bullets
SEA ethylene margins in $/MT for integrated ethane vs naphtha crackers: 2021 414 / 145, 2022 298 / 11, 2023 335 / 39, 2024 472 / 134, 2025 283 / 45, Q1 CY26 328 / -164, Q2 CY26 708 / 51, Q3 CY26 439 / -117.
Paired green and blue bar chart over years and quarters with footnotes defining margin formulas
Table by product: naphtha MOPS +43% at $815/MT, US ethane +5% at 24.3 cpg, PE +5% at $340/MT, PP +8% at $340/MT, PVC -19% at $295/MT (PVC price +13% lagged EDC +57%), and polyester chain +33% at $573/MT (PX +33%, PTA +15%, polyester deltas +49%). Sources: Platts, OPIS, ICIS, WoodMac.
Four-column table of product, YoY change, Q2 average price or margin and key factor
Domestic polymer demand was -4% YoY (PVC -18%, PP -3%, PE +3%) and polyester -6% (PET +5%, PFY -10%, PSF -5%). Polymer demand grew 18% QoQ and polyester 10% QoQ, with India the strongest major market.
Horizontal bar charts for polymers and polyester sub-products
Dynamics: geopolitics and feedstock volatility, resilient domestic demand (festive, agri, infra), textile and polyester exports helped by India's FTAs, and Asian overcapacity from new China crackers. Priorities are high utilization with a domestic-aligned mix, feedstock flexibility with new VLECs (one operational, the 2nd received in October 2026) and a differentiated portfolio.
Two-column dynamics and priorities layout with header bars
Section divider for part G, Oil and Gas, covering financial and operating performance and gas markets on pages 64 to 67.
Divider slide with paper-tab letter G and section title
Revenue was ₹6,020 crore (-0.6% YoY) and EBITDA ₹4,901 crore (-2.0%) with margin 81.4% (-120 bps). Realizations: KG D6 $8.88/MMBtu (-10.9%), CBM $13.24 (+38.9%) and oil/condensate $98.9/bbl (+38.9%); KG D6 production was 9% lower and margin was down on GoI levies.
Financial table with price realization block and commentary bullets
RIL share production in BCFe: KG D6 63.5 to 57.8 (-9.0%) and CBM 2.8 to 3.4 (+21.4%). Average KG D6 gas was 26.1 / 24.8 / 24.0 MMSCMD, CBM 1.04 MMSCMD, oil/condensate 15,903 bbl/day, and the CBM multilateral campaign phase 2 of 40 wells has 37 completed and 35 put to production.
Production table with a KG D6 gas bar chart and campaign progress bullets
The Middle East conflict tightened LNG, with spot prices moving from about $16 to about $29/MMBtu in Q2 and about 32 MMT of supply disrupted until August 2026, offset by US, Canada, Nigeria and Russia (+25 MMT). EU storage was 72.2% vs a 5-year average of 87.7%; Q2 FY27 averages were JKM 22.83, NBP 21.01, TTF 21.46 and HH 2.89 $/MMBtu.
Line chart of JKM, NBP, TTF and HH for Jan-Sep 2026 with commentary bullets
Gas consumption was flat YoY with CGD up 23% and fertiliser stable via alternate sources; LNG imports were 2.3 MMT/month (about 15% higher YoY) with supply diversified to the US, Oman and Nigeria after the loss of Qatar and UAE. The KGD6 ceiling price was revised to $9.89/MMBtu for H2 FY27, charted against West India DES LNG from H1 FY24 to H1 FY27.
Bullet commentary beside a line chart comparing ceiling price and LNG price by half-year
Closing slide thanking the audience.
Blue-to-green gradient background with a large translucent Reliance logo watermark and centered thank-you text
คำถามทั่วไปเกี่ยวกับสไลด์นี้และเนื้อหาการนำเสนอพื้นฐาน
It is Reliance Industries Limited's 68-page Financial Results Presentation for the second quarter of fiscal 2027, dated 30 October 2026. It was filed with BSE and NSE, India's stock exchanges, as part of RIL's Q2 FY27 results. It covers consolidated performance plus Jio Platforms, Retail, FMCG, JioStar, Oil to Chemicals and Oil and Gas.
Q2 FY27 is the second quarter of fiscal year 2027, covering July to September 2026 (the quarter ended 30 September 2026). India's fiscal year runs from April to March, so FY27 spans April 2026 to March 2027, and H1 FY27 means April to September 2026.
Consolidated revenue was ₹362,268 crore (+27.8% YoY), record EBITDA was ₹62,409 crore (+23.9%) and record PAT was ₹29,550 crore (+33.8%). Segment EBITDA was O2C ₹25,203 crore (+67.9%), Digital Services ₹22,223 crore (+17.7%), Retail ₹6,120 crore (-10.2%) and Oil & Gas ₹4,901 crore (-2.0%).
The Jio Platforms IPO raised ₹30,188 crore (US$3.2bn), India's largest, and Jio listed at a 26.7% premium with a market cap of ₹13.1 lakh crore. Jio has 542.4 Mn subscribers including 300 Mn on 5G, ARPU of ₹218.8 per month, and 30 Mn fixed broadband homes.
Retail EBITDA margin before one-time items was 7.8%, down 120 bps. The deck attributes this to investment in digital commerce, input cost inflation, and the festive season shifting entirely into Q3 (Navratri on 11 October and Diwali on 8 November). A one-time ₹108 crore impairment on 7-Eleven also reduced reported EBITDA to ₹6,120 crore.
A crore is an Indian unit equal to 10 million, so ₹1 crore is ₹10 million. The deck reports most figures in ₹ crore, shows some headline figures in US$ billion for convenience (for example revenue of $37.8 bn and EBITDA of $6.5 bn), and quotes commodity prices in $/bbl and $/MMBtu.
Where a download is offered on the page, it is typically available as a PDF or an editable PPTX. The original filing is also on the BSE website. The deck works as a structural template for a multi-segment earnings presentation: lettered section dividers, a table of contents, a consistent financial table style with a highlighted current-quarter column, segment KPI dashboards and takeaway banners.
Original exchange filing of the presentation
Company investor relations page with quarterly results

Create Your Own Slides
Turn your ideas into professional presentations in seconds with 2slides AI.
อ้างอิงการออกแบบมืออาชีพ เลือกสไตล์ของคุณ และสร้างสไลด์ด้วยการแสดงผลข้อความที่สมบูรณ์แบบ ขับเคลื่อนโดย Nano Banana—เริ่มสร้างการนำเสนอของคุณตอนนี้
เอเจนต์ AI ของคุณสำหรับสไลด์ ประหยัดเวลา เปล่งประกายเร็วขึ้นด้วยการสร้างงานนำเสนออัจฉริยะ


© 2026 2slides สงวนลิขสิทธิ์