
อยู่ในคอลเลกชัน ตัวอย่างงานนำเสนอสำหรับนักลงทุน
Ramelius Resources September 2026 Quarterly Presentation — a 14-slide quarterly results deck from the Western Australian gold miner, lodged with the ASX, covering Q1 FY27 gold production of 48,839 ounces at an AISC of A$2,656/oz (Australian dollars), cash and gold of A$768M, the Mt Magnet plant expansion, Dalgaranga ramp-up, Rebecca-Roe approvals and a free cash flow outlook to FY30.
ใช้หน้าปกของงานนำเสนอนี้เป็นต้นแบบสไตล์สำหรับสไลด์ที่สร้างจากเนื้อหาของคุณเอง หรือเลือกหน้าใดก็ได้ด้านล่างเพื่อใช้เลย์เอาต์ของหน้านั้นเป็นต้นแบบ
การนำทางด่วน
แท็ก
แชร์สไลด์
Ramelius Resources September 2026 Quarterly Presentation — a 14-slide quarterly results deck from the Western Australian gold miner, lodged with the ASX, covering Q1 FY27 gold production of 48,839 ounces at an AISC of A$2,656/oz (Australian dollars), cash and gold of A$768M, the Mt Magnet plant expansion, Dalgaranga ramp-up, Rebecca-Roe approvals and a free cash flow outlook to FY30.
มุมมองรายละเอียดของแต่ละหน้าสไลด์ รวมถึงlayout เนื้อหาหลักและองค์ประกอบภาพ
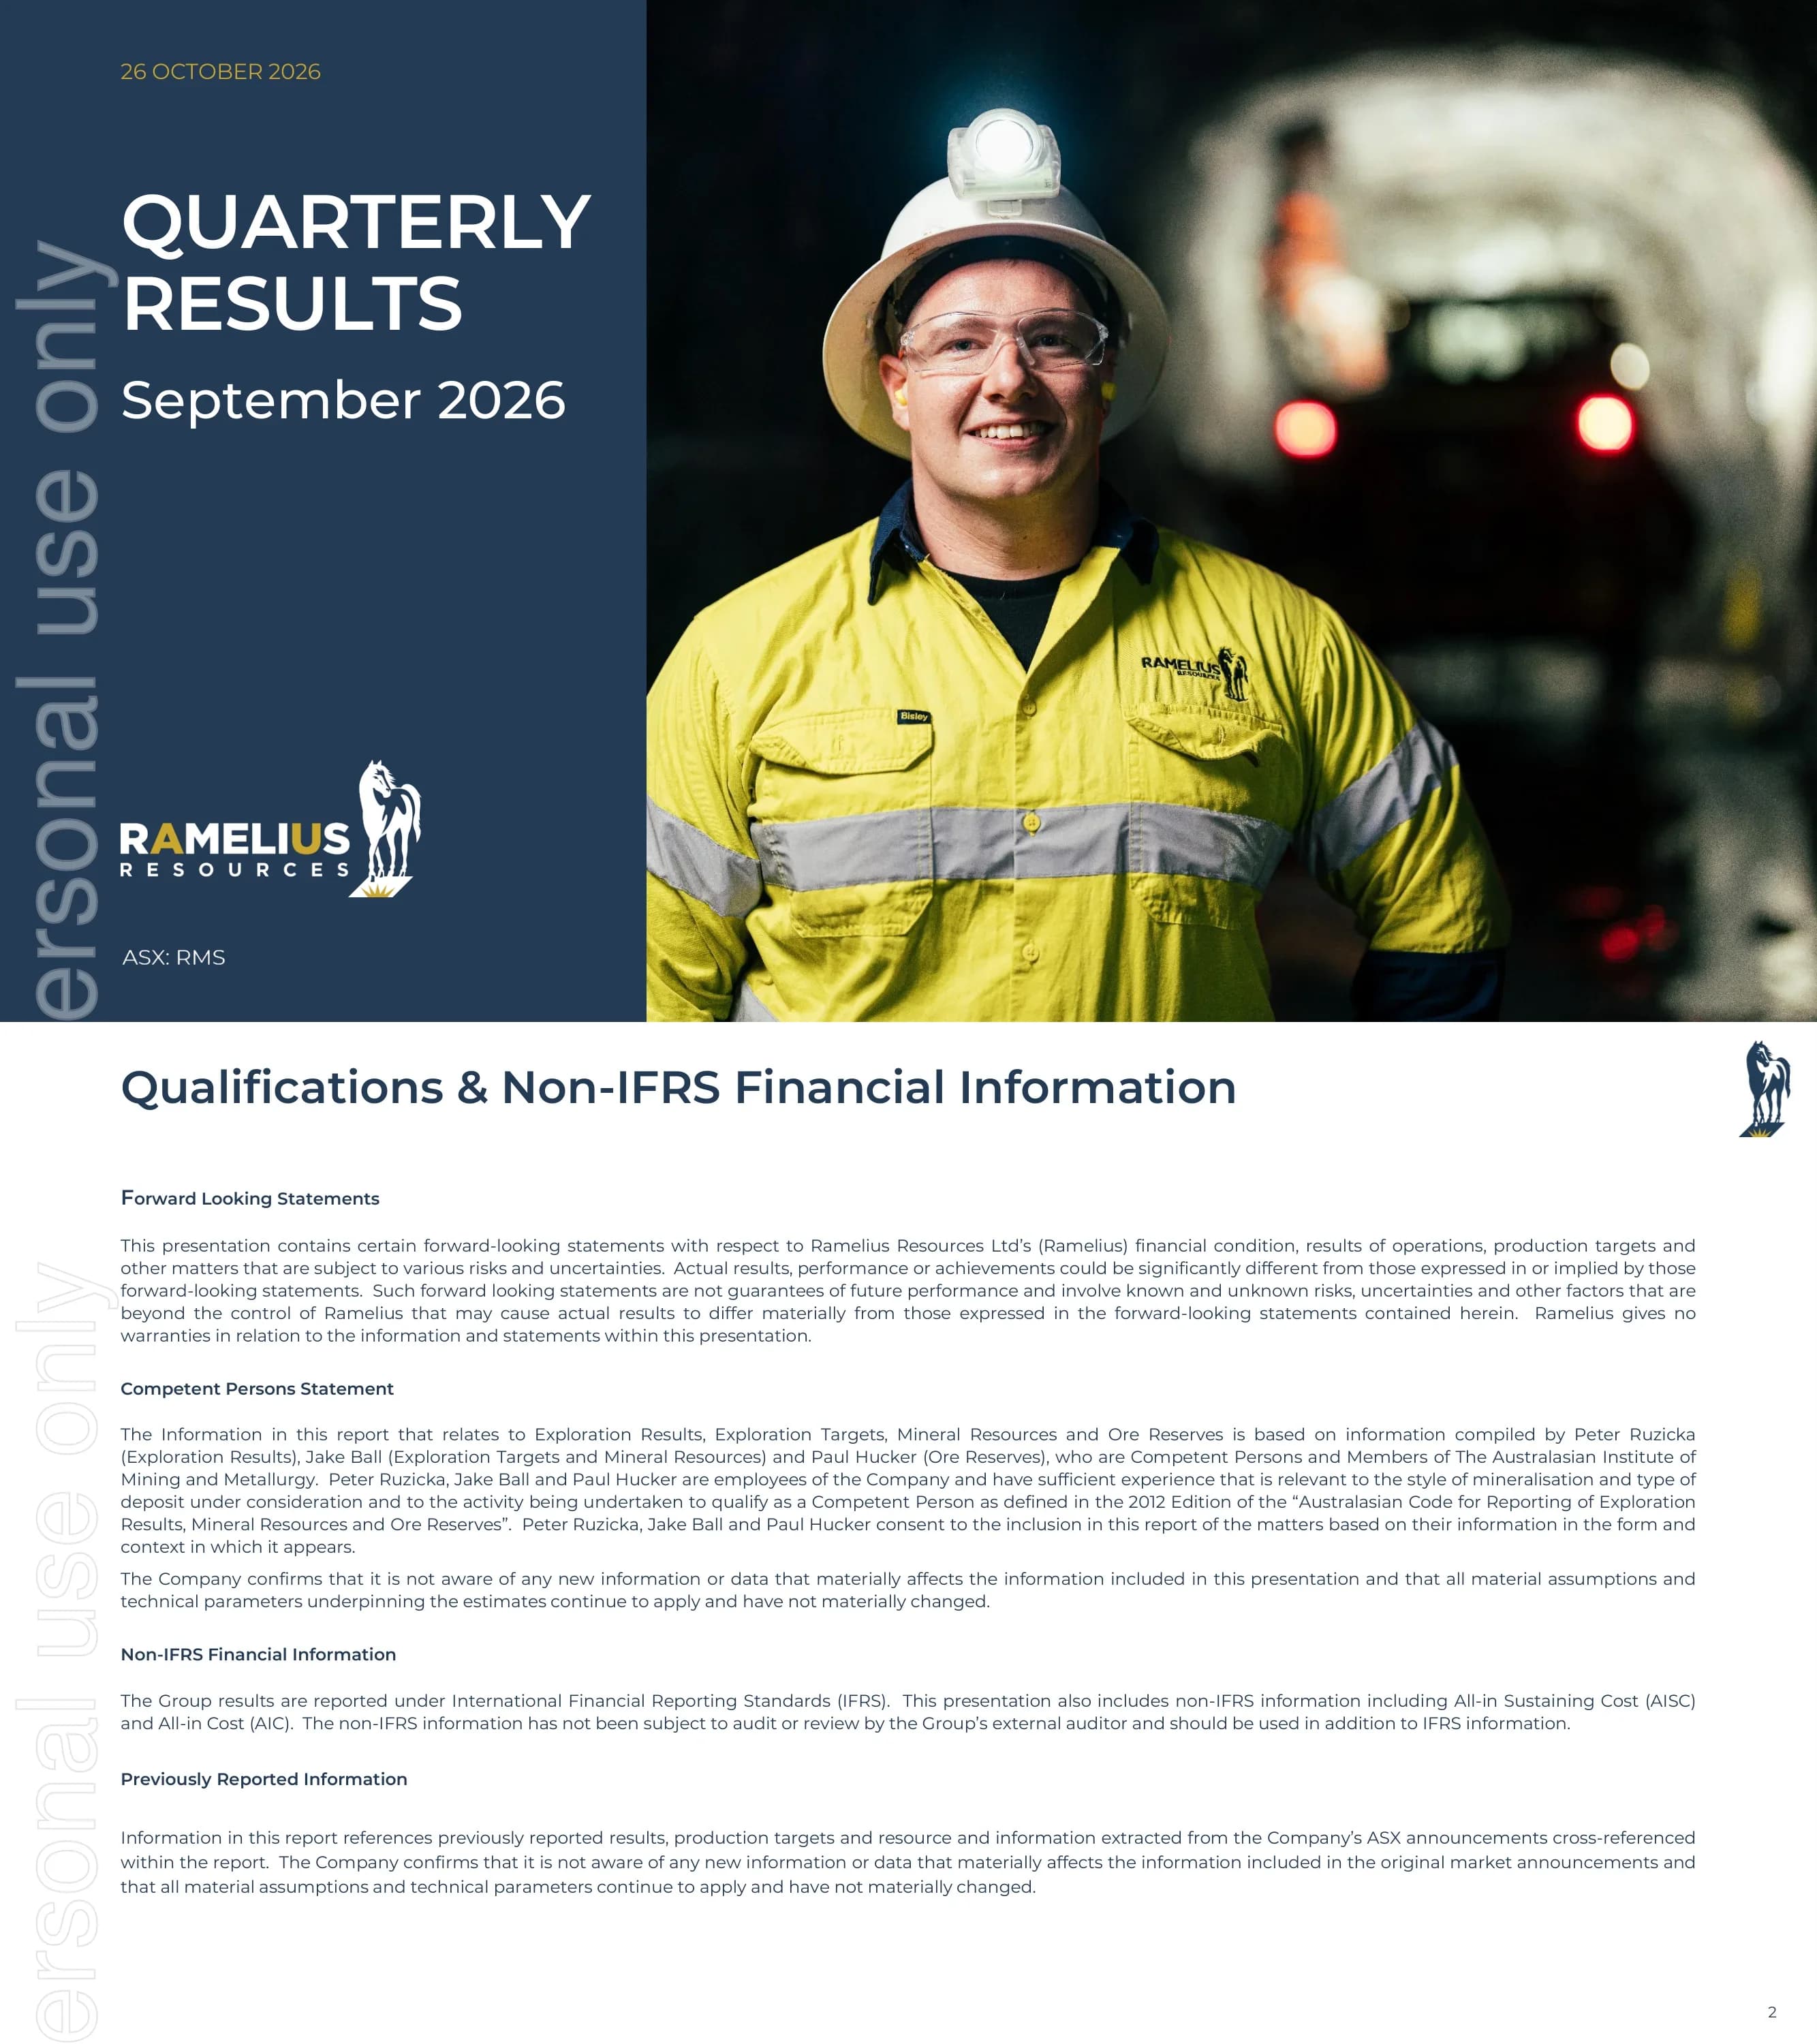
Cover slide dated 26 October 2026 titled 'Quarterly Results, September 2026' with the Ramelius Resources horse logo and ASX: RMS code.
Split layout: left navy panel (about one third) with gold date line, large white title and logo at the bottom; right two thirds a full-bleed photo of a smiling underground miner in hi-vis shirt and cap lamp in a tunnel.
Disclaimer page with forward-looking statements, a Competent Persons Statement (Peter Ruzicka, Jake Ball and Paul Hucker under the 2012 JORC Code), a note that AISC and AIC are non-IFRS measures not audited or reviewed, and a statement on previously reported information.
Text-only page: navy title at top, four bold subheadings each followed by a justified paragraph block on a white background.
Quarter summary: 48,839 oz produced at AISC of A$2,656/oz; 135Kt of Never Never underground ore processed at 4.15g/t; on track for FY guidance of 205,000–225,000 oz at A$2,150–2,350/oz AISC. Cash and gold A$768M (June 2026: A$650M), operating cash flow A$186M, underlying FCF A$62M. Projects: Primero appointed EPC for Mt Magnet Circuit 2, Dalgaranga paste plant commissioning, EPA approved Roe Part V. Exploration spend A$22.7M with 8 surface and 4 underground rigs. Buybacks of A$17.6M take the total to A$156M (62% of the A$250M program); Edna May hub sale to Forrestania for A$300M (A$210M cash, A$90M shares) completed 4 September 2026.
Single-column bullet list grouped under five navy subheadings (Production & Costs, Cash & gold, Projects, Exploration, Corporate) with key figures in bold; footnotes citing ASX releases at bottom.
Stacked bar chart of quarterly gold production by mine (Mt Magnet, Penny, Cue, Dalgaranga): Dec 25 Qtr 45,610 oz, Mar 26 Qtr 38,093 oz, Jun 26 Qtr 53,466 oz, Sept 26 Qtr 48,839 oz, with Dalgaranga becoming the largest contributor. Right side shows a map of Western Australia, 'Two high-quality hubs', marking Mt Magnet, Cue, Dalgaranga, Yalgoo, Penny and the Rebecca/Roe development projects near Kalgoorlie, with haulage directions.
Two-panel layout: left framed stacked column chart; right navy map panel with header bar and legend for development projects, mines, haulage direction and processing plant.
Five KPI columns for Q1 FY27 with four-quarter trends (Q2 FY26–Q1 FY27): ore mined 0.7Mt (up 9% with more mining at Cue and Dalgaranga); mined grade 2.56g/t; ore milled 0.5Mt (2.1Mt annualised until plant expansion); milled grade 3.00g/t (high-grade Penny ore impacted by wet weather); gold production 49koz, with 4koz stockpiled at Penny and full-year guidance of 205,000–225,000 oz on track.
Five equal columns, each with a navy uppercase label, a large gold headline number, short explanatory text and a small four-bar column chart with the latest quarter in dark navy.
Six site photos (wind turbine blade delivery, lifting the new cyclone tower, gym building, turbine tower section lift, cyclone tower in place, camp expansion). Growth capex table (A$M): Circuit 1 upgrade and new Circuit 2 to 4.3–5.0Mtpa 195–215 in FY27 guidance and 35–45 FY28 outlook; processing infrastructure 35–40 / 12–18; mine infrastructure 40–50 / 5–10. Project update: EPC awarded to Primero for the 3Mtpa Circuit 2, new crusher and cyclone tower integrated into Circuit 1 in October, ball mill refurbishment underway, long-lead power items ordered.
Top two-thirds a 3x2 captioned photo grid; bottom left a navy-header capex table; bottom right a cream 'Project Update' callout box with gold bullet points.
Left: life-of-mine stacked bar chart of Mt ore mined per annum split indicated vs inferred, from 0.2Mt in FY26 (actual) and 0.5Mt in FY27 (highlighted) up to 1.0–1.1Mt in FY28–FY31, then tapering to 0.6Mt in FY36. Right: line chart of Kt ore mined per month from 1.9kt in Oct-25 to 46.5kt in Sep-26, with a callout 'On track for 0.5Mt in FY27, ramp up to 1Mt pa run rate by July 2027'.
Two side-by-side charts with underlined section titles: stacked column chart on the left, smooth gold line chart with data labels and a cream callout box on the right.
Part V approval granted for Roe, first gold targeted for Q4 CY2028. The greenfield 3.25Mtpa Rebecca-Roe project holds a 67Mt @ 1.5g/t for 3Moz Mineral Resource (Roe 34Mt @ 1.6g/t for 1.8Moz across Bombora open pits and underground; Rebecca 33Mt @ 1.3g/t for 1.4Moz across Rebecca, Cleo, Duke and Duchess open pits). DFS complete and native title signed; EPA Part V works approval received, mining approvals planning commenced, Rebecca fully permitted.
Gold subtitle line under the title; left card with aerial drill-site photo and green footer banner; right gold-bordered card with central donut chart, Roe and Rebecca resource tags and green check-mark icons; bullet list below.
Five financial KPIs with four-quarter trends: gold sales 51k oz; realised gold price A$6,019/oz (down 3% Q-on-Q, 3,750 oz settled on collars); AISC A$2,656/oz with AISC margin of A$3,363/oz (56%); underlying free cash flow A$62M after A$54M growth capital and A$24M exploration (vs A$123M in Q4 FY26); cash and gold A$768M after Spartan stamp duty and Edna May proceeds. Footnote defines underlying FCF, now including FY27 income tax payments.
Same five-column KPI dashboard pattern as page 5: uppercase label, large gold A$ figure, unit line, commentary and a four-bar mini chart; notes at the bottom.
Waterfall of quarterly movement in cash and gold (A$M): opening 649.6, operating cash flow +186.4, sustaining capital -31.4, Mt Magnet growth capital -52.3, Rebecca-Roe growth capital -1.2, exploration and studies -22.7, working capital -3.1, FY27 income tax -13.6, giving 711.7 (underlying FCF A$62.1M); then share buybacks -17.6, Spartan stamp duty -131.1, Edna May sale +205.0, closing 768.0. Text boxes note 3,750 oz committed to zero-premium collars at A$5,906/oz and A$15M returned via buybacks.
Full-width waterfall chart with navy totals, gold inflows and light-blue outflows; a bracket annotation for underlying FCF; two outlined text boxes ('Free cash flow' bottom left, 'Other cash flow' top right).
Free cash flow outlook (A$m, operating cash flow excludes exploration) at A$5,500/oz and A$6,000/oz: FY27E 140–200, FY28E 100–120, FY29E 830–1,020 and FY30E 1,470–1,790, net of Mt Magnet and Rebecca-Roe growth capital. Three cream panels: FCF inflection through FY30, leverage to gold price (FY30 FCF approaches A$2bn at A$6,000/oz), and outsized FCF relative to valuation versus larger-cap peers.
Gold subtitle; left column of three cream message panels with underlined headings; right a stacked column chart with positive operating cash flow above a zero line and growth capital below, range labels on each segment.
Six investment pillars: dividend yield above mid-tier ASX gold producers (A$376M dividends over 8 years, A$156M buybacks); sector leading cash flows from long-life Mt Magnet and Rebecca-Roe; 205% production growth with a pathway to 600koz p.a. by FY30; exploration upside with an A$100M FY27 budget; reliable operational team with delivery of guidance; benefits of scale and liquidity (ASX100 and MVGDX).
Full-bleed aerial open-pit mine photo background with a 3x2 grid of semi-transparent navy tiles, each with a gold heading and white supporting text.
Closing slide with company details (Ramelius Resources Limited, ASX code RMS, Level 13, 58 Mounts Bay Road, Perth), a note that the release was authorised by the Managing Director, investor enquiry contacts (Mark Zeptner, Managing Director; Brian Massey, GM Investor Relations), media contact Rhys Prka of GRA Partners, and the company website.
Navy background with a darkened mine texture on the left third holding 'Thank you' and the logo; right column of white contact text separated by thin rules.
Appendix tables as at 30 June 2026. Mineral Resources (inclusive of reserves) by project: Mt Magnet 99Mt @ 1.5g/t for 4,900koz, Cue 1,400koz, Dalgaranga 24Mt @ 4.0g/t for 3,000koz, Yalgoo 240koz, Penny 38koz, Rebecca 1,400koz, Roe 1,800koz, Edna May 940koz; total 260Mt @ 1.7g/t for 14,000koz. Ore Reserve: Mt Magnet hub 46Mt @ 2.2g/t for 3,200koz (Dalgaranga underground 6.8Mt @ 7.4g/t for 1,600koz), Rebecca-Roe 25Mt @ 1.4g/t for 1,100koz; total 71Mt @ 1.9g/t for 4,300koz.
Two dense spreadsheet-style tables side by side with navy title bars and grey column headers (measured/indicated/inferred and proven/probable in kt, g/t, koz); notes at the bottom.
คำถามทั่วไปเกี่ยวกับสไลด์นี้และเนื้อหาการนำเสนอพื้นฐาน
It is the 14-slide quarterly results deck Ramelius Resources lodged with the ASX alongside its September 2026 quarterly report (the cover is dated 26 October 2026). It covers gold production, costs, projects, cash flow, a free cash flow outlook, the investment case and the 30 June 2026 Mineral Resources and Ore Reserve tables.
Ramelius produced 48,839 ounces of gold at an all-in sustaining cost (AISC) of A$2,656/oz, sold about 51k oz at a realised A$6,019/oz, generated A$186M of operating cash flow and A$62M of underlying free cash flow, and finished with cash and gold of A$768M. All amounts are in Australian dollars.
Ramelius uses the Australian fiscal year, which starts on 1 July. FY27 runs from July 2026 to June 2027, so the September 2026 quarter is the first quarter of FY27, and FY26 covered July 2025 to June 2026.
Yes. The original PDF is available, along with an editable PPTX converted from the PDF. The conversion keeps the slide layouts, text and most chart graphics editable, though some elements may need touching up compared with the original file.
The five-column KPI dashboards with mini bar charts (pages 5 and 9), the cash-and-gold waterfall (page 10), the project update page with photo grid and capex table (page 6), and the Mineral Resources and Ore Reserve appendix tables (page 14) are all reusable layouts for resources-sector investor presentations.
The Mt Magnet processing plant upgrade to 4.3Mtpa (Circuit 1 upgrade plus a new 3Mtpa Circuit 2 built by Primero), the Dalgaranga underground ramp-up toward a 1Mt pa run rate by July 2027, and the greenfield Rebecca-Roe project (67Mt @ 1.5g/t for 3Moz resource) targeting first gold in Q4 CY2028.
Page 11 shows estimated free cash flow after growth capital at A$5,500/oz and A$6,000/oz gold prices: A$140–200m in FY27E rising to A$1,470–1,790m in FY30E, with FY30 FCF approaching A$2bn at the higher gold price. These are company estimates, not guarantees.
The presentation was lodged with the Australian Securities Exchange (ASX) under the code RMS and is also available on the Ramelius Resources investor website, rameliusresources.com.au.
Official company site with ASX announcements and investor materials

Create Your Own Slides
Turn your ideas into professional presentations in seconds with 2slides AI.
อ้างอิงการออกแบบมืออาชีพ เลือกสไตล์ของคุณ และสร้างสไลด์ด้วยการแสดงผลข้อความที่สมบูรณ์แบบ ขับเคลื่อนโดย Nano Banana—เริ่มสร้างการนำเสนอของคุณตอนนี้
เอเจนต์ AI ของคุณสำหรับสไลด์ ประหยัดเวลา เปล่งประกายเร็วขึ้นด้วยการสร้างงานนำเสนออัจฉริยะ


© 2026 2slides สงวนลิขสิทธิ์