
อยู่ในคอลเลกชัน ตัวอย่างงานนำเสนอสำหรับนักลงทุน
PG&E Corporation 2026 Third Quarter Earnings Presentation, "Turning Point For PG&E And California" (October 22, 2026), filed with the SEC as an exhibit to Form 8-K: Q3 2026 non-GAAP core EPS of 41 cents and $1.24 year to date, reaffirmed 2026 guidance of $1.64-$1.66 and 2027 guidance of $1.78-$1.82, the Strategic Review, wildfire protections under AB 1054 and SB 254, a 12,870 MW data center pipeline, the 2026-2027 capital plan and full GAAP to non-GAAP reconciliations.
ใช้หน้าปกของงานนำเสนอนี้เป็นต้นแบบสไตล์สำหรับสไลด์ที่สร้างจากเนื้อหาของคุณเอง หรือเลือกหน้าใดก็ได้ด้านล่างเพื่อใช้เลย์เอาต์ของหน้านั้นเป็นต้นแบบ
การนำทางด่วน
แท็ก
แชร์สไลด์
PG&E Corporation 2026 Third Quarter Earnings Presentation, "Turning Point For PG&E And California" (October 22, 2026), filed with the SEC as an exhibit to Form 8-K: Q3 2026 non-GAAP core EPS of 41 cents and $1.24 year to date, reaffirmed 2026 guidance of $1.64-$1.66 and 2027 guidance of $1.78-$1.82, the Strategic Review, wildfire protections under AB 1054 and SB 254, a 12,870 MW data center pipeline, the 2026-2027 capital plan and full GAAP to non-GAAP reconciliations.
มุมมองรายละเอียดของแต่ละหน้าสไลด์ รวมถึงlayout เนื้อหาหลักและองค์ประกอบภาพ
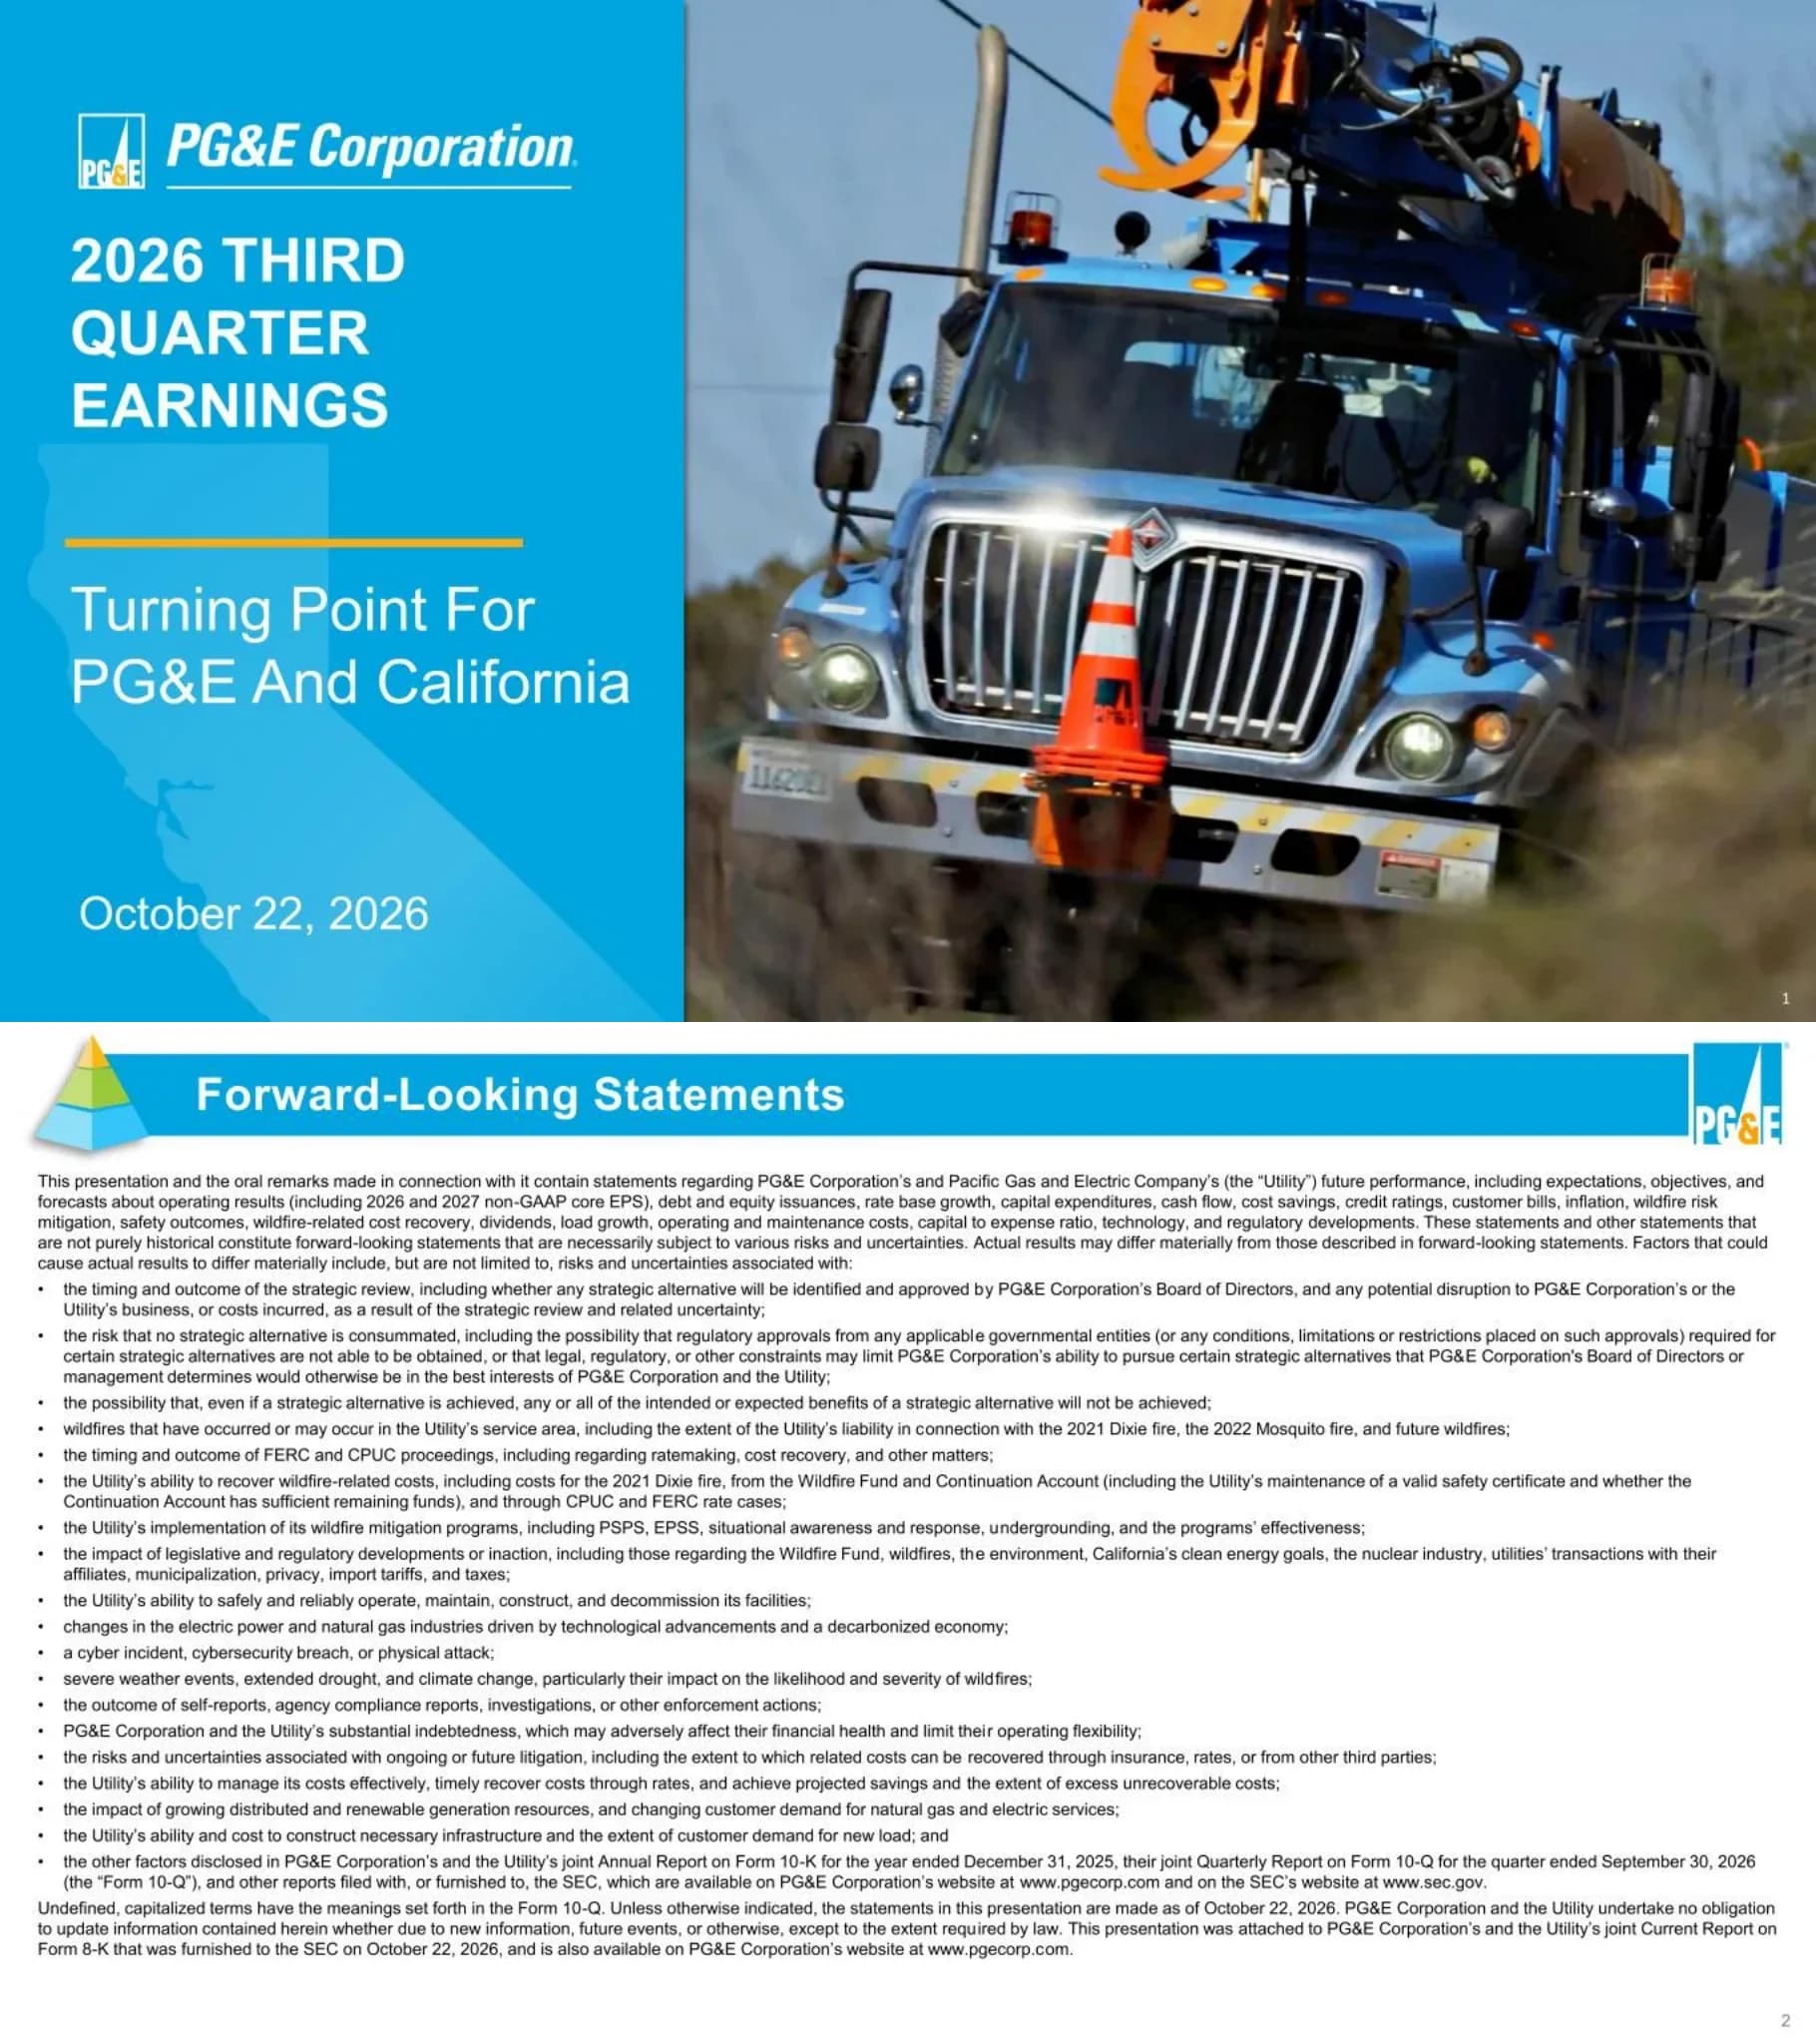
Cover slide with the PG&E Corporation logo, the title "2026 Third Quarter Earnings", the subtitle "Turning Point For PG&E And California" and the date October 22, 2026.
Split layout: left third is a solid PG&E-blue panel with a faint California silhouette, logo, title, amber divider rule and date; right two-thirds is a full-bleed photo of a blue PG&E line truck with a traffic cone.
Safe-harbor disclaimer covering 2026 and 2027 non-GAAP core EPS, financing, rate base and capex; lists risks including the timing and outcome of the Strategic Review, wildfires (including the 2021 Dixie fire and 2022 Mosquito fire), FERC and CPUC proceedings, Wildfire Fund and Continuation Account recovery, legislation, cyber incidents, climate and indebtedness, and notes the deck was furnished with Form 8-K on October 22, 2026.
Standard content template: blue title bar with pyramid icon at left and PG&E logo at right; full-width dense paragraph and bulleted risk list in small black text.
Non-GAAP core EPS of 41 cents for Q3 2026 and $1.24 year to date, marked On Track; guidance of $1.64-$1.66 for 2026 (+10%) and $1.78-$1.82 for 2027 (+9%), no equity need 2026-2030 and consistent dividend growth; key takeaways cover transformation, legislative advocacy on wildfire liability, the Strategic Review and the data center pipeline.
Three equal cards with slanted blue header tabs (2026 Results, Guidance, Key Takeaways); large blue numerals, yellow starburst growth callouts, a green check icon; slanted blue footer banner carries the conclusion.
Lists protections in place: $1B wildfire self-insurance, Wildfire Fund and Continuation Account, presumption of prudency and revised standard, maximum disallowance, precedent to securitize claims from 2025 events, wildfire mitigation plans, an independent safety regulator and annual safety certification; further reform needed on permanent liquidity and disallowance; Strategic Review workstreams are legislative reform, regulatory reform, capital allocation and corporate structure, with objectives to unlock value and achieve an investment grade credit rating.
Two columns: left a light-blue checklist panel with green checkmarks plus a gray 'Further Reform Needed' box; right four outlined pill boxes with colored dots and a solid green objectives box.
Situational awareness (35 avoided ignitions using 35k+ sensors, ~6M SmartMeters, 707 cameras, 1,650 weather stations, 24/7/365 hazard awareness center), operational mitigations (6 PSPS events in 2026, EPSS on 100% of HFTD/HFRA circuits, 48 safety teams, 4 helicopters) and long-term resiliency (2,794 hardening miles, 1,400 undergrounding miles, 1,804 sectionalizing devices, 4.5M trees removed); weather-normalized ignition rate fell from 3.23 in 2017 to 0.83 in 2026, down 74%.
Left: three stacked tinted bands (blue, gray, green) with bold section headings and bullets with blue-highlighted figures; right: framed line chart with data labels and a large down-arrow callout.
Data center pipeline grew from 12,710 MW in June 2026 to 12,870 MW in September 2026: application and preliminary engineering 8,350 MW, final engineering 3,880 MW, interconnection construction agreement 400 MW, construction 240 MW; 174 MW online since 2024 (from 88); estimate that 1 GW equals a 1% or more electric bill reduction; 27, 18 and 3 projects in the respective pipeline stages as of 9/30/26.
Left color-coded table (blue, amber, light-green rows, green total row) comparing two dates; right 'Pipeline Highlights' boxes linked to table rows with bracket connectors.
Illustrative model: 9%-10% customer capital investment offset by enablers of 2%-4% non-fuel O&M reduction, 2%-4% electric load growth and 2% other including efficient financing, for a 6%-10% subtotal and customer bills at 0%-3%, at or below assumed inflation; 'Standing For Customers' pillars are safe reliable service, lower cost of capital, lower customer bills and unlock value.
Left: label rows paired with a green-bordered 'Model' column of percentage chips, yellow starburst on the bill outcome; right: light-blue panel with four icon-led statements.
Nine-month bridge from $1.14 in 2025 to $1.24 in 2026: +12 cents customer capital investment, +4 cents O&M savings, -2 cents redeployment and -4 cents timing and other; fourth-quarter factors shown with arrows (capital investment, savings and other up; redeployment down).
Waterfall chart with blue endpoint bars, green increases and amber decreases; right boxed legend of fourth-quarter factors with green and amber arrows.
Weighted average rate base of $69B (2025A), $75B (2026F) and $81B (2027F), split CPUC/FERC, with 94% and 87% already authorized for 2026 and 2027; CapEx of $12.4B in 2026 and $11.4B in 2027; 2028-2030 rate base ($89B, $96B, $106B) and CapEx ($15.4B, $16.3B, $16.0B) shown in gray as withdrawn guidance; safety and compliance priorities unchanged while some work (new housing, renewables interconnection, technology, large load beyond initial 1.8 GW) will be delayed or deferred.
Two framed stacked-bar charts (light blue CPUC, navy FERC) with ghosted gray bars for withdrawn years; right light-blue text panel with green and blue headings.
Rating ladder from B1/B+ to A2/A comparing present ratings with 2020: utility secured debt up from Baa3/BBB- to Baa1/BBB+ at Moody's, S&P and Fitch; corporation secured debt improved at each agency (Moody's Ba2 from B1, S&P BB+ from BB-, Fitch BBB- from BB); outlooks positive (Moody's), stable (S&P) and negative (Fitch); key principles include prioritizing investment grade ratings and avoiding equity dilution at a low stock price.
Grid table split into investment grade (blue) and sub-investment grade (gray) bands with green arrows from dotted 2020 circles to solid present circles; right 'Key Principles' checklist and legend box.
Non-fuel O&M net savings of $510M (5.5%) in 2023, $340M (4%) in 2024 and $220M (2.5%) in 2025, with a model of $160M-$300M (2%-4%); components are resource management, efficiencies and insurance, capital conversion and planning, execution, automation and AI, offset by net cost increases.
Column table with gray year cards and a green-bordered 'Model' column; blue highlighted rows for net and percent savings; yellow starburst on the model target.
Regulatory environment checklist (4-year revenue certainty, 3-year cost of capital cycle with ROE adjustment mechanism, FERC formula rate, constructive legislation SB 884, SB 846, SB 410, SB 254) and a milestone timeline from Q3 2025 (SB 410 final decision) and Sep 2025 (SB 254 signed) through Oct 2026 interim GRC rate recovery decision, Nov 2026 Kincade and Dixie proposed decision, Mar 1, 2027 WMP submission and Mar 2027 GRC proposed decision.
Top: green shield icon with checkbox list; bottom: horizontal timeline in a rounded gray panel with filled green check nodes for completed and hollow nodes for upcoming milestones, labels alternating above and below.
2023A-2025A scorecard: rate base $58B, $63B, $69B; non-fuel O&M reduction 5.5%, 4%, 2.5%; capital-to-expense ratio 0.8, 0.9, 1.0; corporation credit ratings B1/BB- to Ba3/BB to Ba2/BB; core EPS growth 12%, 11%, 10%; operating cash flow $4.7B, $8.0B, $8.7B; FFO/Debt 13.7% (2024) and 14.0% (2025); dividend payout 0%, 3%, 7%; safety certification each year.
Multi-section scorecard table with gray year headers and grouped rows (Customer Investment, Affordability Enablers, Consistent Performance, Risk Reduction); green up-arrows and checkmarks.
Four icon pillars (wildfire mitigation, customer affordability, data center load growth, durable wildfire solution); rate base $69B/$75B/$81B with ~8% average annual growth; core EPS growth line 10%, 12%, 11%, 10%, 10%, 9% for 2022A-2027F plus DPS growth; capital-to-expense ratio PG&E 0.9 (2024), 1.0 (2025), 1.1 (2026F) versus 2025 peer average 2.2 and top decile 2.8.
Top green-outlined icon row; bottom two framed panels: blue bar plus line chart on the left, orange-outlined bar chart comparing PG&E with peers on the right.
Q&A divider presenting the company's three-tier framework: Physical and Financial Safety at the base, Affordable and Resilient Energy in the middle and Decarbonized Energy System at the top.
Left blue panel with logo and 'Q&A'; right a large 3D pyramid (blue, green, amber tiers) with connector lines to slanted color ribbons and icons.
Section divider introducing Appendix 1, the presentation endnotes.
Same split layout as the cover: blue left panel with logo, title and amber rule; utility truck photo on the right.
Footnotes for slides 3-8: non-GAAP core EPS definitions and the inability to provide GAAP guidance; Wildfire Fund claims above the $1B self-insurance attachment point; the AB 1054 prudency standard; maximum disallowance of 20% of electric T&D equity rate base; program start years; data center pipeline stage definitions (including the $500,000 preliminary study fee); and drivers of customer capital investment, including the CPUC ROE change from 10.28% to 9.98%.
Dense text page under the blue title bar, grouped by hyperlinked slide-title subheadings with numbered notes.
Footnotes for the capital plan (rate base excludes CWIP and non-earning AB 1054/SB 254 rate base), credit ratings, O&M cost reduction definitions (including a $321 million lower pension service cost in 2023) and the differentiated performance scorecard; notes that S&P Global's RRA lowered California's ranking to Average/2 on October 14, 2026, and that guidance beyond 2027 was withdrawn on September 2, 2026 with the Strategic Review announcement.
Dense text page with hyperlinked slide subheadings and numbered notes.
Footnotes listing the peer utilities used for the capital-to-expense comparison, the share count assumptions for mandatory convertible preferred shares (based on a $20.55 common share price), authorized capital structures (CPUC 52% equity, FERC 50% equity), unrecoverable net interest, CAL FIRE data sources for wildfire statistics, AB 1054 prudency and disallowance notes and Diablo Canyon pre-extension and extension periods.
Dense text page with hyperlinked slide subheadings and numbered notes.
Section divider for Appendix 2, supplemental earnings materials.
Split cover-style layout with blue left panel and utility truck photo on the right.
Key ranges for 2026: non-GAAP core EPS $1.64-$1.66 and diluted shares of 2,210M-2,295M; weighted average rate base of $75B (CPUC $62B at 9.98% ROE and 52% equity; FERC $13B at 10.38% ROE and 50% equity); unrecoverable net interest of $350M-$400M after tax.
Top centered light-blue 'Key Ranges' card; bottom two rounded cards, green for rate base table and amber for earnings factors; note that changes from the prior quarter appear in blue text.
Key ranges for 2027: non-GAAP core EPS $1.78-$1.82 and diluted shares of 2,210M-2,300M; weighted average rate base of $81B (CPUC $68B, FERC $13B, same ROE and equity ratios); unrecoverable net interest of $375M-$425M after tax.
Same three-card structure as the 2026 page for easy year-over-year comparison.
Left chart: California incidents of 10 acres or more (all sources, per CAL FIRE) versus structures destroyed in PG&E reportable fires in HFTD/HFRA during R3+ conditions, falling from 18,804 in 2018 to 0 in 2023-2025 and 1 in 2026 YTD; right chart: PG&E R3+ ignitions over 10 acres in HFTD+HFRA fell from 24 in 2017 to 1 in 2025 and 3 in 2026 YTD (as of 10/19/26).
Two side-by-side white chart cards: combined pale-yellow bar and blue line chart with labeled values on the left; solid amber bar chart on the right.
Compares the AB 1054 Wildfire Fund (over $21.0B: $7.5B utility upfront funding with PG&E $4.8B, $3.0B utility annual funding, over $10.5B customer charges of ~$900M a year) with the SB 254 Continuation Account ($18.0B: $3.9B contingent utility funding only if needed with PG&E $373M a year, $5.1B utility annual funding 2029-2045 with PG&E $144M, $9.0B customer charges 2036-2045); the PG&E monthly bill impact is about $3.
Two central stacked columns color-coded amber, green and blue with matching colored labels on either side; dashed outline for contingent funding; asterisk footnotes.
Six checkmarked points: first step after the January 2025 fires building on AB 1054, a new $18B Continuation Account, retention of rate smoothing, liquidity and maximum disallowance, a utility right of first refusal over subrogation sales, early securitization for 2025 fires and a platform for wider reform; key features are flexible, improved, principled and rebalanced, with PG&E's share lowered by 25% to 47.85% (from 64.20%); the Governor signed SB 254 on September 19, 2025.
Left stack of six rounded rows with large green check circles; right 2x2 grid of feature cards with amber icons under a yellow 'Key Features' starburst.
Physical risk reduction (mitigations, approved WMP, safety certification) drives financial protections under AB 1054 and SB 254: cost recovery unchanged with an improved prudency standard and $1B customer-funded self-insurance; liquidity bolstered once claims exceed $1B, with the Continuation Account and securitization for 2025 fires; reimbursement improved with the 20% maximum disallowance retained.
Left light-blue panel with a numbered vertical flow; right three color-headed columns (green, amber, blue) with bulleted details.
Step-by-step flow: claims filed against a covered utility; utility seeks payment from the fund for eligible claims over $1B; files a CPUC cost recovery application after substantially all claims are paid; CPUC reviews conduct in 12 months with a possible 6-month extension; allowed costs mean the fund is not reimbursed, while disallowed costs require partial or full reimbursement capped at 20% of T&D equity rate base.
Top-down flowchart of full-width bars in graduated blue-gray tones with downward arrows, splitting into two outcome boxes; right column of teal arrow-shaped annotation tags.
Timeline from SB 846 signed 9/2/22 and a $1.4B DWR loan through NRC filings, the 12/14/23 CPUC decision, $1.1B DOE Civil Nuclear Credit terms, the 2025 NRC environmental report, NRC license renewal approval in 4/26 and the first CNC payment in 8/26; cost recovery covers the 2022-2025 pre-extension period and the 2025-2030 extension period with $100M a year in lieu of rate base return and a $13/MWh performance fee.
Aerial photo of the Diablo Canyon plant at left; horizontal check-node timeline across the top; a two-segment blue chevron bar below with bulleted columns.
2017 lacked EPSS, PSPS, undergrounding, HD cameras, weather stations, a wildfire mitigation plan and continuous monitoring; by 2026 PG&E has 707 AI-capable cameras, 1,650 weather stations, a 24/7/365 hazard awareness center, 1,400 underground miles, 2,794 hardening miles, 1,804 sectionalizing devices and 4.5M trees removed, plus operational mitigations such as EPSS, PSPS, continuous monitoring and downed conductor detection.
Before/after layout: narrow left column of red X items for 2017; wide right panel for 2026 with labeled sub-panels, green checkboxes and large blue numerals, and a grid of light-blue tiles.
Docket table as of October 2026 covering the 2027 GRC (proposed decision March 2027, final May 2027, interim rate recovery decision Q4 2026), Kincade and Dixie AB 1054 cost recovery (proposed decision 11/13/26), the 10-year undergrounding plan filed 9/30/26, Electric Rule 30, the rate design OIR, 2023 and 2024 WMCE, the CCSF petition, wildfire and gas safety costs, the 2026 WMP and the 2025 and 2026 safety certificates.
Four-column table with blue headers and a green 'Expected Milestones' header; alternating light-blue rows; prior-quarter changes highlighted in blue text.
Section divider for Appendix 3, supplemental non-GAAP information.
Split cover-style layout: blue left panel with logo and title, utility truck photo on the right.
Index of exhibits: A, GAAP to non-GAAP core earnings reconciliation (slides 33-36); B, key drivers of core EPS (slide 37); C, net income to Adjusted EBITDA (slide 38); D, operating income and total debt to Adjusted FFO and Adjusted Total Debt (slide 39); E, non-GAAP financial measures (slide 40).
Three-column index table with blue headers, dotted row separators and hyperlinked slide references.
Q3 2026 GAAP diluted earnings of $773M ($0.34 per share) versus $847M ($0.37) in Q3 2025 reconcile to non-GAAP core earnings of $928M ($0.41) versus $1,142M ($0.50); nine-month GAAP diluted earnings of $2,412M ($1.06) reconcile to core earnings of $2,831M ($1.24) versus $2,520M ($1.14); non-core items include Wildfire Fund amortization, bankruptcy and legal costs, investigation remedies, prior period regulatory impact, SB 901 securitization, strategic repositioning and wildfire-related costs; amounts tax-adjusted at a 27.98% statutory rate.
Financial reconciliation table with three-month and nine-month column groups, alternating light-blue rows and double-underlined totals; footnotes below.
Wildfire Fund amortization costs of $141M and $369M pre-tax for the three and nine months; a $40M pre-tax benefit related to wildfire-related securities claims; investigation remedies of $10M (Q3) and $64M (nine months) pre-tax, $8M and $56M post-tax, including the Wildfires OII, locate and mark OII, the 2020 Zogg and 2022 Mosquito fire settlements.
Footnote paragraphs with a small inset table of investigation remedy components.
Prior period regulatory impact tied to a FERC TO20 settlement ($1M and $70M pre-tax); SB 901 securitization costs ($32M and $23M pre-tax); strategic repositioning costs of $58M pre-tax ($42M post-tax) split between $37M workforce organizational design and $21M corporate organizational design, including Strategic Review advisory costs.
Footnote paragraphs with an inset strategic repositioning table.
Wildfire-related costs net of recoveries for the 2019 Kincade fire ($1M Q3, $4M nine months) and 2021 Dixie fire ($12M, $19M), totaling $14M and $23M pre-tax or $10M and $17M post-tax; definition note for non-GAAP core earnings and EPS.
Footnote text with an inset cost table and generous white space below.
Q3 bridge from $1,142M ($0.50) to $928M ($0.41): customer capital investment +$60M (+$0.03), redeployment -$21M (-$0.01), timing and other -$253M (-$0.11); year-to-date bridge from $2,520M ($1.14) to $2,831M ($1.24): capital investment +$266M (+$0.12), O&M savings +$101M (+$0.04), redeployment -$39M (-$0.02), timing and other -$17M (-$0.04).
Driver table with Q3 and year-to-date column groups, alternating blue rows and numbered explanatory footnotes.
Q3 2026 GAAP net income of $776M (vs $850M) and operating income of $1,249M (vs $1,209M) reconcile to Adjusted EBITDA of $2,711M (vs $2,706M); nine-month net income of $2,422M (vs $2,033M) and operating income of $3,982M reconcile to Adjusted EBITDA of $8,023M (vs $7,538M), with depreciation, amortization and decommissioning of $3,434M year to date.
Single reconciliation table with four numeric columns, alternating light-blue rows and bold subtotal lines.
2025 Adjusted FFO of $7,295M (2024: $6,717M) and Adjusted Total Debt of $52,185M (2024: $49,077M), giving a 2025 Adjusted FFO to Total Debt ratio of 14.0%; debt adjustments include $10,145M of securitized debt, $750M junior subordinated notes and power purchase commitment debt equivalents.
Two side-by-side calculation tables with a full-width blue formula banner showing the ratio as a fraction.
Definition of non-GAAP core earnings and core EPS (income available for common shareholders, diluted, less non-core items), why management uses them for planning and incentive compensation, why GAAP guidance cannot be reconciled without unreasonable effort, and a caution that they are not substitutes for GAAP measures.
Text-only page under the blue title bar with a bold subheading and three paragraphs.
คำถามทั่วไปเกี่ยวกับสไลด์นี้และเนื้อหาการนำเสนอพื้นฐาน
It is PG&E Corporation's 40-slide deck for its 2026 third quarter earnings call, titled "Turning Point For PG&E And California" and dated October 22, 2026. It was filed with the SEC as Exhibit 99.2 to Form 8-K and covers results, guidance, wildfire protections, load growth, the capital plan, regulatory progress and non-GAAP reconciliations.
Non-GAAP core EPS was $0.41 for the quarter ($928 million) versus $0.50 in Q3 2025, and $1.24 for the first nine months versus $1.14. GAAP diluted EPS was $0.34 for the quarter and $1.06 year to date. PG&E reaffirmed 2026 core EPS guidance of $1.64-$1.66 and 2027 guidance of $1.78-$1.82.
On September 2, 2026 PG&E withdrew capital expenditure, rate base and earnings growth guidance beyond 2027 when it announced its Strategic Review. The deck keeps 2026-2027 figures (rate base of $75B and $81B, CapEx of $12.4B and $11.4B) and shows the earlier 2028-2030 numbers in gray as withdrawn guidance.
Yes. Besides the original PDF, there is a PPTX converted from the PDF. Because the SEC filing stores each slide as an image, the converted slides are mostly image-based. They are useful for reviewing and annotating, but text and charts may need to be rebuilt to be fully editable. It is not an original PG&E template file.
It was furnished to the SEC on October 22, 2026 as an exhibit to PG&E Corporation's and Pacific Gas and Electric Company's joint Current Report on Form 8-K, and it is also posted on pgecorp.com. The slides are rasterized images from that filing.
Every content slide uses a bright blue title bar, a small three-tier pyramid icon and a slanted blue footer banner that states the slide's conclusion, so the headlines read as one storyline. Other reusable devices include yellow starburst callouts for growth rates, a waterfall EPS bridge, stacked rate base bars with withdrawn years shown in gray and a regulatory docket table that marks changes in blue text.
It explains the AB 1054 Wildfire Fund (over $21B) and the new SB 254 Continuation Account ($18B), with PG&E's share lowered to 47.85% from 64.20%. Other topics are the $1B customer-funded self-insurance layer, the presumption of prudency with an annual safety certificate, the 20% of T&D equity rate base maximum disallowance and a step-by-step flowchart of fund claims and reimbursement.
The pipeline was 12,870 MW in September 2026, up from 12,710 MW in June. It includes 8,350 MW in application and preliminary engineering, 3,880 MW in final engineering, 400 MW under interconnection construction agreements and 240 MW in construction, with 174 MW online since 2024. PG&E estimates each 1 GW can reduce electric bills by 1% or more.
The original filing of this presentation, furnished October 22, 2026.

Create Your Own Slides
Turn your ideas into professional presentations in seconds with 2slides AI.
อ้างอิงการออกแบบมืออาชีพ เลือกสไตล์ของคุณ และสร้างสไลด์ด้วยการแสดงผลข้อความที่สมบูรณ์แบบ ขับเคลื่อนโดย Nano Banana—เริ่มสร้างการนำเสนอของคุณตอนนี้
เอเจนต์ AI ของคุณสำหรับสไลด์ ประหยัดเวลา เปล่งประกายเร็วขึ้นด้วยการสร้างงานนำเสนออัจฉริยะ


© 2026 2slides สงวนลิขสิทธิ์