
อยู่ในคอลเลกชัน ตัวอย่างงานนำเสนอสำหรับนักลงทุน · ตัวอย่างพรีเซนเทชันนักลงทุนออสเตรเลีย
Orica FY2026 Full Year Results Presentation is the English-language "2026 Full Year Results" investor presentation from Orica, the mining and infrastructure solutions company, lodged with the ASX on 12 November 2026 and presented by Managing Director and CEO Sanjeev Gandhi and CFO James Crough. It covers the year ended 30 September 2026: safety and sustainability, segment results for Blasting Solutions, Digital Solutions and Specialty Mining Chemicals, the financial tables, a refreshed strategy, FY2027 outlook and supplementary appendices. Amounts are in A$ (Australian dollars) unless a slide says otherwise.
ใช้หน้าปกของงานนำเสนอนี้เป็นต้นแบบสไตล์สำหรับสไลด์ที่สร้างจากเนื้อหาของคุณเอง หรือเลือกหน้าใดก็ได้ด้านล่างเพื่อใช้เลย์เอาต์ของหน้านั้นเป็นต้นแบบ
การนำทางด่วน
แท็ก
แชร์สไลด์
Orica FY2026 Full Year Results Presentation is the English-language "2026 Full Year Results" investor presentation from Orica, the mining and infrastructure solutions company, lodged with the ASX on 12 November 2026 and presented by Managing Director and CEO Sanjeev Gandhi and CFO James Crough. It covers the year ended 30 September 2026: safety and sustainability, segment results for Blasting Solutions, Digital Solutions and Specialty Mining Chemicals, the financial tables, a refreshed strategy, FY2027 outlook and supplementary appendices. Amounts are in A$ (Australian dollars) unless a slide says otherwise.
มุมมองรายละเอียดของแต่ละหน้าสไลด์ รวมถึงlayout เนื้อหาหลักและองค์ประกอบภาพ
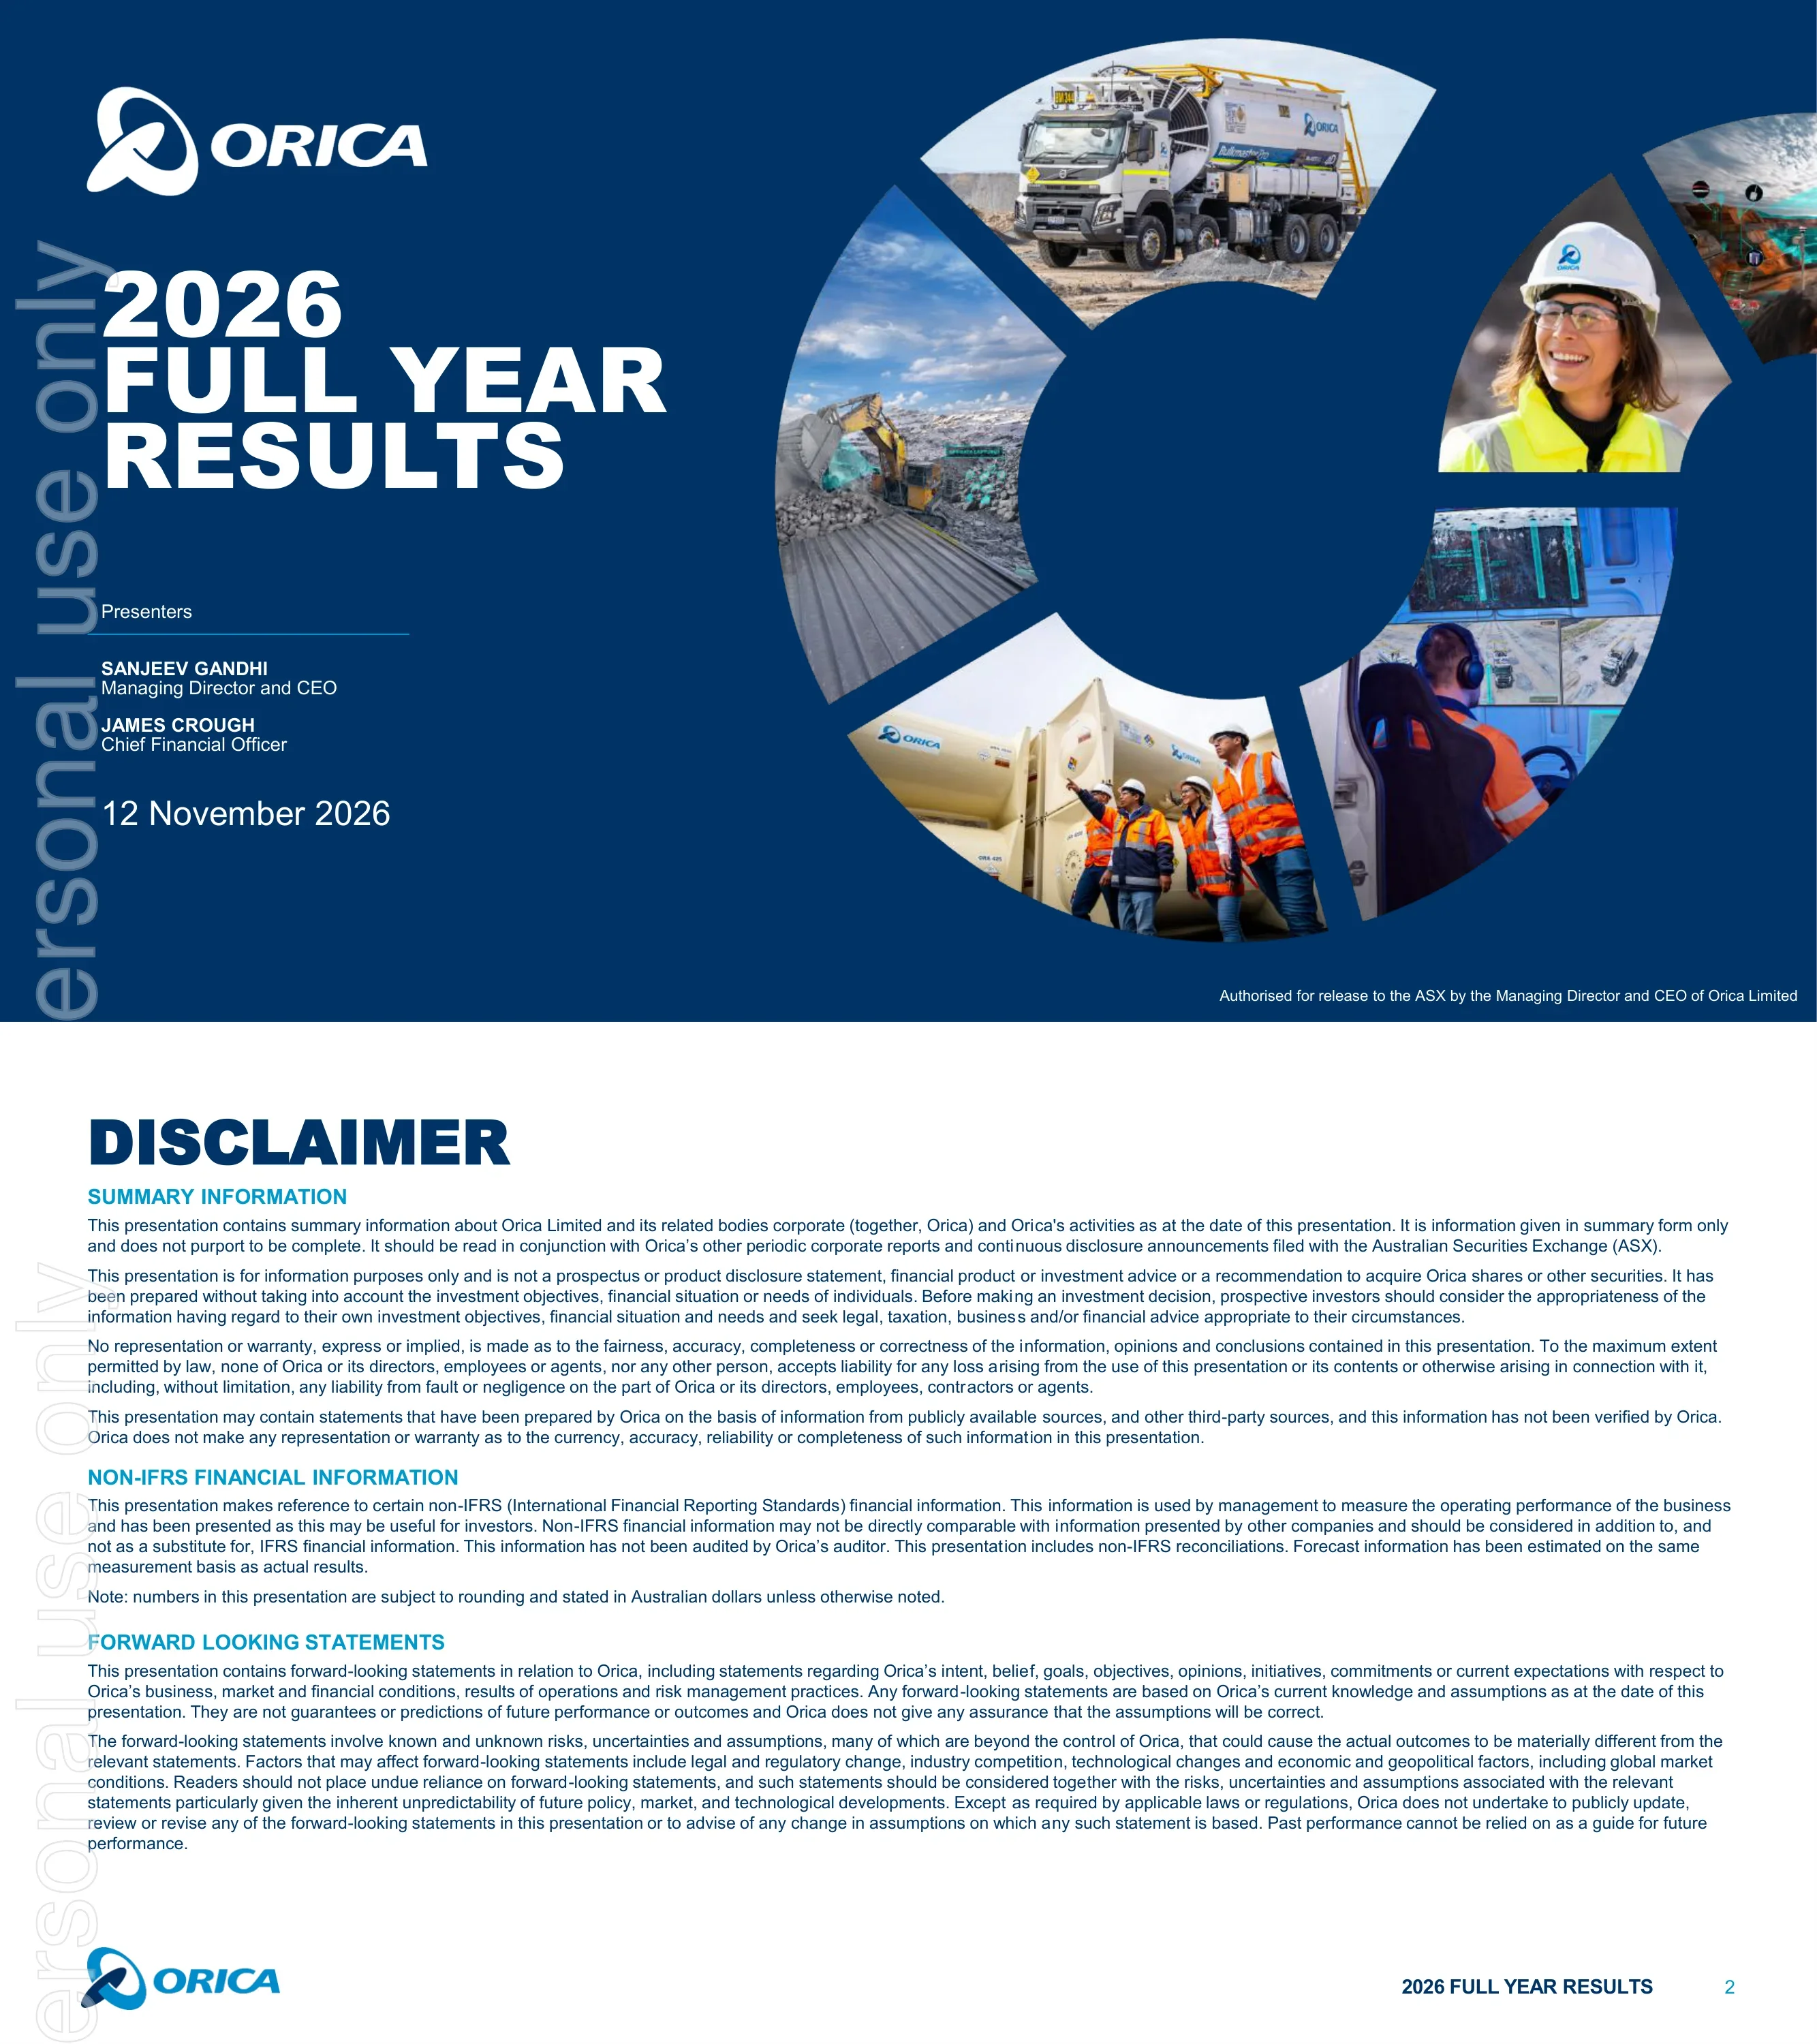
Cover slide for Orica's 2026 Full Year Results, dated 12 November 2026. Presenters are Sanjeev Gandhi, Managing Director and CEO, and James Crough, Chief Financial Officer. A footer notes it was authorised for release to the ASX by the Managing Director and CEO.
Dark navy background with the Orica logo top left and large white title text at left. A ring-shaped collage of segmented photos (delivery truck, excavator, smiling worker, control room operator, workers by tank containers) fills the right side.
Standard legal disclaimer in three parts: summary information (not investment advice or a prospectus), non-IFRS financial information (unaudited, reconciliations included) and forward-looking statements. It notes numbers are subject to rounding and stated in Australian dollars unless otherwise noted.
Text-only page with three blue section headings and dense small-print paragraphs on a white background.
Section divider introducing the Full Year in Review segment, led by Sanjeev Gandhi, Managing Director and CEO.
Full-bleed photo of a technician beside a GroundProbe radar trailer, with a navy title panel on the left holding the heading and a circular headshot of the presenter.
Safety: one fatality (2025: zero), SICR of 0.094 (2025: 0.098) and zero significant environmental incidents. People: 29.2% women in senior leadership (2025: 33.3%) and $3.8m community investment against an $18.0m 2026 to 2030 target. Sustainability: the 30% net Scope 1 and 2 reduction target by FY2026 is marked achieved at 35%, the 45% by FY2030 target is on track, 60% and 100% renewable electricity by 2030 and 2040 are on track, and a 25% Scope 3 reduction by 2035 is on track, with a net zero ambition by 2050.
Left half shows safety and people KPIs under icon headings with prior-year comparatives; right half shows three sustainability columns (Scope 1 and 2, Scope 2, Scope 3) with green and blue status tags and a large 2050 call-out. Small-print footnotes define the measures.
Headline results: EBIT $1,057m (2025: $992m), EBIT margin 12.8%, NPAT pre SI $590m, EPS pre SI 126.8cps, DPS 64.0cps, leverage 1.46x at the lower end of the target range, ROIC 11.3% and RONA 15.6%. Text highlights record sodium cyanide production at Yarwun and Winnemucca, Digital Solutions and Specialty Mining Chemicals delivering nearly 23% of group earnings, the Nelson Brothers and Danafloat acquisitions, and a positive final investment decision on the Hunter Valley Hydrogen Hub.
Left column of three bulleted themes (resilient performance, strong financial performance, strategic action) with icons; right side a grid of eight boxed KPI tiles with up arrows and prior-year values.
Six bar charts for 2021 to 2026: EBIT $405m to $1,057m (+21% CAGR), NPAT pre-SI $193m to $590m (+25% CAGR), EPS 47.4 to 126.8 cps (+22% CAGR), ROIC 5.4% to 11.3% (+5.9 p.p.), RONA 8.1% to 15.6% (+7.5 p.p.) and dividend 24 to 64 cps (+22% CAGR) with payout ratios of 47% to 56%. A footnote says discontinued operations are excluded in 2021 and 2022.
Two-by-three grid of bar charts, the 2026 bar in dark navy and prior years in light blue, each with a CAGR or percentage-point bubble and a rising arrow.
Matrix of segment by region. Regional EBIT: Australia Pacific and Asia $666m (+1%), North America $254m (+20%), Europe, Middle East and Africa $108m (+8%), Latin America $94m (+4%). Segment EBIT: Blasting Solutions $881m (+2%), Digital Solutions $115m (+25%), Specialty Mining Chemicals $126m (+25%). Cells give commentary such as the Nelson Brothers acquisition and Carseland turnaround in North America, Axis and OREPro adoption, and record cyanide production at Yarwun, Deer Park and Winnemucca.
Table with four region columns with globe icons across the top and three segment rows, each cell holding two to three bullets and segment EBIT in the left column.
Blasting Solutions EBIT rose 2% from $868m to $881m. The bridge runs 868, FX on translation (34), 2025 re-based 834, volume, mix and margin +53, manufacturing (6), to 881, a +6% underlying gain. Bullets cite lower Indonesian coal production, the stronger Australian dollar, premium product adoption, contract renewals, the cost reduction program and the Kooragang Island major turnaround planned for 1H2027.
Small two-bar EBIT chart at left, bullets at top right and a waterfall chart across the bottom with broken-axis grey bars for totals and a green +6% badge.
Digital Solutions EBIT grew 25% from $92m to $115m. Revenue grew 12% from $358m to $401m (hardware 243 to 277, software 79 to 89, services 36 to 35) and EBIT margin rose 2.9 pts from 25.8% to 28.7%. Commentary covers Orebody Intelligence (Axis demand), Blast Design and Execution (predictive modelling, blast measurement) and Geosolutions (Series 5 radar uptake).
Three zones: EBIT bar chart at left, stacked revenue and margin bar charts in the middle, and a text column of three product-area headings at right.
Exit annual recurring revenue rose 14% from $227m to $258m. Churn fell 2.1 pts from 5.8% to 3.7%. Blasting customer penetration rose from 35% to 37% and Blast Design and Execution multi-product adoption from 29% to 31%. The right panel lists technology investments: the all-angle gyro, predictive blast design and GeoExplorerIQ. Footnotes define the metrics, including a restated 2025 churn of 3.4% basis.
Three bordered panels: recurring revenue and churn charts at left, cross-sell charts in the middle, and a three-row text table on investment in leading-edge technology at right.
Specialty Mining Chemicals EBIT rose 25% from $101m to $126m. Sodium cyanide volume grew 9% and EBIT margin rose 2.6 pts from 13.5% to 16.1% (+260 bps). Bullets cover record production at Winnemucca, Yarwun and Deer Park, Yarwun Phase 1 expansion with uplift expected in 2028, Winnemucca expansion options, Danafloat early momentum, specialty emulsifiers and the Cyantific technical services portfolio.
EBIT bar chart at left, sodium cyanide volume and margin bars in the centre, and a headline strip with bullets at right.
Section divider introducing the Financial Performance section, presented by James Crough, Chief Financial Officer.
Full-bleed photo of an Orica bulk explosives truck with a navy title panel and circular headshot of the CFO at left.
Table for the year ended 30 September ($m), 2026 vs 2025: sales revenue 8,264 vs 8,145 (+1%; 8,543 constant currency, +5%), EBITDA 1,574 vs 1,491, EBIT 1,057 vs 992 (+7%; 1,101 constant currency, +11%), NPAT pre SI 590 vs 541, individually significant items after tax (325) vs (379), statutory NPAT 264 vs 162 (+63%), net operating cash flow 758 vs 949 (down 20%), ROIC 11.3%, RONA 15.6%, EPS pre SI 126.8c, EPSA 131.0c and DPS 64.0c.
Single full-width financial table with a highlighted 2026 column, change column and up or down arrows, with detailed footnotes below.
Individually significant items for FY2026 total (358.7) gross and (325.5) after tax. Components (gross, net): litigation costs and outcomes (274.6) and (257.1), all in 1H; US supply disruption costs (42.0) and (35.8); restructuring costs (59.8) and (49.3); gain on Nelson Brothers acquisition 17.7 and 16.7, all in 2H. The 1H total is (307.0) gross and 2H (51.7).
Navy-header table with 1H FY2026, 2H FY2026 and FY2026 column groups, each split into gross and net, with a bold total row.
Group EBIT bridge from $992m to $1,057m: FX on translation (39), Blasting Solutions +53, Digital Solutions +25 and Specialty Mining Chemicals +18 (grouped as volume, mix and margin), Manufacturing +5 and Global Support +3.
Waterfall chart with grey start and end bars on broken axes, a dashed box around the three segment steps labelled Volume, Mix and Margin.
Net operating cash flow bridge ($m): 2025 operating cash flow 949, plus 2025 significant items cash flow 59 gives 2025 underlying 1,008; then EBITDA +83, interest and tax +33, trade and non-trade working capital and other (22) gives 2026 underlying operating cash flow 1,102; less 2026 significant items cash flow (344) leaves 2026 operating cash flow of 758.
Nine-column waterfall with grey subtotal bars, light blue increases and navy decreases; one footnote at the bottom.
Trade working capital moved from $620m at 30 Sep 2025 to $612m at 30 Sep 2026: foreign exchange (31), Nelson Brothers acquisition +61, underlying decrease (38). Total cycle days improved 64, 60, 60, 57 over 2023 to 2026 and TWC to sales fell 8.1%, 7.9%, 7.6%, 7.4%.
Waterfall chart at left and two stacked line charts with dot markers at right for cycle days and TWC to sales.
Capital expenditure was $509m in 2026 (2025: $460m): sustenance 301 (286), growth 163 (172), sustainability 23 (2) and acquisitions 22. Bullets cover Winnemucca safety upgrades, the Carseland turnaround, Digital Solutions hardware, Yarwun infrastructure for the Alpha HPA partnership, Yarwun cyanide phase 1 expansion, the Hunter Valley Hydrogen Hub and the Danafloat and Nelson Brothers acquisitions.
Left text list under five category headings; right a two-column stacked bar chart with a legend of four capex categories.
Average debt tenor at September 2026 is 4.1 years (drawn debt 4.7 years), with maturities from 2027 to 2037 across bank facilities, US private placement, an Asian term loan and a CEFC loan. Available liquidity was $2,329m in 2026 (cash $762m plus undrawn facilities $1,567m) versus $2,367m in 2025 and $1,973m in 2024. Net debt was $2,146m (2025: $1,922m; 2024: $1,618m) with leverage of 1.46x (1.39x; 1.43x).
Left stacked bar chart of the maturity profile by year; right two charts for liquidity and net debt with leverage dots; footnotes define net debt and leverage.
Three workstreams: structural and overhead reductions (Global Business Services hub, simplified operating model, footprint rationalisation), operating margin and cost-to-serve improvements (network optimisation, freight, internal AN production) and procurement initiatives (new suppliers, contract optimisation, AN multi-sourcing). A banner states the program is on track to deliver at least $100 million by the end of 2027, with exit rate more than 2x program costs.
Three navy header cards with icons over three bullet columns, and a full-width navy banner with the headline target at the bottom.
Full year dividend rose 12.3% to 64.0 cents (interim 28.5c, final 35.5c). Payout ratio policy is unchanged at 40% to 70%. Prior years: 24.0c (2021), 35.0c, 43.0c, 47.0c and 57.0c (2025), with payout ratios of 47%, 48%, 53%, 56%, 50% and 50%. Dividends are typically weighted to the final payment.
Four bullets at left; right a stacked column chart of interim and final dividends per year with totals above and payout ratio in orange.
Section divider for the refreshed strategy led by the CEO. A faded strategy wheel shows purpose (mobilise critical resources for a better future) and vision (build long-term value as customers' preferred partner), four strategic levers, three core businesses and four people enablers, under the line 'We have the right strategy to deliver continued growth'.
Navy title panel at left with CEO headshot over a darkened photo background, with a double-ring strategy diagram on the right.
EBIT excluding Global Support grew from $494m in 2021 to $1,122m in 2026, with FY23-26 CAGR of 35% for Specialty Mining Chemicals, 29% for Digital and 10% for Blasting. Blasting's share of EBIT fell from 89% to 79%, Digital rose from 6% to 10% and SMC from none shown to 11%. Revenue by commodity (excluding digital): gold 22% to 27%, copper 19% to 20%, thermal coal 17% to 15%. Acquisitions shown include Hopper, Axis, Cyanco, RIG, Terra Insights, Danafloat and Nelson Brothers.
Three panels under chevron headers: stacked EBIT columns, two donut charts for 2021 and 2026, and two stacked commodity columns, with acquired company logos beneath the donuts.
Scorecard of five 2021 assumptions: copper and gold outlook, digital and technology adoption, earnings diversification and targeted acquisitions are all ticked as correct. Energy transition scenario is marked as incorrect: the 2021 prediction was peak thermal coal by 2025, while the answer today is modest thermal coal demand growth under a delayed energy transition.
Three-column table (assumption, 2021 prediction, answer today) with green tick boxes for four rows and a red cross for the last row.
Megatrends: accelerating commodity demand, stagnating mining productivity (about 1% CAGR since 2018) and energy security. Charts: global material moved 87, 88, 90 Bt for 2026 to 2028 (2% CAGR); global exploration budget $7B, $8B, $12B for 2016, 2020, 2025 (6% CAGR); mined gold supply 117, 124, 127 Moz (4% CAGR); global copper consumption 35, 36, 37 Mt (3% CAGR). Sources include Wood Mackenzie and S&P Global.
Left column of three icon-led megatrends and a two-by-two grid of simple bar charts with CAGR bubbles and arrows at right.
Three customer pressures: return on assets (lower grades, higher strip ratios, rising costs), security of supply (labour shortages, supply chain shocks, permitting delays) and environmental and social responsibility. Orica's solutions span the value chain (orebody intelligence, design and model, blast implementation, measure and monitor, ore processing) and reach 100+ countries, mapped to Blasting Solutions, Specialty Mining Chemicals and Digital Solutions.
Three rounded navy cards at top, then a chevron process flow of five stages with horizontal bars showing which business covers which stages.
Strategy framework: purpose to mobilise critical resources for a better future, vision to build long-term value as the customers' preferred partner. Four levers: reliable execution, integrated portfolio, global network, data-led insights and technology. Implemented through Blasting, Digital and Specialty Mining Chemicals, and delivered by people through skills and capabilities, safe and inclusive, careers and culture, and empowerment and adaptation.
Layered stack of rows with navy labels at left and light blue cards at right, each with an icon and one-line description.
Section divider introducing the Outlook section, presented by Sanjeev Gandhi, Managing Director and CEO.
Full-bleed photo of an operator at a bank of monitors showing blast design software, with a navy title panel and headshot at left.
FY2027 outlook: earnings growth expected in all three segments, with Blasting offset by lower Indonesian thermal coal demand and major turnarounds at Kooragang Island (1H) and Yarwun (2H), and Specialty Mining Chemicals partly offset by Winnemucca (1H) and Yarwun (2H) turnarounds. Capex $470m to $500m excluding about $130m for the Hunter Valley Hydrogen Hub (net of grants), D&A $535m to $555m, net finance costs about $25m to $35m higher, effective tax rate slightly lower. Beyond 2027: GDP-plus growth for Blasting, mid-teen for Digital and high-single-digit for Specialty Mining Chemicals.
Two framed boxes with coloured headers: a large Outlook box of segment bullets and guidance lines, and a Beyond 2027 box beneath; footnotes refer to the disclaimer.
Closing section divider repeating the strategy wheel with the line 'We have the right strategy to deliver continued growth'.
Navy panel with the word Closing at left over a darkened photo, with the strategy diagram on the right.
Five closing messages: strong earnings and underlying cash conversion with rising returns on invested capital; resilient performance underpinned by the global network despite geopolitical disruption and third-party supply outages; disciplined capital deployment including acquisitions and plant expansion; strategy reaffirmed with a positive outlook; strong balance sheet providing flexibility to invest and maximise shareholder returns over time.
A numbered fan of five coloured segments at left linked to five white rounded message boxes with icons, over a mine pit photograph.
Section divider introducing the appendix material that follows.
Photo of workers in hi-vis gear in front of stacked shipping containers, with a navy title panel at left.
Company profile: one of the world's leading mining and infrastructure solutions providers with three franchises (Blasting Solutions, Digital Solutions, Specialty Mining Chemicals). Key facts: 150+ years of innovation, more than 14,000 people, customers in 100+ countries, S&P ASX 100 member (ASX:ORI), and 2026 revenue of A$8.3bn and EBIT of A$1,057m. Competitive advantages include market-leading innovation, a vertically integrated global network, reliable execution and the largest global presence.
Central world map with colour-coded site markers and a legend (head office, regional head office, monitoring centre, technology centre, manufacturing plants), flanked by grey text columns and a bottom row of five blue stat boxes.
Indicative 2027 and 2028 turnaround schedule by half year. Blasting (ammonium nitrate): Kooragang Island NSW in 1H2027 and 2H2028, Yarwun QLD in 2H2027 and 2H2028, Burrup WA in 2H2028, Bontang Indonesia in 1H2028, and none shown for Carseland Canada. Cyanide: Winnemucca USA 1H2027 (large) and 1H2028 (small), Alvin USA 2H2027 and 2H2028 (small), Yarwun QLD 2H2027 (large). Larger icons mean 4 weeks or more, smaller icons 2 to 4 weeks.
Gantt-style grid with half-year columns and plant rows, shaded by Blasting and Specialty Mining Chemicals, with factory icons marking events.
Reconciliation for 2022 to 2026. RONA pre-tax: 11.4%, 12.6%, 12.8%, 13.8%, 15.6%. Pre-tax to post-tax conversion: (4.2%), (4.3%), (4.2%), (4.2%), (4.7%). Other impacts: 0.2%, 0.4%, 0.1%, 0.2%, 0.4%. ROIC post-tax: 7.4%, 8.7%, 8.7%, 9.8%, 11.3%. Footnotes define both measures.
Compact four-row table with navy header and five year columns, definitions in small print below.
Scorecard for 2021 to 2026. Strategic execution items are mostly completed and ongoing (green), with optimising manufacturing and supply chains shown as progressing and on track. Financial performance: 21% earnings CAGR, RONA up 7.5 points, total dividends of $1.2 billion at a 40% to 70% payout ratio and $500 million of surplus capital returned, all green. Safety and sustainability: achieving zero fatalities is marked below target (red), serious injury case rate and net Scope 1 and 2 emissions are green.
Two columns of criteria rows with status dots in shaded cells, grouped under strategic execution, financial performance and safety and sustainability, with a four-colour legend.
Net debt excluding leases moved from $1,922m at 30 Sep 2025 through net operating cashflows (758), net investing cashflows +576 and net financing cashflows +531 to a sub-total of $2,271m, then foreign exchange translation (125) to $2,146m at 30 Sep 2026.
Single waterfall chart with grey totals and blue and navy movement bars, one footnote.
Orica trades in 35 currencies translated to Australian dollar earnings. Average rates 2026 vs 2025 and spot rates at 30 Sep 2026 vs 2025 are listed for USD (0.6919 vs 0.6437; spot 0.6986 vs 0.6577), CAD, KZT, BRL, EUR, MXN and PHP. A A$0.01 move in AUD/USD is about A$5 million of annualised EBIT translation impact and in AUD/CAD about A$1 million.
Table with two shaded blocks of columns for average and spot rates, and a sensitivity note beneath.
Reconciles statutory NPAT of $264.2m (2025: $162.3m) plus individually significant items after tax of $325.5m ($378.8m) to NPAT pre-significant items of $589.7m ($541.1m). Adding net financing costs 214.4, income tax expense 230.8 and non-controlling interests 22.0 gives EBIT of $1,056.9m ($992.2m); adding depreciation and amortisation of 516.8 gives EBITDA of $1,573.7m ($1,491.1m).
Navy-header reconciliation table with highlighted 2026 column, bold subtotal rows and a change column.
Glossary of terms used in the deck, including AN, ARR, CAGR, capital expenditure, churn rate, DIH, DPO, DSO, EBIT, EBITDA, EPS, EPSA, FFC, leverage, net debt, NPAT, NPATA, payout ratio, ROIC, RONA, Scope 1, 2 and 3 emissions, SICR, sustenance capital, total cycle days and trade working capital. Text is small but legible.
Two-column table of terms and definitions with a navy header row and tinted term column.
Closing slide with the Orica logo and an investor relations contact block naming the Vice President of Investor Relations with phone and email details.
Navy background with a ring-shaped photo collage at left (electric vehicle charging, technician, software screen, port, worker), a thin vertical divider and the logo and contact text at right.
คำถามทั่วไปเกี่ยวกับสไลด์นี้และเนื้อหาการนำเสนอพื้นฐาน
It is the English-language "2026 Full Year Results" investor presentation from Orica, lodged with the ASX on 12 November 2026 and presented by CEO Sanjeev Gandhi and CFO James Crough. Amounts are in A$ (Australian dollars) unless a slide says otherwise.
The tables are headed 'Full year ended 30 September', so FY2026 is the year ended 30 September 2026 and FY2025 is the year ended 30 September 2025. The deck also splits significant items into 1H FY2026 and 2H FY2026.
EBIT of $1,057m (2025: $992m), EBIT margin of 12.8%, NPAT pre significant items of $590m, EPS pre SI of 126.8 cps, a total dividend of 64.0 cps, ROIC of 11.3%, RONA of 15.6% and leverage of 1.46x. Statutory NPAT was $264m after $325.5m of individually significant items.
Three: Blasting Solutions (EBIT $881m), Digital Solutions (EBIT $115m, revenue $401m) and Specialty Mining Chemicals (EBIT $126m). Each has its own slide with an EBIT chart and commentary, and slide 7 compares them across four regions.
Slide 29 expects earnings growth in each segment, capex of $470m to $500m excluding about $130m for the Hunter Valley Hydrogen Hub, depreciation and amortisation of $535m to $555m, net finance costs about $25m to $35m higher, and a slightly lower effective tax rate. It is forward-looking and subject to market and operating conditions.
Yes. The appendix includes a non-IFRS reconciliation from statutory NPAT to EBIT and EBITDA (slide 39), a RONA to ROIC reconciliation (slide 35) and a glossary of terms (slide 40). The disclaimer notes that non-IFRS information has not been audited.
Yes. It shows a typical sequence: cover, disclaimer, year in review, financial performance, strategy, outlook, closing and appendix, using KPI tiles, waterfall bridges, stacked bars, scorecards and reconciliation tables. Treat it as a structural reference only.
Slide 4 reports one fatality in 2026 (2025: zero), a SICR of 0.094 and zero significant environmental incidents. It marks the 30% net Scope 1 and 2 reduction target as achieved at 35% and others as on track, with a net zero ambition by 2050.

Create Your Own Slides
Turn your ideas into professional presentations in seconds with 2slides AI.
อ้างอิงการออกแบบมืออาชีพ เลือกสไตล์ของคุณ และสร้างสไลด์ด้วยการแสดงผลข้อความที่สมบูรณ์แบบ ขับเคลื่อนโดย Nano Banana—เริ่มสร้างการนำเสนอของคุณตอนนี้
เอเจนต์ AI ของคุณสำหรับสไลด์ ประหยัดเวลา เปล่งประกายเร็วขึ้นด้วยการสร้างงานนำเสนออัจฉริยะ


© 2026 2slides สงวนลิขสิทธิ์