
Mondelez Q2 2026 Earnings Presentation
การนำทางด่วน
แท็ก
แชร์สไลด์
Mondelez Q2 2026 Earnings Presentation
มุมมองรายละเอียดของแต่ละหน้าสไลด์ รวมถึงlayout เนื้อหาหลักและองค์ประกอบภาพ
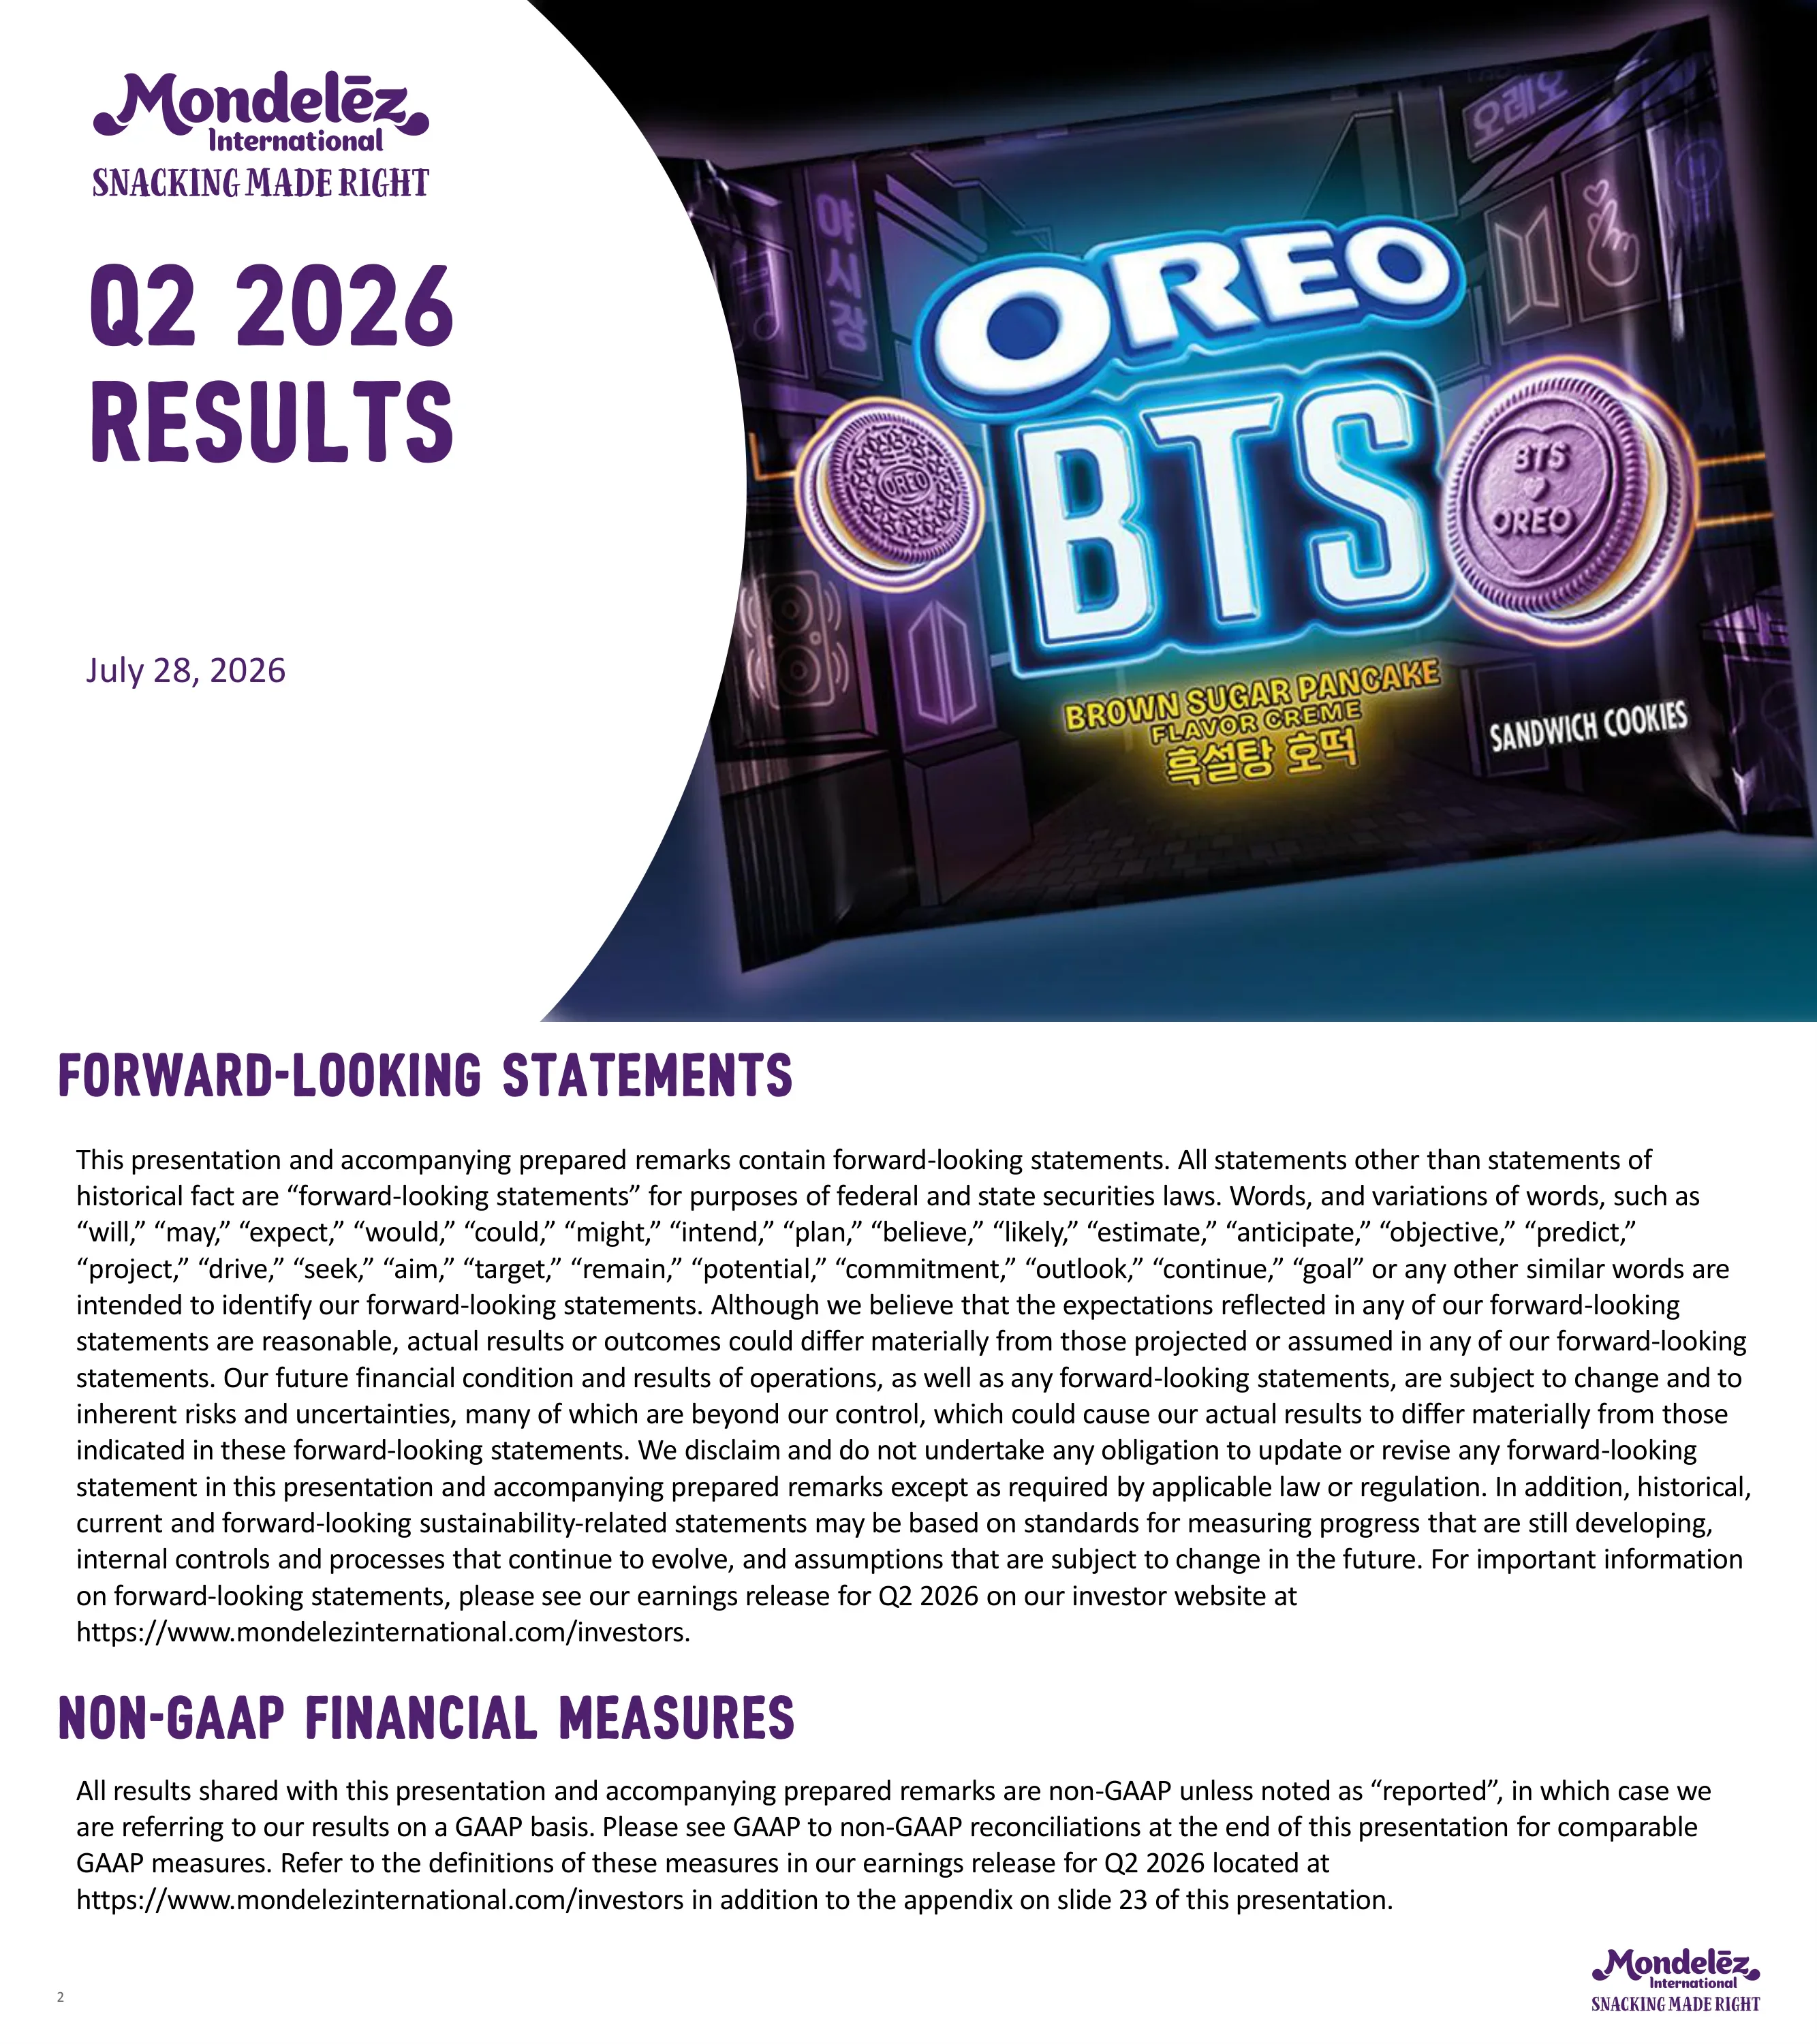
Title slide announcing Mondelēz International Q2 2026 Results, dated July 28, 2026, with the 'Snacking Made Right' tagline.
Split cover: white left panel with a curved edge holding the purple Mondelēz logo, large condensed purple title and date; right two-thirds is a full-bleed product photo.
Legal disclaimer covering forward-looking statements and noting that all results are non-GAAP unless labeled 'reported', with reconciliations at the end and definitions in the slide 23 appendix.
Two stacked text sections, each with a purple condensed uppercase heading followed by a dense justified paragraph on white; logo bottom right.
Three-part agenda: 1 Business & Strategy Update (highlighted), 2 Financial Results, 3 2026 Outlook.
Left-aligned numbered list with orange circle numerals (active item filled orange with bold black text, others outlined with grey text); circular purpose badge top right.
Six numbered highlights: Q2 top-line +2.2% with vol/mix +0.7pp (~+1.2pp ex. downsizing), strong performance in three regions, Q2 EPS $0.73 (-2.7% at cst fx), $1.5B returned to shareholders YTD plus a +4% dividend increase, playbook execution, and FY top-line outlook raised to at least +2%.
Numbered list with bold lead-in phrases occupying the left 75%; right edge has three stacked circular product-photo crops.
KPI grid: Q2 2026 organic net revenue +2.2%, adjusted gross profit +3.0%, adjusted OI -6.1%, adjusted EPS -2.7%; YTD organic revenue +2.6% (vol/mix +0.1pp, price +2.5pp), gross profit -1.2%, OI -12.8%, EPS -8.8%, free cash flow $0.7B.
5-column by 2-row KPI table: colored brush-edged header tabs (purple, blue, green, orange, brown) over pale tinted cells; row labels Q2 2026 and YTD 2026 in large purple type on the left.
Consumer and category commentary for North America (biscuit category flat, MDLZ gaining share; strong Snack Bars growth), Europe (confidence subdued, solid Biscuits growth, chocolate volume declines moderating) and Emerging Markets (confidence resilient, biscuit accelerating, sustained chocolate growth).
3x2 matrix: region label blocks with arrow connectors on the left (orange, blue, green), two purple brush-stroke column headers 'Consumer' and 'Categories', and tinted bullet boxes matching each region color.
Five strategic playbook priorities: drive consumer value and unlock new occasions, expand in channels and numerical distribution, step up big bold innovation launches, invest behind brands and capabilities, continue productivity and cost savings.
Five stacked arrow banners of varying length (purple, green, blue, orange, red), each starting with a white check-mark circle; large circular photo on the right.
Agenda divider with section 2, Financial Results, highlighted.
Same agenda layout as page 3, with the second orange circle filled and its label in bold black.
Organic net revenue growth: total Mondelēz +2.2% in Q2 (vol/mix +0.7%) and +2.6% YTD; Emerging Markets (40% of revenue) +4.4% Q2 / +5.3% YTD; Developed Markets (60%) +0.7% Q2 / +0.8% YTD with vol/mix flat and -0.5%.
3-column by 2-row grid of organic blob shapes (purple, blue, orange) each with a lighter overlapping vol/mix bubble; the total column sits in a pale grey highlight panel.
Category organic growth: Biscuits & Baked Snacks (48% of revenue) +2.5% Q2 / +2.1% YTD; Chocolate (33%) -0.1% Q2 with vol/mix -1.6%, +2.9% YTD; Gum & Candy (10%) +7.6% Q2 with vol/mix +4.3%, +5.3% YTD.
Same blob grid as page 9 in category colors: gold for biscuits, green for chocolate, brown for gum & candy, with pale vol/mix bubbles.
YTD 2026 category value growth: Biscuits & Baked Snacks 0.7%, Chocolate 3.2%, Gum & Candy 4.2%, Total Snacks 1.9%; share of snacks revenue gaining or holding share rose from ~40% in 2025 to ~65% YTD 2026.
Two column bar charts separated by a hand-drawn vertical line: left four-bar chart in category colors, right two-bar comparison (grey 2025 vs purple YTD 2026); long data-source footnote.
Q2 2026 organic revenue and adjusted OI growth by region: Mondelēz +2.2% / -6.1%, Europe -3.5% / -22.9%, North America +3.4% / +4.3%, AMEA +7.1% / -0.4%, Latin America +8.4% / +18.4%, with vol/mix from -2.1pp (Europe) to +5.2pp (AMEA).
Row-label panel on the left (purple Q2 2026 tab, 'Revenue Growth' and 'OI Growth') and five region columns of blob badges: purple for total, blue for regions, with light vol/mix bubbles.
Adjusted gross profit bridge from $3.0B (Q2 2025) to $3.1B at constant FX (+3.0%) and $3.2B reported (+4.9%); adjusted OI bridge from $1.3B to $1.2B (-6.1% cst fx, -4.8% rpt fx) as SG&A/other rose by double digits. YTD: gross profit $6.3B (+2.1%), OI $2.4B (-9.5%).
Two side-by-side waterfall charts divided by a vertical line; light purple start bars, dark purple end bars with axis-break marks, green/red step bars, orange oval growth callouts, and a dashed-line YTD summary row with a purple arrow tag.
Adjusted EPS bridge: Q2 2025 $0.73, operations $(0.04), shares $0, interest/other $(0.01), taxes +$0.03, giving $0.71 at constant FX (-2.7%), plus forex +$0.02 to $0.73 reported (flat). YTD EPS fell from $1.47 to $1.40 (-4.8%), or $1.34 at cst fx (-8.8%).
Single wide eight-step waterfall with red negative and green positive floating bars, purple totals with orange oval callouts, and a YTD values row under a dashed divider.
Free cash flow $0.7B YTD with cash conversion cycle of -34 days; share repurchases $0.2B YTD at a $60.69 average price; dividends $1.3B YTD with a +4% dividend increase announced.
Three stacked colored circles (purple, blue, gold) labeled Free Cash Flow, Share Repurchases and Dividends, each paired with two bullet lines to the right, centered on white.
Agenda divider with section 3, 2026 Outlook, highlighted.
Same agenda layout as pages 3 and 8, third circle filled orange.
FY26 outlook: organic net revenue growth at least +2%, adjusted EPS growth flat to +5% at cst fx, free cash flow ~$3B, against a long-term algorithm of 3-5%, +HSD% and $3B+. Planning assumptions: inflation ~LSD% of COGS, adjusted interest ~$375M, tax rate mid 20s, buybacks up to $2B, forex ~+2.0pp on revenue and +$0.05 on EPS.
Upper grey panel with a vertical purple 'FY26 Outlook' tab and three purple value boxes, plus an orange 'LT Algo' row; below a dashed line, a vertical grey 'FY26 Planning Assumptions' tab with five dark grey value boxes.
Summary of robust H1 top-line growth with positive vol/mix, broad-based Emerging Markets growth, improving Developed Markets (North America momentum, Europe stabilizing in chocolate), share gains, the raised FY26 top-line outlook with EPS and FCF unchanged, and an expectation of strong 2027 EPS growth.
Three-level bulleted list with bold top-level points on the left; three circular product crops stacked on the right edge.
Presenters: Dirk Van de Put (Chairman & CEO), Luca Zaramella (COO) and Amit Banati (CFO).
Three equal cards with hand-drawn purple outlines, each holding a cut-out headshot, bold name and title, centered on white.
Full-page brand slide with the white Mondelēz International logo and 'Snacking Made Right' tagline, separating the main presentation from the appendix.
Solid purple full-bleed background with a centered white logo and tagline.
FX table comparing 2025 average rates with July 17, 2026 spot rates for nine currencies, e.g. Argentine peso 1224.29 to 1480.59 per US$, Brazilian real 5.59 to 5.11, Indian rupee 87.17 to 96.31, Mexican peso 19.21 to 17.51, euro US$1.13 to US$1.14; source XE.com.
Four-column table: purple brush-shaped row labels with national flags, two rate columns, and a red-down/green-up arrow impact column; thin grey row rules.
Explains that FY26 organic revenue growth, cst-fx adjusted EPS growth, adjusted interest expense, adjusted tax rate and free cash flow are non-GAAP and why forward-looking reconciliations are not provided.
Purple heading with a single full-width justified text block filling the upper half; remainder white.
Definitions of Adjusted SG&A, Adjusted Interest Expense and Adjusted Effective Tax Rate, with a link to the Q2 2026 earnings release for other measures.
Purple heading followed by four text paragraphs, the last containing an underlined hyperlink.
Regional revenue reconciliation: Q2 2026 reported net revenue $9,355M ($9,172M organic) vs $8,984M in Q2 2025, reported +4.1% and organic +2.2%; six-month reported $19,435M, organic +2.6%. Also shows Emerging Markets ($3,909M Q2) and Developed Markets ($5,446M Q2).
Financial table with seven columns (Latin America, AMEA, Europe, North America, Mondelēz, Emerging Markets, Developed Markets) split by a vertical rule; three-month and six-month blocks separated by a dashed line.
Category revenue reconciliation: Q2 2026 reported Biscuits & Baked Snacks $4,735M, Chocolate $2,721M, Gum & Candy $1,067M, Total Snacks $8,523M, Beverages $226M, Meals $606M; organic growth 2.5%, (0.1)%, 7.6%, 2.3%, (0.9)% and 2.6%.
Boxed table grouping the four snack columns and the Mondelēz total column, with Beverages and Meals between; three-month and six-month blocks separated by a dashed line.
Q2 2026 reported gross profit $3,986M adjusted to $3,182M ($3,124M cst fx, +3.0%); reported operating income $1,946M adjusted to $1,222M ($1,205M cst fx, -6.1%), mainly after removing an $827M mark-to-market derivative gain. Adjusted OI margin 13.1% (-1.2pp), with Q2 2025 comparisons below.
Wide table with a gross profit column and nine operating income columns (four regions, hedging, corporate, amortization, other, total); two stacked period blocks including margin rows.
H1 2026 reported gross profit $6,789M adjusted to $6,273M ($6,065M cst fx, -1.2%); reported OI $2,754M adjusted to $2,404M ($2,318M cst fx, -12.8%); adjusted OI margin 12.4% (-2.1pp), versus H1 2025 adjusted OI of $2,657M.
Same wide two-block table structure as page 26 covering the six-month periods of 2026 and 2025.
Q2 2026 reported diluted EPS $1.20 (+144.9%) adjusted to $0.73 (0.0%) and $0.71 at cst fx (-2.7%); six-month reported $1.64 adjusted to $1.40 (-4.8%), $1.34 at cst fx (-8.8%). Prior-year adjusted EPS was $0.73 (Q2) and $1.47 (H1).
Narrow centered two-column table (three months, six months) in two stacked blocks for 2026 and 2025.
H1 2026 net cash from operating activities $1,322M less capital expenditures $654M equals free cash flow $668M, versus $818M in H1 2025 (a $150M decrease).
Small three-column table (2026, 2025, $ change) placed at the top of an otherwise white slide.
คำถามทั่วไปเกี่ยวกับสไลด์นี้และเนื้อหาการนำเสนอพื้นฐาน
The 29-slide deck, dated July 28, 2026, covers a business and strategy update, Q2 and year-to-date financial results, the FY2026 outlook, closing comments and the leadership team. The appendix holds an FX rate table, non-GAAP definitions and six GAAP to non-GAAP reconciliation tables.
Q2 2026 organic net revenue grew +2.2% (vol/mix +0.7pp, price +1.5pp). Adjusted gross profit rose +3.0% and adjusted operating income fell -6.1% at constant FX. Adjusted EPS was $0.73, down 2.7% at constant FX. Year to date, free cash flow was $0.7B and $1.5B was returned to shareholders, and a +4% dividend increase was announced.
Slide 17 raises FY26 organic net revenue growth guidance to at least +2%. Adjusted EPS growth stays at flat to +5% at constant FX and free cash flow at about $3B. Planning assumptions include adjusted interest expense of about $375M, a mid-20s adjusted tax rate, share repurchases of up to $2B, and a forex benefit of about +2.0pp to revenue and +$0.05 to EPS.
It follows a classic earnings-call flow: cover, disclaimer, a three-item agenda that is repeated as section dividers, an executive summary, a KPI grid, market and category breakdowns, profit and EPS waterfalls, capital allocation, guidance, closing comments, speakers, then the appendix. This order works for most quarterly results presentations.
The deck pairs a disciplined color code (purple for the total company, blue and orange for markets, gold, green and brown for categories) with a playful hand-drawn look: blob-shaped number badges, brush-stroke headers and circular product-photo crops. Action-sentence titles carry the story. Q2 and YTD figures sit in parallel rows so readers can compare periods quickly.
There is a color-coded KPI table, blob-badge grids for regions and categories, vertical bar charts for category growth and share, three waterfall bridges (gross profit, operating income, EPS), a stacked-box guidance layout, an FX table with arrow indicators, and dense financial reconciliation tables.
Yes. The gallery page offers the original PDF and an editable PPTX. The PPTX is machine-converted from the PDF, so some text boxes, charts and tables may need manual touch-ups before you reuse them as a template.
Mondelēz International published it on its investor relations site to accompany its Q2 2026 results. The deck's reported figures are non-GAAP unless labeled 'reported', with reconciliations in the appendix. This page describes the content and is not investment advice.
Official investor relations site where the Q2 2026 results presentation (July 28, 2026) and earnings release are published.

Create Your Own Slides
Turn your ideas into professional presentations in seconds with 2slides AI.
อ้างอิงการออกแบบมืออาชีพ เลือกสไตล์ของคุณ และสร้างสไลด์ด้วยการแสดงผลข้อความที่สมบูรณ์แบบ ขับเคลื่อนโดย Nano Banana—เริ่มสร้างการนำเสนอของคุณตอนนี้
Your AI Agent for slides. Save time, shine faster with intelligent presentation creation.




© 2026 2slides. All rights reserved.