
อยู่ในคอลเลกชัน ตัวอย่างงานนำเสนอสำหรับนักลงทุน · ตัวอย่างพรีเซนเทชันนักลงทุนญี่ปุ่น
Mitsubishi Electric H1 FY2026 Earnings Presentation — first-half results for the fiscal year ending March 2027 (Q2 FY2026, released October 30, 2026), with record first-half revenue of ¥3,125.1 billion (¥31,251 hundred million / 億円), adjusted operating profit of ¥344.7 billion (11.0% margin), segment and regional breakdowns, and a raised full-year forecast of ¥6.55 trillion revenue and ¥710 billion adjusted operating profit. This is a Japanese-language deck (2027年3月期 第2四半期 決算説明会資料) originally published on TDnet, the Tokyo Stock Exchange's Timely Disclosure network.
ใช้หน้าปกของงานนำเสนอนี้เป็นต้นแบบสไตล์สำหรับสไลด์ที่สร้างจากเนื้อหาของคุณเอง หรือเลือกหน้าใดก็ได้ด้านล่างเพื่อใช้เลย์เอาต์ของหน้านั้นเป็นต้นแบบ
การนำทางด่วน
แท็ก
แชร์สไลด์
Mitsubishi Electric H1 FY2026 Earnings Presentation — first-half results for the fiscal year ending March 2027 (Q2 FY2026, released October 30, 2026), with record first-half revenue of ¥3,125.1 billion (¥31,251 hundred million / 億円), adjusted operating profit of ¥344.7 billion (11.0% margin), segment and regional breakdowns, and a raised full-year forecast of ¥6.55 trillion revenue and ¥710 billion adjusted operating profit. This is a Japanese-language deck (2027年3月期 第2四半期 決算説明会資料) originally published on TDnet, the Tokyo Stock Exchange's Timely Disclosure network.
มุมมองรายละเอียดของแต่ละหน้าสไลด์ รวมถึงlayout เนื้อหาหลักและองค์ประกอบภาพ
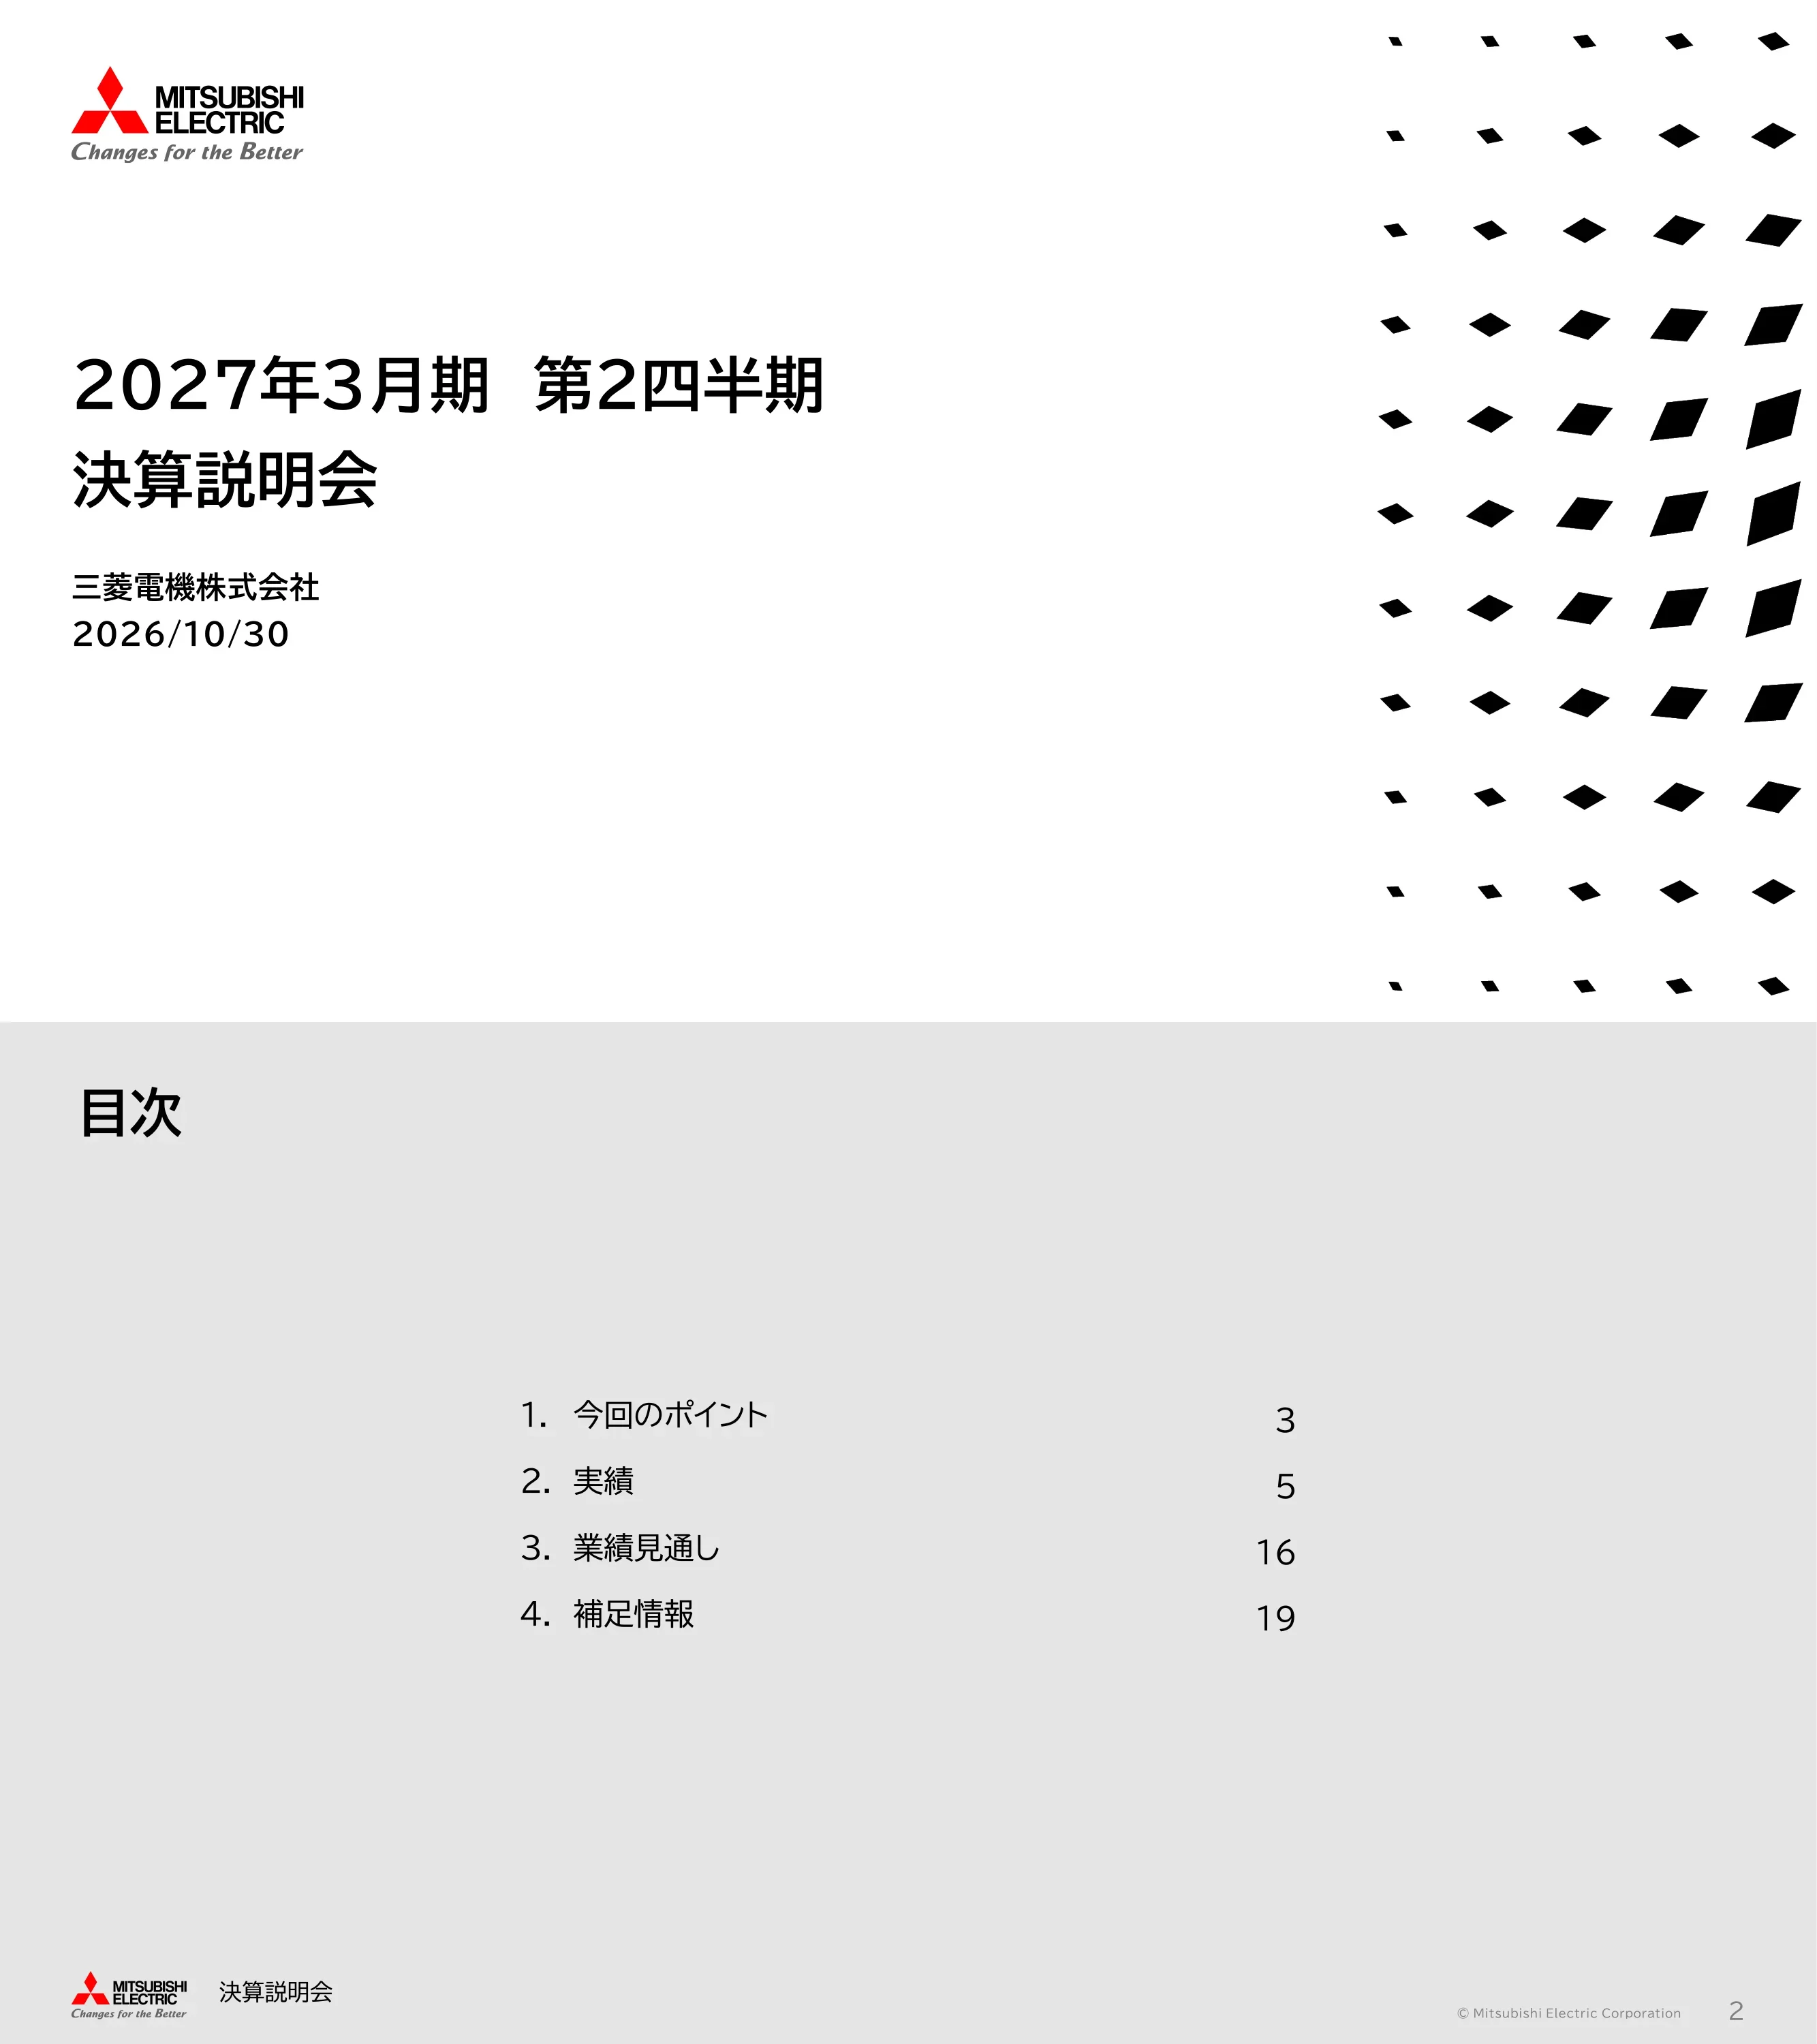
Title slide reading '2027年3月期 第2四半期 決算説明会' (Earnings Briefing for the Second Quarter of the Fiscal Year Ending March 2027), Mitsubishi Electric Corporation, dated October 30, 2026.
Left-aligned title block with corporate logo top-left and a field of black rhombus shapes forming a gradient pattern on the right third
Four sections with page references: 1. Key Points (p.3), 2. Results (p.5), 3. Earnings Forecast (p.16), 4. Supplementary Information (p.19).
Light grey background, title top-left, centered numbered list with right-aligned page numbers
Section divider introducing '今回のポイント' (Key Points of This Briefing).
Large section number '1' top-left, section title mid-left, rhombus wave pattern across the top-right
H1 FY2026 revenue was ¥3,125.1 billion (+¥392.6 billion YoY) and adjusted operating profit ¥344.7 billion (+¥140.2 billion), both record highs for a first half, driven by strong demand in data centers, semiconductors, defense and air conditioning plus profitability and efficiency improvements. The full-year forecast is raised to revenue ¥6.55 trillion (+¥280 billion vs. prior outlook) and adjusted operating profit ¥710 billion (+¥90 billion), reflecting growth in FA systems, air conditioning & home appliances and infrastructure and better margins in Semiconductor & Device. Topics: portfolio transformation including deconsolidation of the automotive equipment business and the FA systems power distribution control equipment business, and making PCI Energy Solutions a wholly owned subsidiary; a share buyback of up to ¥200 billion, implying a 69% total payout ratio; interim dividend of ¥30 per share (+¥5 YoY) with a ¥30 year-end dividend planned. A footnote defines adjusted operating profit as operating profit excluding 'other income/loss' such as gains on business/asset sales and impairment losses.
Text-dense summary slide with two bold headline statements and bullets under 'Key Points', followed by a 'Topics' heading with two further headline-plus-bullet blocks
Section divider introducing '実績' (Results).
Section number '2' top-left with title mid-left and rhombus wave graphic top-right
In ¥100 million (億円): revenue 31,251 vs. 27,325 (+3,926, 114%); adjusted operating profit 3,447 vs. 2,045 (+1,402, 169%); adjusted operating margin 11.0% vs. 7.5% (+3.5pt); profit before income taxes 4,035 vs. 2,539 (+1,495, 159%); net profit attributable to owners of the parent 2,970 vs. 1,893 (+1,076, 157%). Average FX rates: USD ¥160 (prior ¥146), EUR ¥185 (¥169), CNY ¥23.6 (¥20.3).
Five-row comparison table with prior-year, current-period (red header) and YoY columns; FX rates listed beneath
Three-month Q2 figures in ¥100 million: revenue 16,284 vs. 14,196 (+2,088, 115%); adjusted operating profit 2,026 vs. 1,107 (+919, 183%); adjusted operating margin 12.4% vs. 7.8% (+4.6pt); profit before income taxes 2,486 vs. 1,298 (+1,187, 192%); net profit attributable to owners of the parent 1,888 vs. 984 (+903, 192%).
Same five-row comparison table format as the H1 slide
Revenue rose from 27,325 to 31,251 (¥100 million): +1,370 from FX and +2,556 from volume and other effects, led by FA systems, air conditioning & home appliances and defense & space systems. Adjusted operating profit rose from 2,045 to 3,447: +410 from FX and +992 from volume and other, comprising business volume growth about +860, price improvement about +380, the 'Next Stage' program effect about +220, offset by procurement costs (materials and components) about -470. A footnote links to the company's press release on the Next Stage support program special measures.
Two stacked horizontal waterfall charts (revenue on top, adjusted operating profit below) with callout annotations explaining the volume bucket
Balance sheet (¥100 million, prior year-end vs. period-end): total assets 73,695 → 73,856 (+160); cash and equivalents 7,316 → 9,564 (+2,248); trade receivables and contract assets 17,544 → 16,712 (-832); inventories 12,621 → 12,982 (+361); total liabilities 27,395 → 25,532 (-1,863); bonds, borrowings and lease liabilities 3,632 → 3,388 (-244); D/E ratio 0.08 → 0.07; total equity 46,299 → 48,323 (+2,023); equity attributable to owners 44,842 → 46,959; equity ratio 60.8% → 63.6% (+2.8pt). Cash flow: operating CF 5,356 vs. 3,447 (+1,909); investing CF -1,722 vs. -467; free cash flow 3,633 vs. 2,979 (+654). Note: provisional accounting for Nozomi Networks, Inc. (acquired January 28, 2026) was finalized and FY2025 figures were retrospectively revised.
Two stacked tables — balance sheet on top, cash flow summary below — with red current-period headers and a two-line footnote
Revenue bridge from 27,325 to 31,251 (¥100 million): Infrastructure +959, Industry & Mobility +1,168, Life +1,431, Digital Innovation +101, Semiconductor & Device +195, Others +555, eliminations -487. Adjusted operating profit bridge from 2,045 to 3,447: Infrastructure +201, Industry & Mobility +698, Life +486, Digital Innovation -40, Semiconductor & Device +89, Others +52, eliminations -86.
Two stacked segment waterfall charts with nine columns each and labels beneath
Infrastructure revenue ¥678.3 billion, adjusted operating profit ¥60.5 billion, margin 8.9%. Public Utility Systems: H1 revenue 2,330 (prior 2,207), adjusted OP 142 (6.1%) vs. 181 (8.2%); orders rose on large overseas UPS projects and domestic transportation, but profit fell due to a one-time gain in the prior year. Energy Systems: revenue 2,368 (2,049), adjusted OP 261 (11.0%) vs. 142 (7.0%), on renewable energy and data-center demand and domestic power generation orders. Defense & Space Systems: revenue 2,084 (1,566), adjusted OP 202 (9.7%) vs. 79 (5.1%), driven by higher government budgets; space orders rose despite a large defense order in the prior year. Q2 three-month figures are also charted.
Three-row segment layout: business name at left, paired bar charts (3-month and cumulative revenue and profit with margin line) in the middle, commentary bullets on the right
Industry & Mobility revenue ¥917.7 billion, adjusted operating profit ¥123.6 billion, margin 13.5%. FA Systems: H1 revenue 4,823 (prior 3,780), adjusted OP 822 (17.1%) vs. 332 (8.8%); Q2 revenue 2,481 with 18.0% margin, as AI- and semiconductor-related capex for semiconductors, electronic components and servers grew in Japan, China and Korea, plus the weak yen. Automotive Equipment: H1 revenue 4,354 (4,228), adjusted OP 413 (9.5%) vs. 205 (4.9%); car multimedia downsizing was offset by growth in Japan and North America, and profit rose on mix and cost reductions.
Two-row segment layout with bar charts and bullet commentary; lower half of slide left blank
Life revenue ¥1,298.9 billion, adjusted operating profit ¥141.4 billion, margin 10.9%. Building Systems: H1 revenue 3,590 (prior 3,264), adjusted OP 325 (9.1%) vs. 263 (8.1%), on domestic renewal demand, the weak yen and consolidation of a Middle East affiliate. Air Conditioning & Home Appliances: H1 revenue 9,398 (8,292), adjusted OP 1,089 (11.6%) vs. 664 (8.0%), supported by pre-regulation demand ahead of Japan's revised energy-efficiency standards, a hot European summer, price improvements and sales growth in Japan, Europe and Asia, despite higher material costs. Note: from FY2026 some businesses previously in 'Others' moved into Air Conditioning & Home Appliances, with FY2025 restated.
Two-row segment layout with bar charts, margin lines and bullet commentary; restatement footnote at bottom
Digital Innovation: H1 revenue 820 (prior 718), adjusted operating loss of 3 (-0.4%) vs. profit 36 (5.1%); revenue and orders rose on DX/AI IT investment and the acquisition of a US OT-security company, but amortization of acquired intangibles pushed profit down. Semiconductor & Device: H1 revenue 1,602 (1,406), adjusted OP 329 (20.6%) vs. 240 (17.1%); Q2 revenue 813 with 167 OP (20.6%), on optical devices for AI data-center communications and power semiconductors for rail, power and industrial uses, plus the weak yen.
Two-row segment layout with charts and commentary; no headline summary line
Regional revenue (¥100 million): Japan 14,182 vs. 12,852 (+1,329, 110%); overseas 17,069 vs. 14,472 (+2,596, 118%), of which North America 4,479 (105%), China 3,524 (+890, 134%), Asia excluding China 3,901 (120%), Europe 4,559 (119%), other 603 (120%). Mix: Japan 45%, overseas 55% (North America 14%, China 11%, Asia ex-China 13%, Europe 15%, other 2%). Mini bars show FA Systems' China share rising from 28% to 35% while Japan fell from 40% to 35%, and Air Conditioning's Europe share rising from 28% to 31%.
Donut chart and two stacked 100% bar strips on the left, regional comparison table on the right
Section divider introducing '業績見通し' (Earnings Forecast).
Section number '3' with title and rhombus wave pattern
Full-year forecast (¥100 million): revenue 65,500 vs. prior forecast 62,700 and FY2025 actual 58,947 (111% YoY, +2,800 vs. prior); adjusted operating profit 7,100 vs. 6,200 prior and 5,012 actual (142%, +900); margin 10.8% (+2.3pt YoY, +0.9pt vs. prior); profit before income taxes 6,950 (132%, +250); net profit attributable to owners 4,650, down 300 from the prior 4,950 forecast but 114% of FY2025's 4,077. FX assumptions for 2H: USD ¥155, EUR ¥175, CNY ¥22.0. Annual sensitivity per ¥1 move (¥0.1 for CNY): USD about ¥5 billion revenue, EUR about ¥4 billion, CNY about ¥2 billion; operating profit impact roughly 1/4 to 1/3 of the revenue effect. Prior forecast dated July 31, 2026.
Forecast table with prior-year, prior and current forecast, YoY and change-vs-prior columns; FX assumption and sensitivity table below
Revenue bridge from 58,947 to 65,500 (¥100 million): +970 from FX and +5,583 from volume and other, led by defense & space systems, FA systems and air conditioning & home appliances. Adjusted operating profit bridge from 5,012 to 7,100: +300 FX and +1,788 volume and other — business volume about +1,540, price improvement about +920, Next Stage effect about +450, offset by procurement costs about -1,120.
Two stacked waterfall charts mirroring the H1 bridge slide
Section divider introducing '補足情報' (Supplementary Information).
Section number '4' with title and rhombus wave pattern
H1 (¥100 million, % of revenue): revenue 31,251 (prior 27,325); cost of sales 20,513 (65.6% vs. 68.3%); SG&A 7,290 (23.4% vs. 24.2%); adjusted operating profit 3,447 (11.0%); other income/loss 133 vs. 198; operating profit 3,581 (11.5%) vs. 2,243 (8.2%); finance income/costs -33 vs. +108; equity-method income 488 vs. 187; profit before income taxes 4,035 (12.9%); income taxes 898; net profit 3,137 (10.0%); attributable to owners of the parent 2,970 (9.5%) vs. 1,893.
Full income statement table with amount and ratio columns for each period plus YoY
Q2 three months (¥100 million): revenue 16,284 vs. 14,196; cost of sales 10,535 (64.7% vs. 68.2%); SG&A 3,722 (22.9%); adjusted operating profit 2,026 (12.4%); other income/loss 181 vs. 16; operating profit 2,208 (13.6%) vs. 1,123; finance costs -64 vs. +83; equity-method income 343 vs. 91; profit before income taxes 2,486 (15.3%); income taxes 485; net profit 2,001; attributable to owners 1,888 (11.6%) vs. 984.
Same income statement table layout as page 20 for the quarter
Detailed H1 segment table (¥100 million): Infrastructure 6,783 / 605 / 8.9% (prior 5,823 / 403 / 6.9%); Public Utility 2,330 / 142; Energy 2,368 / 261; Defense & Space 2,084 / 202; Industry & Mobility 9,177 / 1,236 / 13.5% (8,008 / 538); FA Systems 4,823 / 822 / 17.1%; Automotive 4,354 / 413 / 9.5%; Life 12,989 / 1,414 / 10.9% (11,557 / 927); Building Systems 3,590 / 325; AC & Home Appliances 9,398 / 1,089 / 11.6%; Digital Innovation 820 / -3; Semiconductor & Device 1,602 / 329 / 20.6%; Others 4,170 / 182; eliminations -4,291 / -317; total 31,251 / 3,447 / 11.0%.
Wide nine-column table with color-coded vertical bars marking each segment group
Q2 segment table (¥100 million): Infrastructure 3,797 / 381 / 10.0% (prior 3,164 / 213); Industry & Mobility 4,668 / 664 / 14.2% (4,172 / 288); FA Systems 2,481 / 447 / 18.0%; Automotive 2,186 / 217 / 9.9%; Life 6,617 / 806 / 12.2%; AC & Home Appliances 4,693 / 617 / 13.2%; Digital Innovation 483 / 9 / 2.0%; Semiconductor & Device 813 / 167 / 20.6%; total 16,284 / 2,026 / 12.4% vs. 14,196 / 1,107 / 7.8%.
Same color-coded nine-column segment table for the quarter
Full-year segment forecast (¥100 million, revenue / adjusted OP / margin): Infrastructure 17,200 / 1,960 / 11.4% (prior forecast 16,500 / 1,710); Defense & Space 5,700 / 640; Industry & Mobility 18,600 / 2,420 / 13.0% (+1,400 / +460 vs. prior); FA Systems 9,900 / 1,580 / 16.0% (+900 / +380); Automotive 8,700 / 840; Life 25,100 / 2,320 / 9.2%; AC & Home Appliances 17,500 / 1,550; Digital Innovation 1,800 / 0 / 0.0% (profit cut by 100 vs. prior); Semiconductor & Device 3,300 / 660 / 20.0% (+300 / +230); total 65,500 / 7,100 / 10.8%.
Very wide 15-column table comparing FY2025 actual, prior forecast, current forecast, YoY and change vs. prior forecast
FA Systems orders, YoY: +23%, +15%, +17%, +30% across FY2025 Q1–Q4, then +42% (Q1) and +54% (Q2) in FY2026; QoQ +11% and +6% in FY2026 Q1–Q2. Semiconductor & Device orders, YoY: -21%, +5%, +27%, +70% in FY2025, then +53% and +79% in FY2026; QoQ -17% and +54%. Note: automotive equipment and AC & home appliances are excluded because most products are not built to order.
Six-quarter grid table with YoY and QoQ rows for two businesses
Cautionary statement that forecasts are based on assumptions judged reasonable at present and actual results may differ materially, followed by 17 risk factors including economic conditions and regulation, exchange rates, stock markets, funding environment, supply-demand and procurement, patents, litigation, product quality, climate-related regulation, human rights, technological change, business restructuring, information security, natural disasters, geopolitical risk, pandemics and matters relating to officers, major shareholders and affiliates.
Plain white slide with a paragraph and a numbered list of circled numerals
Closing slide with the centered Mitsubishi Electric logo and 'Changes for the Better' tagline.
Centered logo on white background
คำถามทั่วไปเกี่ยวกับสไลด์นี้และเนื้อหาการนำเสนอพื้นฐาน
It covers the first half (April–September 2026) and the second quarter (July–September 2026) of Mitsubishi Electric's fiscal year ending March 2027, which the company calls FY2026 (26年度). It was presented on October 30, 2026, and also includes the revised full-year forecast.
Yes. The original is a Japanese-language earnings briefing deck (決算説明会資料) titled 2027年3月期 第2四半期 決算説明会資料, published on TDnet, the Tokyo Stock Exchange's Timely Disclosure network. This page summarizes every slide in English; amounts are in ¥100 million (億円) as in the original.
Revenue was ¥3,125.1 billion (+14% YoY) and adjusted operating profit ¥344.7 billion (+69%), lifting the adjusted operating margin to 11.0% from 7.5%. Both revenue and adjusted operating profit were first-half records, and net profit attributable to owners rose 57% to ¥297.0 billion.
Yes. The FY2026 forecast was raised to revenue of ¥6.55 trillion (+¥280 billion vs. the July 31 outlook) and adjusted operating profit of ¥710 billion (+¥90 billion), a 10.8% margin. The net profit forecast was trimmed by ¥30 billion to ¥465 billion.
FA Systems was the standout, with H1 adjusted operating profit up from ¥33.2 billion to ¥82.2 billion on AI- and semiconductor-related capex, and orders up 54% YoY in Q2. Air conditioning & home appliances, defense & space, energy systems and power/optical semiconductors also grew strongly; Digital Innovation slipped to a small loss due to acquisition amortization.
The company decided on a share buyback of up to ¥200 billion and expects a total payout ratio of about 69% including dividends. The interim dividend was set at ¥30 per share (up ¥5 YoY), with a ¥30 year-end dividend planned.
Yes. The original PDF is available along with a PPTX conversion, so you can reuse the table layouts, waterfall bridges and segment chart pages as a template for your own earnings or business review presentation. Text in the PPTX is in Japanese, as in the source.
Mitsubishi Electric defines adjusted operating profit as operating profit excluding 'other income and losses' such as gains or losses on the sale of businesses and assets and impairment losses. In H1 FY2026, other income was ¥13.3 billion, giving reported operating profit of ¥358.1 billion.

Create Your Own Slides
Turn your ideas into professional presentations in seconds with 2slides AI.
อ้างอิงการออกแบบมืออาชีพ เลือกสไตล์ของคุณ และสร้างสไลด์ด้วยการแสดงผลข้อความที่สมบูรณ์แบบ ขับเคลื่อนโดย Nano Banana—เริ่มสร้างการนำเสนอของคุณตอนนี้
เอเจนต์ AI ของคุณสำหรับสไลด์ ประหยัดเวลา เปล่งประกายเร็วขึ้นด้วยการสร้างงานนำเสนออัจฉริยะ


© 2026 2slides สงวนลิขสิทธิ์