
อยู่ในคอลเลกชัน ตัวอย่างงานนำเสนอสำหรับนักลงทุน
This is ICICI Bank Limited's Q2 FY2027 earnings presentation (quarter ended September 30, 2026), titled "Q2-2027: Performance review" and dated October 17, 2026. The deck was filed with the Indian stock exchanges (BSE and NSE) as part of the quarterly results disclosure. Headline numbers include profit after tax of ₹148.43 bn (+20.1% y-o-y), a net NPA ratio of 0.30% and a CET1 ratio of 16.01%.
ใช้หน้าปกของงานนำเสนอนี้เป็นต้นแบบสไตล์สำหรับสไลด์ที่สร้างจากเนื้อหาของคุณเอง หรือเลือกหน้าใดก็ได้ด้านล่างเพื่อใช้เลย์เอาต์ของหน้านั้นเป็นต้นแบบ
การนำทางด่วน
แท็ก
แชร์สไลด์
This is ICICI Bank Limited's Q2 FY2027 earnings presentation (quarter ended September 30, 2026), titled "Q2-2027: Performance review" and dated October 17, 2026. The deck was filed with the Indian stock exchanges (BSE and NSE) as part of the quarterly results disclosure. Headline numbers include profit after tax of ₹148.43 bn (+20.1% y-o-y), a net NPA ratio of 0.30% and a CET1 ratio of 16.01%.
มุมมองรายละเอียดของแต่ละหน้าสไลด์ รวมถึงlayout เนื้อหาหลักและองค์ประกอบภาพ
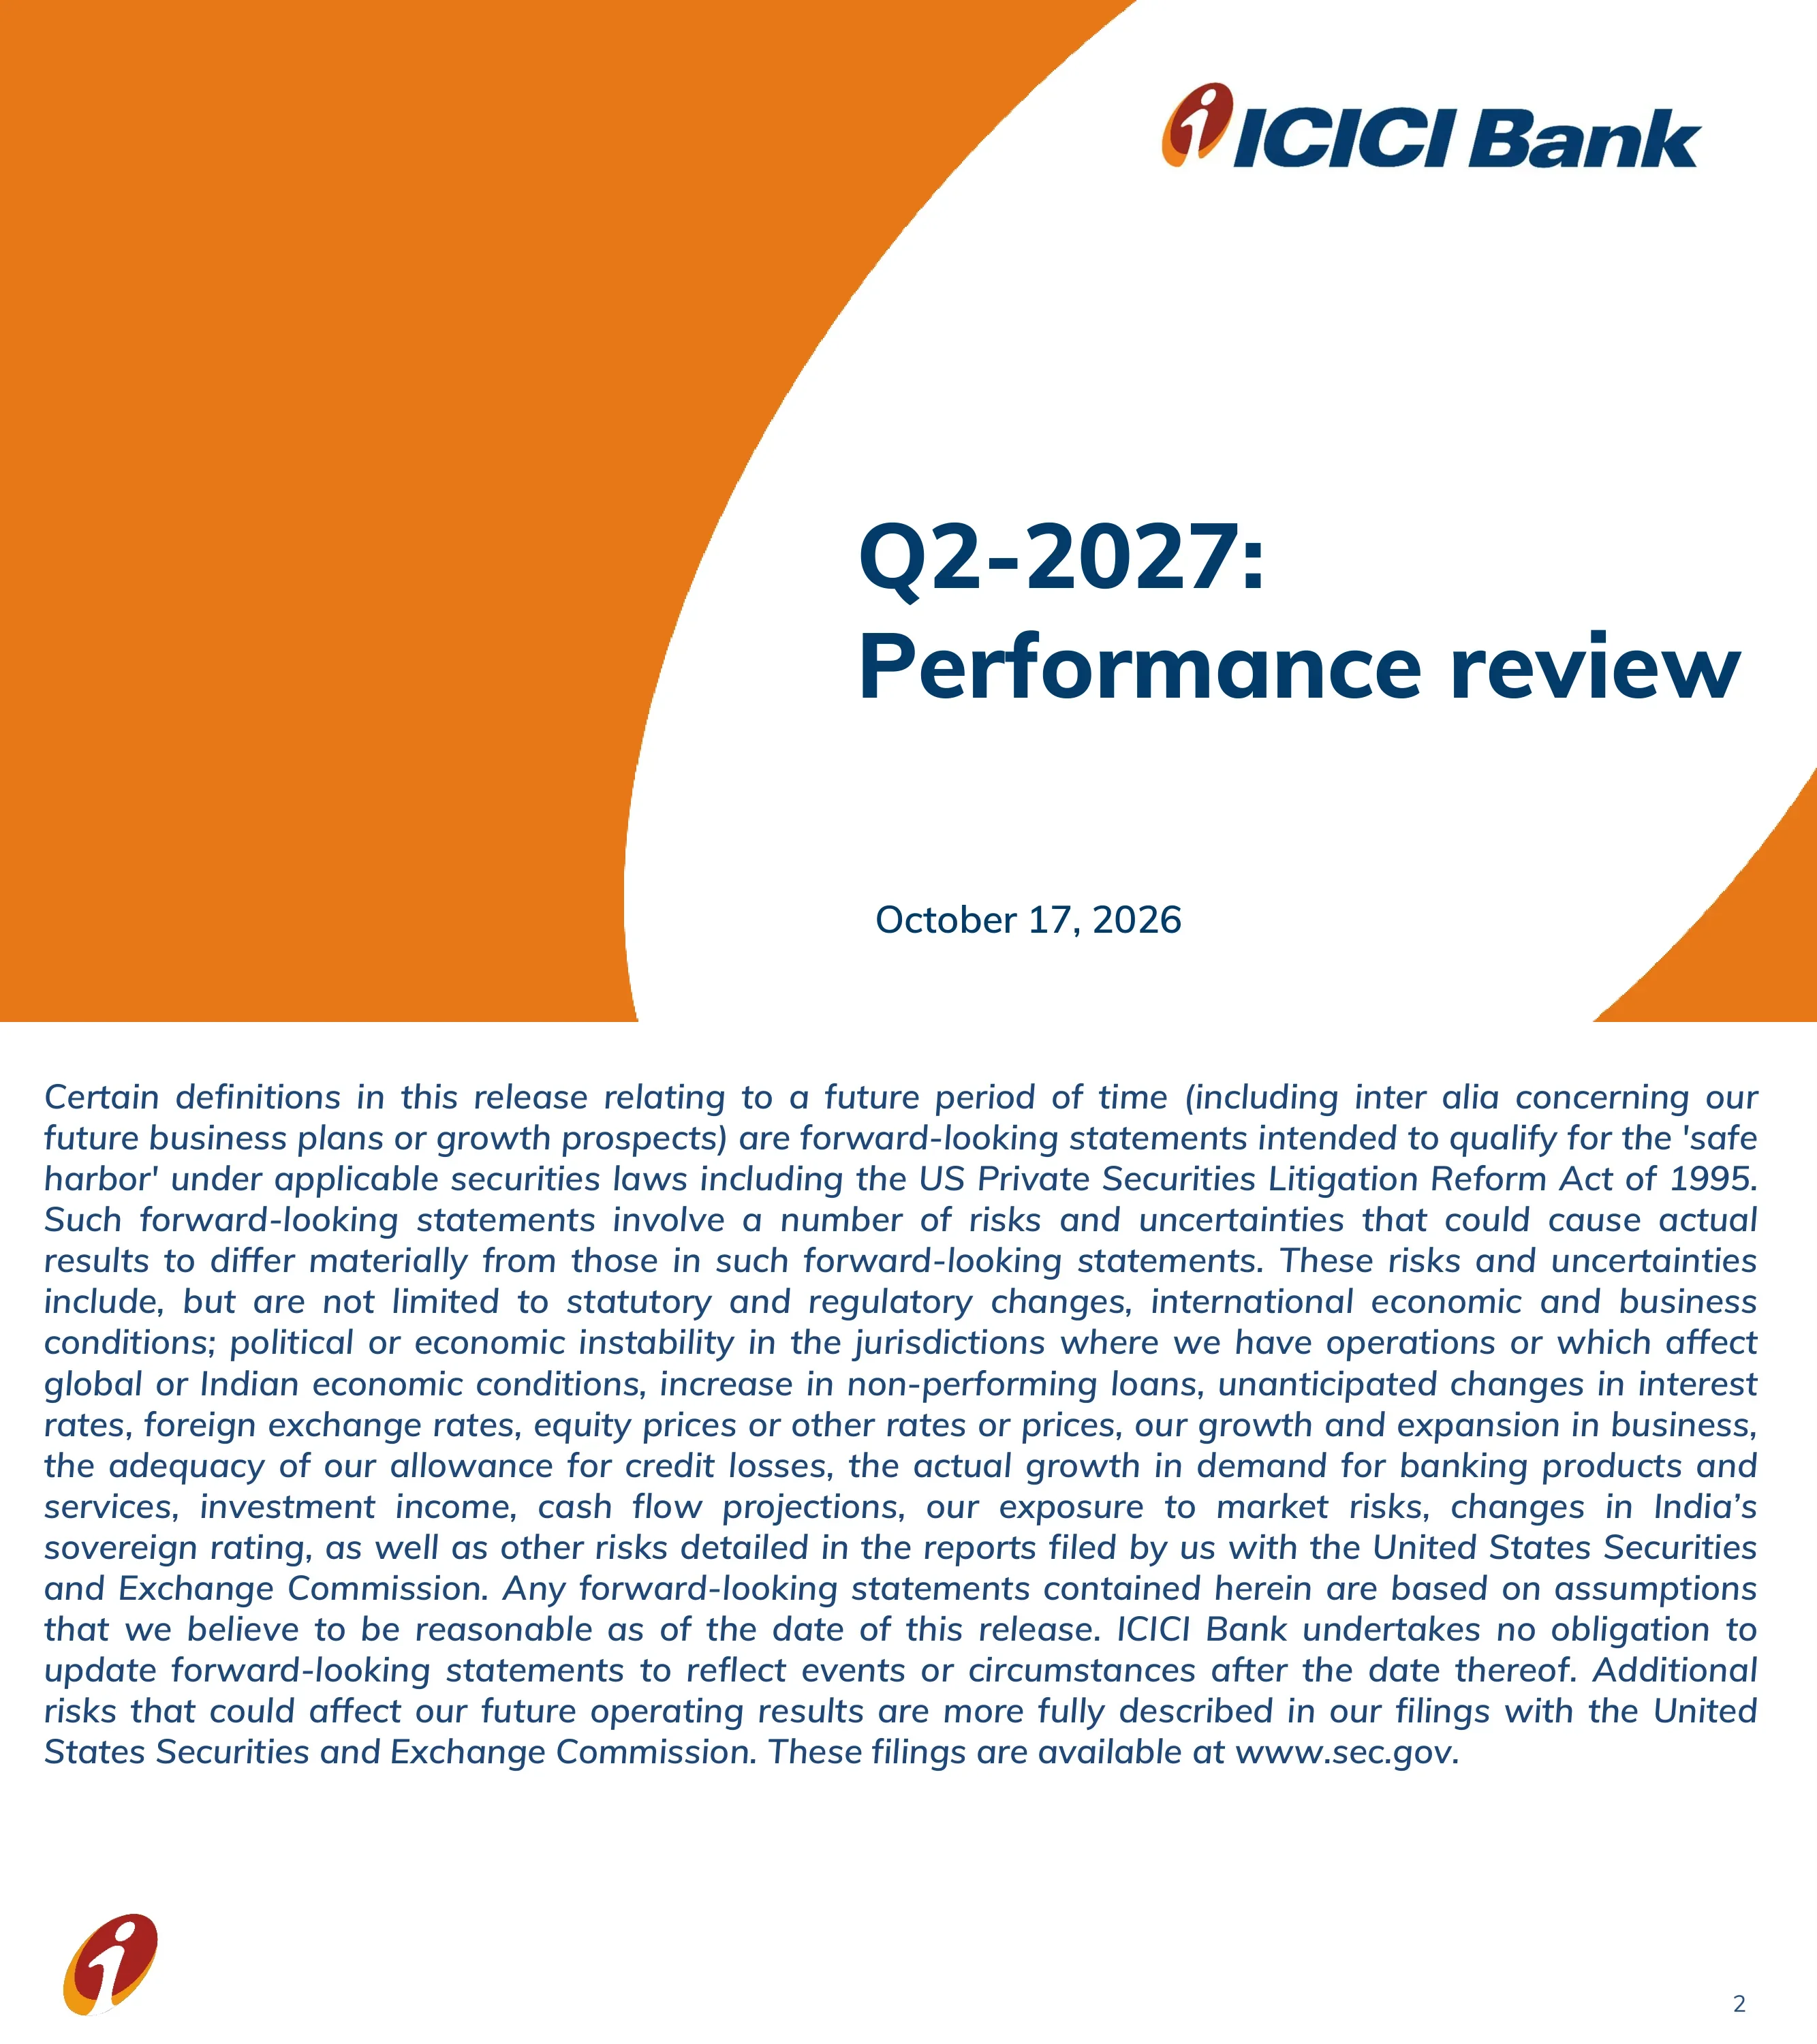
Cover slide of ICICI Bank's "Q2-2027: Performance review", dated October 17, 2026.
A large orange curved swoosh fills the left side; the right is white with the ICICI Bank logo at top-right and the navy title and date below it.
Safe-harbor statement under the US Private Securities Litigation Reform Act of 1995, listing the risks that could cause actual results to differ and referring readers to SEC filings at sec.gov.
A single full-page block of italic navy body text under a maroon title, with no charts or tables.
Section divider opening the highlights part of the deck.
A centered maroon rounded-rectangle banner with white bold text on a white background.
Earnings: PBT excluding treasury +23.4% y-o-y to ₹199.54 bn, core operating profit +21.8% y-o-y to ₹208.05 bn, PAT +20.1% y-o-y to ₹148.43 bn. Asset quality: net NPA ratio 0.30% (Jun 30, 2026: 0.35%), provision coverage ratio 75.0%. Capital: CET1 16.01%, total CAR 16.68%.
Three rounded outlined boxes, each headed by a colored category pill (Earnings, Asset quality, Capital) and filled with bullet points on y-o-y and q-o-q changes.
Deposits: period-end total deposits +27.1% y-o-y and +11.8% q-o-q; excluding FCNR (B) deposits +17.0% y-o-y. Advances: total loans +30.0% y-o-y and +12.3% q-o-q; retail and rural +14.8%, business banking +33.8%, domestic corporate +30.6% y-o-y.
Two rounded outlined boxes, one with an orange Deposits pill and one with a navy Advances pill, each listing growth rates as bullets.
Section divider introducing the financial performance pages (profit and loss, ratios and segment PBT).
A centered maroon rounded-rectangle banner with white bold text on a white background.
Q2-2027 NII ₹253.39 bn (+17.7% vs ₹215.29 bn), non-interest income ₹82.77 bn, fee income ₹77.95 bn (+20.1%), core operating income ₹336.16 bn, opex ₹128.11 bn and core operating profit ₹208.05 bn (+21.8%), in ₹ billion.
A dense financial table with columns for FY2026, Q2-2026, H1-2026, Q1-2027, Q2-2027, H1-2027 and Q2-o-Q2 %; the Q2-2027 column is shaded beige and total rows are bold maroon, with a footnote on interest on tax refund.
Provisions ₹8.51 bn (−7.0%), PBT excluding treasury ₹199.54 bn (+23.4%), treasury loss ₹(2.30) bn, PBT ₹197.24 bn, tax ₹48.81 bn and PAT ₹148.43 bn (+20.1% vs ₹123.59 bn); H1-2027 PAT ₹296.48 bn and FY2026 PAT ₹501.47 bn.
Continuation of the P&L table with the same seven columns, a shaded Q2-2027 column, bold maroon PAT row and footnotes on the FY2026 additional standard asset provision of ₹12.83 bn.
NIM 4.18% (Q1-2027: 4.36%, Q2-2026: 4.30%), cost of deposits 4.50%, cost-to-income 38.4%, ROA 2.26%, standalone ROE 16.6%, weighted average EPS ₹82.7 and book value ₹502.3.
A ratio table with period columns and the current quarter shaded beige, plus maroon cross-reference arrows pointing to slides 44 and 45-47.
Q2-2027 PBT by segment in ₹ billion: Retail 77.17, Wholesale 79.11, Treasury 40.15, Others 0.81, Total 197.24; H1-2027 total 388.50 and FY2026 total 662.19.
A compact table of segment rows against the period columns, with the Q2-2027 column highlighted and a bold maroon total row.
Section divider introducing the deposits, loan portfolio and retail and rural slides.
A centered maroon rounded-rectangle banner with white bold text on a white background.
Total deposits ₹20,498.74 bn at Sep 30, 2026 (+27.1% y-o-y, +11.8% q-o-q); CASA ₹7,408.51 bn (36.1% share, +12.4%): current ₹2,652.47 bn (+28.3%), savings ₹4,756.04 bn (+5.2%); term ₹13,090.23 bn (+37.2%).
A deposits table with the Sep 30, 2026 column shaded, bold maroon total row and maroon arrows linking to slides 48-49, 50 and 51.
Q2-2027 average deposits: CASA ₹6,752.48 bn (+10.7%), term ₹12,129.71 bn (+28.0%), total ₹18,882.19 bn (+21.2% y-o-y, +8.0% q-o-q); average CASA ratio 35.8% (Q1-2027: 38.1%, Q2-2026: 39.2%).
A table of average deposit components by quarter with the Q2-2027 column highlighted and a CASA ratio row beneath the total.
Total advances ₹18,315.80 bn at Sep 30, 2026 (+30.0% y-o-y, +12.3% q-o-q): retail and rural ₹9,456.87 bn (51.6%), business banking ₹3,891.68 bn (21.2%), domestic corporate ₹3,547.71 bn (19.4%), overseas book ₹1,429.54 bn (7.8%).
A loan-book table with the Sep 30, 2026 column shaded, bold maroon total rows, notes on benchmark linkage (about 57% repo/external benchmark, 29% fixed, 14% MCLR) and arrows to slides 52-53, 54 and 64.
Retail and rural loans ₹9,456.87 bn (+14.8%): mortgages ₹5,310.88 bn (+15.3%, 56.2%), vehicle loans ₹1,037.39 bn, personal loans ₹1,419.05 bn (+16.6%), credit cards ₹530.91 bn (−9.7%), jewel loans ₹557.94 bn (+79.4%), farmer finance ₹323.33 bn.
A product-wise table with sub-rows for auto and CV & equipment, a highlighted Sep 30, 2026 column, a bold maroon total row and an arrow to slide 65.
Section divider introducing the NPA, movement and provisions slides.
A centered maroon rounded-rectangle banner with white bold text on a white background.
Gross NPAs ₹233.35 bn at Sep 30, 2026 (Jun: ₹238.47 bn, Sep-25: ₹238.50 bn); net NPAs ₹57.06 bn; gross NPA ratio 1.20% and net NPA ratio 0.30%; provision coverage ratio 75.0%.
A three-date table of gross NPAs, cumulative provisions, net NPAs and ratios with the Sep 30, 2026 column highlighted and an arrow to slide 55.
Q2-2027 gross NPA roll-forward in ₹ billion: opening 238.47, gross additions 48.33, recoveries and upgrades 36.20, net additions 12.13, write-offs 15.92, sale of NPAs 1.33, closing 233.35.
A roll-forward table with retail and rural versus corporate and business banking additions broken out, a shaded Q2-2027 column and footnotes on the Q1-2027 kisan credit card additions of ₹7.06 bn.
Fund-based outstanding under RBI resolution frameworks ₹11.85 bn (₹16.24 bn a year ago); corporate and business banking BB and below ₹35.47 bn; non-fund outstanding to NPAs ₹22.51 bn.
A numbered table with dated columns and footnotes defining each category and the split of borrowers above and below ₹1.00 bn.
Standard, contingency and other provisions ₹238.15 bn at Sep 30, 2026 (Jun: ₹229.63 bn, Sep-25: ₹226.20 bn), of which contingency provisions ₹131.00 bn; 1.3% of net advances.
A small provisions table across three dates with a highlighted current column and footnotes on scope and the excluded ₹12.83 bn additional standard asset provision.
Section divider introducing the loan book composition, sector and concentration slides.
A centered maroon rounded-rectangle banner with white bold text on a white background.
Loan breakup at Sep 30, 2026: mortgages 29.0%, personal loans 7.7%, business banking 21.2%, domestic corporate 19.4%, overseas 7.8%, auto 3.5%, credit cards 2.9%, jewel 3.0%; 51.6% of total loans are retail and rural.
A large pie chart with a legend on the left and a dashed outline around the retail slices, plus a callout stating the retail and rural share.
Mortgages: home loans about 63%, LAP about 18%, average home loan ticket about ₹4.2 mn, average home loan LTV about 60%. Personal loans and credit cards: about 70% to existing customers and about 85% salaried; iLens is the end-to-end retail lending platform.
Two-column layout with orange pill headings for Mortgage and for Personal loans & credit cards, each followed by bullet points.
Growth through the branch network and digital platforms (InstaBIZ, Merchant STACK, Trade Online, DigiEase, EazySign); about 65% of the portfolio by value has a ticket size below ₹10 crore.
A bullet list on the left with a row of icons and illustrations (InstaBIZ phone, store, EazySign logo, document) on the right.
At Sep 30, 2026: A- and above 73.2% (AA- and above 27.1%, A+/A/A- 46.1%), BBB band 26.1%, BB and below 0.4%, NPL 0.0%, unrated 0.4%.
A seven-period trend table from Mar 2022 to Sep 30, 2026 with rating buckets as rows and the latest column highlighted.
Total power sector exposure ₹692.88 bn at Sep 30, 2026; NPA or BB & below ₹7.27 bn (1.0%); other borrowers ₹685.61 bn (99.0%), about 88% of which (excluding State Electricity Boards) are rated A- and above.
A table of exposure by category with percentages, a highlighted current column and an arrow to slide 56.
NBFCs and HFCs ₹1,033.78 bn (Sep-25: ₹794.33 bn); builder portfolio ₹788.52 bn (₹635.83 bn); NBFC/HFC BB & below or NPA below 0.5%, builder portfolio 0.5%.
A two-block table comparing Sep 30, 2026 with Sep 30, 2025 balances and the share in weaker rating or NPA categories.
Total outstanding USD 5.25 billion at Sep 30, 2026; Indian corporates and their subsidiaries/JVs 96%, non-India companies with India-linked operations 3%, non-India corporates and NRI/PIO-owned 1%.
A donut chart with three segments and a legend, with the total outstanding amount stated beside it.
Top 20 borrowers are 6.3% of exposure (9.6% in Mar 2022); top 10 groups 10.6%; all top 20 borrowers are rated A- and above; top 20 depositors are 3.7% of deposits.
A trend table of concentration ratios across periods with the latest column highlighted and short footnotes.
Section divider introducing the AI adoption slides.
A centered maroon rounded-rectangle banner with white bold text on a white background.
Four pillars: a scalable platform for AI delivery, a strategic enabler, internal AI capabilities and responsible AI governance (guardrails, human-in-the-loop, model governance); the Bank will continue to invest in AI.
Four grey rounded cards with orange icon tiles in a row, with a maroon banner across the bottom.
Customer service and engagement (in-house GenAI tool, call/email/chat analytics, bots), decongesting processes (document intelligence, autonomous bots) and fraud prevention (image and facial match, facial recognition).
Three side-by-side cards, each with a colored top bar, a title and bullet points.
Monitoring and assessment (AI tools summarising GST reports and statements), strengthening technology and cybersecurity (AI-assisted coding and testing), and employee productivity and knowledge retrieval (AI search, email response generation).
Three side-by-side cards with colored top bars, titles and bullet lists, matching the previous slide.
Section divider introducing the capital adequacy slide.
A centered maroon rounded-rectangle banner with white bold text on a white background.
At Sep 30, 2026: total capital ₹3,398.72 bn (16.68%), Tier I/CET1 ₹3,262.33 bn (16.01%), Tier II ₹136.39 bn (0.67%), RWA ₹20,375.68 bn; compared with 16.84% at Jun 30, 2026 and 17.00% at Sep 30, 2025.
A capital table with three date columns, the Sep 30, 2026 column shaded, bold maroon total rows and an arrow to slide 57.
Section divider introducing the subsidiaries slides.
A centered maroon rounded-rectangle banner with white bold text on a white background.
Q2-2027 PAT in ₹ billion: ICICI Life 3.74, ICICI Lombard 9.46, ICICI Prudential AMC 8.89, ICICI Securities (consolidated) 4.39, ICICI Home Finance 2.20; ICICI Bank UK USD 6.5 mn and ICICI Bank Canada CAD 5.0 mn.
A table of subsidiaries with FY2026, H1 and quarterly columns, the Q2-2027 column highlighted and an arrow to slides 58-63.
ICICI Life: H1-2027 APE ₹49.35 bn (from ₹42.86 bn), VNB ₹12.83 bn (from ₹10.49 bn), new business sum assured +30.1%. ICICI Lombard: GDPI ₹67.92 bn in Q2-2027 (from ₹65.96 bn).
Two stacked sections with the subsidiary name as a heading and key metrics listed as bullets or compact comparisons.
ICICI Prudential AMC: equity AUM share 13.7%, equity-hybrid 26.4%, MF QAAUM +14.4% to ₹11,608.19 bn. ICICI Securities: total client assets +7.5% to ₹9.03 trillion; MTF market share about 16.1%.
Two stacked sections with subsidiary headings and key metrics as bullets, matching the previous slide.
Section divider introducing the ESG slide.
A centered maroon rounded-rectangle banner with white bold text on a white background.
Environment (carbon-neutrality roadmap for Scope 1 & 2 emissions, water circularity), Social (19.8 million+ individuals benefited via CSR, ESG metrics aligned to UN SDGs) and Governance (Board ESG & CSR Committee and Risk Committee oversight).
Three columns, each headed by a colored pill and followed by bullet points, with a footer noting the contribution to UN SDGs.
Closing slide that mirrors the cover with a navy "Thank you".
A large orange swoosh on the left, with the ICICI Bank logo at top-right and the navy message on white.
Section divider opening the appendix of supporting schedules (slides 44-65).
A centered maroon rounded-rectangle banner with white bold text on a white background.
Q2-2027 (%): yield on interest-earning assets 8.09, yield on advances 8.82, cost of funds 4.59, cost of deposits 4.50, NIM 4.18 (domestic 4.32, overseas 1.07).
A ratio table with the Q2-2027 column shaded beige and a maroon back-arrow to slide 9.
Q2-2027 consolidated NII ₹303.36 bn (+15.9%), non-interest income ₹321.69 bn (fee ₹103.28 bn, premium income ₹213.93 bn), total income ₹625.05 bn, opex ₹384.95 bn and operating profit ₹240.10 bn (+20.2%).
A dense P&L table with period columns, a shaded Q2-2027 column and bold maroon total rows.
Operating profit ₹240.10 bn, provisions ₹8.95 bn, PBT ₹231.15 bn (+21.3%), tax ₹58.03 bn, minority interest ₹10.56 bn and consolidated PAT ₹163.33 bn (+22.3% vs ₹133.57 bn); H1-2027 ₹317.73 bn and FY2026 ₹542.08 bn.
Continuation of the consolidated P&L table with the same columns, a shaded Q2-2027 column and a bold maroon PAT row.
Consolidated ROE 16.9% in Q2-2027, weighted average EPS ₹91.0 and book value ₹528.
A short ratio table across periods with the Q2-2027 column shaded and a back-arrow to slide 9.
Sep 30, 2026 in ₹ billion: net worth 3,605.94, deposits 20,498.74, borrowings 2,045.53, other liabilities 1,102.66, total 27,252.87; domestic credit/deposit ratio 84.0% (Jun: 87.5%).
A balance sheet liabilities table with a shaded Sep 30, 2026 column, a bold maroon total row and a credit/deposit ratio note.
Domestic borrowings ₹936.49 bn (capital instruments ₹52.27 bn, other ₹884.22 bn including long-term infrastructure bonds ₹352.69 bn and refinance ₹447.10 bn); overseas ₹1,109.04 bn; total ₹2,045.53 bn.
A borrowings table with domestic and overseas sub-blocks, a shaded Sep 30, 2026 column and a back-arrow to slide 12.
At Sep 30, 2026 in ₹ billion: total assets 32,929.53 (advances 19,353.85, investments 9,487.28, cash and bank 2,752.62); net worth 3,905.24, deposits 20,915.39, borrowings 2,955.61.
A two-part balance sheet table of assets and liabilities with a shaded Sep 30, 2026 column and bold maroon totals.
7,656 branches at Sep 30, 2026 (metro 2,422, urban 1,520, semi-urban 1,973, rural 1,741), up from 5,418 in Mar 2022; 12,143 ATMs and cash recycling machines.
A table of branches by geography with percentage shares across several dates, and an ATM row below.
Sep 30, 2026 in ₹ billion: cash and bank 2,443.88, investments 5,574.94 (SLR 4,405.95), advances 18,315.80, fixed and other assets 918.25, total 27,252.87.
A balance sheet assets table with sub-rows for SLR and subsidiaries equity, a shaded Sep 30, 2026 column and a bold maroon total row.
Total ₹235.00 bn: ICICI Securities 71.46, ICICI Life 47.45, ICICI Lombard 46.50, Home Finance 23.62, Prudential AMC 22.01, Canada 9.96, UK 9.71 (₹ billion); the Bank bought an additional 2% stake in ICICI Life for ₹14.70 bn.
A list table of subsidiaries with investment values, a highlighted current column and a footnote on the ICICI Life stake purchase.
Consolidated advances of ₹19,354 bn: domestic 90.3% and international 9.7%, up from 4.6% a year ago.
A compact composition table comparing domestic and international shares across dates, with a back-arrow to the loan portfolio slide.
Retail and rural gross NPAs ₹119.45 bn (1.25% of gross advances) and net NPAs ₹36.32 bn (0.38%) at Sep 30, 2026.
A small table across dates with a shaded current column and a back-arrow to slide 17.
Top 10 sectors as a share of total exposure of ₹35,286 bn at Sep 30, 2026: retail finance 37.6%, services-finance 7.1%, wholesale/retail trade 6.9%, banks 6.1%, services non-finance 4.9%, electronics and engineering 4.1%.
A ranked table of sectors with percentage columns across dates and a back-arrow to slide 26.
At Sep 30, 2026: total capital adequacy 16.62%, Tier I/CET1 15.97%, Tier II 0.65%.
A short capital table across dates with a shaded current column and a back-arrow to slide 35.
ICICI Life Q2-2027: APE ₹27.99 bn, AUM ₹3,289.64 bn, cost/total premium 18.7%. ICICI General Q2-2027: GWP ₹77.02 bn, combined ratio 107.0% (105.3% excluding CAT losses), ROAE 21.7%.
Two stacked tables, one for each insurer, with period columns and a shaded Q2-2027 column.
Q2-2027 in USD million: NII 17.1, operating profit 8.9, loans 1,827.6, deposits 2,561.2 (retail term 944.6), net impaired loans 2.2; CAR 18.1%, Tier I 15.7%.
A financial table in USD million with period columns, a shaded Q2-2027 column and a ratio block at the bottom.
Total assets USD 3.17 bn: loans and advances 57.7%, cash 19.0%, India-linked investments 12.4%. Liabilities: term deposits 57.8%, demand deposits 23.0%, net worth 11.1%.
Two side-by-side pie charts, one for assets and one for liabilities, each with percentage labels and a legend.
Q2-2027 in CAD million: NII 17.0, operating profit 7.7, loans 4,255.6 (residential mortgages 2,311.6), deposits 2,951.6, net impaired loans 29.8; CAR 18.2%, Tier I 18.0%.
A financial table in CAD million with period columns, a shaded Q2-2027 column and a ratio block at the bottom.
Total assets CAD 5.04 bn: loans to customers 38.8%, insured and securitised mortgages 29.1%, conventional mortgages 16.8%, cash and liquid securities 14.2%. Liabilities: term deposits 48.1%, borrowings 30.5%, demand deposits 10.3%, net worth 9.8%.
Two side-by-side pie charts for assets and liabilities, each with percentage labels and a legend.
Under Ind AS in ₹ billion: loans 351.57, gross stage-3 assets 4.24, net stage-3 assets 2.77; CAR 19.4%.
A compact table with period columns and a shaded current column, plus a back-arrow to slide 37.
Five-date trend (Mar 2025 to Sep 2026) in ₹ billion: retail and rural 8,014.49 to 9,456.87; business banking 2,633.67 to 3,891.68; domestic corporate 2,737.66 to 3,547.71; total domestic gross 13,385.81 to 16,896.26.
A five-column trend table with the latest column shaded, a bold maroon total row and a back-arrow to slide 14.
Mar 2025 to Sep 2026 in ₹ billion: mortgages 4,395.85 to 5,310.88, jewel loans 313.79 to 557.94, credit cards 573.41 to 530.91, total retail and rural 8,014.49 to 9,456.87.
A five-column trend table by product with the latest column shaded, a bold maroon total row and a back-arrow to slide 15.
คำถามทั่วไปเกี่ยวกับสไลด์นี้และเนื้อหาการนำเสนอพื้นฐาน
It covers the quarter ended September 30, 2026. ICICI Bank's fiscal year FY2027 runs from April 1, 2026 to March 31, 2027, so Q2-2027 is July to September 2026 and H1-2027 is April to September 2026. The deck is titled "Q2-2027: Performance review" and is dated October 17, 2026.
It was filed with the Indian stock exchanges, BSE and NSE, as part of ICICI Bank's quarterly results disclosure. ICICI Bank is also listed on the NYSE through ADRs, and the disclaimer slide refers to its SEC filings.
Profit after tax was ₹148.43 bn, up 20.1% y-o-y. Core operating profit was ₹208.05 bn (+21.8% y-o-y) and the net NPA ratio was 0.30%. The CET1 ratio was 16.01% and the total capital adequacy ratio was 16.68%. Total deposits grew 27.1% y-o-y and total advances grew 30.0% y-o-y.
The deck reports most amounts in ₹ billion, the unit ICICI Bank chose for its quarterly disclosure. A few figures use other units: ₹ crore for business-banking ticket size, ₹ mn for the home loan ticket, ₹ trillion for ICICI Securities client assets, and USD million and CAD million for ICICI Bank UK and ICICI Bank Canada. This page keeps the deck's own units and does not convert currencies.
Slides 43 to 65 hold additional financial information. They include yield, cost and margin, the consolidated P&L and balance sheet, the standalone balance sheet, borrowings, the branch and ATM network, and sector-wise exposures. They also cover consolidated capital adequacy, the insurance entities, the UK, Canada and Home Finance subsidiaries, and loan portfolio trends. Maroon arrows on the main slides, such as "slide 44 ▶", link to these appendix slides, and back-arrows such as "◀ slide 9" return to the main slide.
Yes. Both a PPTX and a PDF are available on this page. The original filing was a PDF, and the PPTX was converted from that filed PDF, so expect some formatting differences from the PDF.
Use this deck as a reference in 2Slides. Upload your own results data or notes and ask for the same structure: a cover, a disclaimer, highlight boxes with colored pills, dense financial tables with a highlighted current-quarter column, section dividers and a cross-referenced appendix. You can then change the colors, logo and wording to match your own bank's brand.

Create Your Own Slides
Turn your ideas into professional presentations in seconds with 2slides AI.
อ้างอิงการออกแบบมืออาชีพ เลือกสไตล์ของคุณ และสร้างสไลด์ด้วยการแสดงผลข้อความที่สมบูรณ์แบบ ขับเคลื่อนโดย Nano Banana—เริ่มสร้างการนำเสนอของคุณตอนนี้
เอเจนต์ AI ของคุณสำหรับสไลด์ ประหยัดเวลา เปล่งประกายเร็วขึ้นด้วยการสร้างงานนำเสนออัจฉริยะ


© 2026 2slides สงวนลิขสิทธิ์