
อยู่ในคอลเลกชัน ตัวอย่างงานนำเสนอสำหรับนักลงทุน
Fifth Third Bancorp Q3 2026 Earnings Presentation (3Q26, October 19, 2026): the first quarter after the Comerica systems conversion, filed with the SEC as an exhibit to Form 8-K. It reports reported EPS of $0.90 and adjusted EPS of $1.13, net interest income of $2.28 billion at a 3.34% NIM, adjusted ROTCE of 20.6%, a 54.6% adjusted efficiency ratio, 31 bps of net charge-offs and a 10.0% CET1 ratio, followed by a 30-page appendix on loan books, credit, rate risk, securities, hedges and non-GAAP reconciliations.
ใช้หน้าปกของงานนำเสนอนี้เป็นต้นแบบสไตล์สำหรับสไลด์ที่สร้างจากเนื้อหาของคุณเอง หรือเลือกหน้าใดก็ได้ด้านล่างเพื่อใช้เลย์เอาต์ของหน้านั้นเป็นต้นแบบ
การนำทางด่วน
แท็ก
แชร์สไลด์
Fifth Third Bancorp Q3 2026 Earnings Presentation (3Q26, October 19, 2026): the first quarter after the Comerica systems conversion, filed with the SEC as an exhibit to Form 8-K. It reports reported EPS of $0.90 and adjusted EPS of $1.13, net interest income of $2.28 billion at a 3.34% NIM, adjusted ROTCE of 20.6%, a 54.6% adjusted efficiency ratio, 31 bps of net charge-offs and a 10.0% CET1 ratio, followed by a 30-page appendix on loan books, credit, rate risk, securities, hedges and non-GAAP reconciliations.
มุมมองรายละเอียดของแต่ละหน้าสไลด์ รวมถึงlayout เนื้อหาหลักและองค์ประกอบภาพ
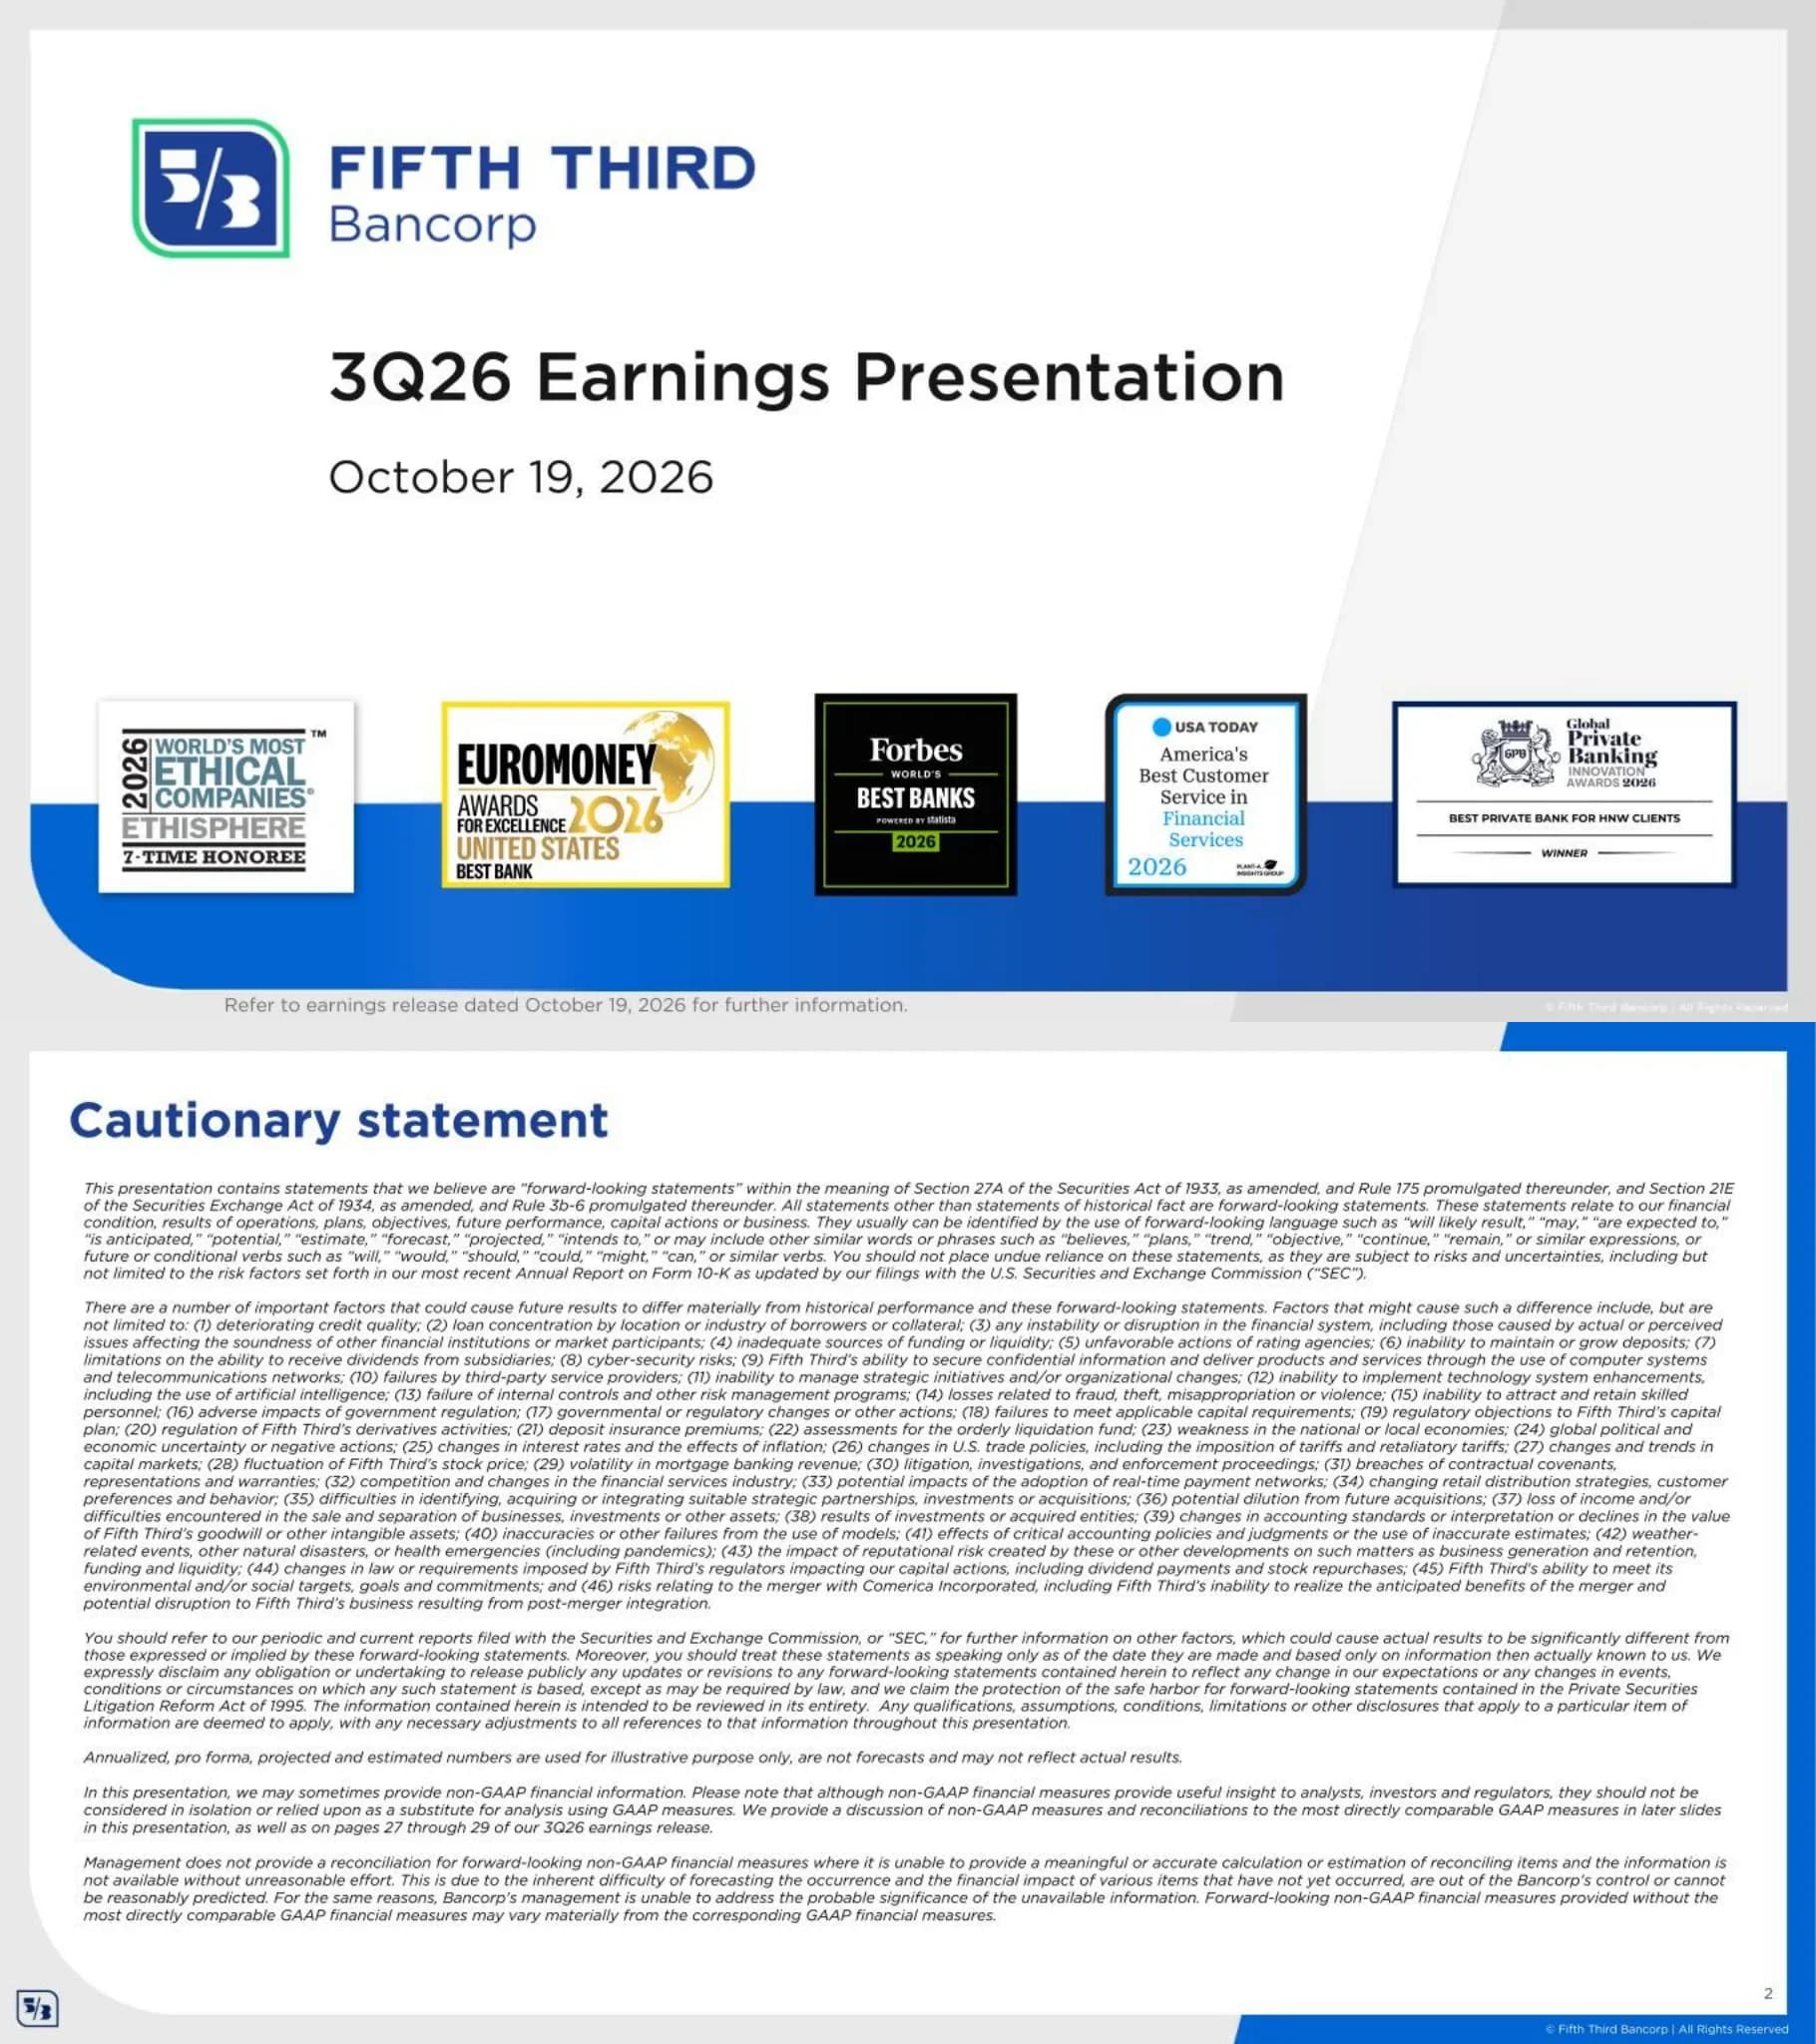
Fifth Third Bancorp title slide for the 3Q26 Earnings Presentation dated October 19, 2026, with a row of 2026 award badges: Ethisphere World's Most Ethical Companies (7-time honoree), Euromoney Best Bank United States, Forbes World's Best Banks, USA Today America's Best Customer Service in Financial Services and Global Private Banking Innovation Awards Best Private Bank for HNW Clients. A footer refers readers to the earnings release dated October 19, 2026.
White panel with a diagonal grey wedge at right; logo and title stacked on the upper left; five award badges evenly spaced across a curved royal-blue band at the bottom
Forward-looking statements disclaimer under the Securities Act and Exchange Act, listing 46 risk factors including credit quality, liquidity, cyber-security, regulation, interest rates and tariffs, and risks relating to the merger with Comerica Incorporated, including post-merger integration. It notes that non-GAAP reconciliations appear in later slides and on pages 27 through 29 of the 3Q26 earnings release.
Bold navy title on white with five paragraphs of small italic body text filling the slide
Four messages: the Comerica systems integration was completed with strong client and banker retention and the full $850 million expense synergy run-rate locked in for 4Q26; the combined company's earnings power is increasingly evident in stronger PPNR, higher returns and better efficiency; organic growth is broadening across legacy and acquired markets with deposit share gains, commercial relationship growth and Southeast momentum; and strong deposits, resilient credit and disciplined balance sheet management provide flexibility across rate environments.
Royal-blue title bar with dark diagonal accent; four full-width light-grey rounded rows, each led by a numbered navy circle
Versus 2Q26, net interest income rose 3%, the adjusted efficiency ratio improved 250 bps, net charge-offs were 31 bps, adjusted ROA rose 10 bps to 1.41% (highest since 4Q22), adjusted ROTCE improved 160 bps to 20.6%, and core deposits grew 3% with a 76% loan-to-core-deposit ratio. A reported/adjusted table shows EPS $0.90/$1.13, ROA 1.14%/1.41%, ROE 10.2%/12.8%, ROTCE 16.6%/20.6%, NIM 3.34%/3.34%, efficiency ratio 62.4%/54.6%, PPNR $1,235MM/$1,512MM and CET1 10.0%.
Two columns: grey bullet panel on the left, two-column Reported vs Adjusted metrics table with blue headers on the right
Quarterly NII rose from $1.53B in 3Q25 and 4Q25 to $1.94B in 1Q26, $2.22B in 2Q26 and $2.28B in 3Q26, with NIM of 3.13%, 3.13%, 3.30%, 3.36% and 3.34%. A walk table bridges 2Q26 NII of $2,220M (3.36%) to 3Q26 NII of $2,276M (3.34%): conversion-related cash $0 and (4) bps, one more day +$18M and (1) bp, fixed-rate asset repricing +$8M and +1 bp, and core loan and deposit performance +$30M and +2 bps.
Left: navy column chart with NIM shown in green-ringed white circles inside the bars; right: NII and NIM walk table with blue header cells and a grey total row
Noninterest income excluding certain items was $1.05B, up $12M (1%) from the prior quarter and $263M (33%) year over year; wealth and asset management, commercial payments and commercial banking made up 61% of adjusted fees and more than offset lower capital markets fees. The table lists wealth and asset management $259M (+43% YoY), commercial payments $256M (+63%), consumer banking $158M, capital markets $147M, commercial banking $128M, mortgage banking $47M, other $18M and securities losses $(5)M, for reported noninterest income of $1,008M and adjusted $1,052M. Paired bars compare reported vs adjusted fees from 3Q25 ($781M/$789M) to 3Q26 ($1,008M/$1,052M).
Left: grey bullet panel above a paired column chart; right: line-item table with 3Q26, PQ and YoY columns
Adjusted noninterest expense fell 2% from the prior quarter and rose 45% from a year ago; lower compensation was offset by higher conversion-related technology costs, and merger-related charges totaled about $1.04B year to date. The table shows compensation and benefits $982M, technology and communications $300M (+134% YoY), occupancy $144M, card and processing $60M, equipment $59M, marketing $57M, loan and lease $47M and other $400M, for total expense of $2,049M, $(239)M of certain items and adjusted expense of $1,816M. The chart tracks total vs adjusted expense ($1,267M/$1,253M in 3Q25 to $2,049M/$1,816M in 3Q26) and the adjusted efficiency ratio (54.1%, 54.3%, 61.9%, 57.1%, 54.6%).
Left: bullet panel above stacked columns with efficiency-ratio circles; right: expense line-item table with reconciliation rows
Average loans and leases were $123.3B in 3Q25, $123.4B in 4Q25, $157.6B in 1Q26, $177.6B in 2Q26 and $179.2B in 3Q26 ($125.6B commercial, $53.7B consumer), with total loan yield moving from 6.12% to 5.89%. Period-end balances reached $180.3B. A donut shows the portfolio 70% commercial and 30% consumer: commercial and industrial 48%, commercial real estate 20%, residential mortgage 11%, indirect secured consumer 10%, home equity 4%, credit card and other 3%, commercial leases 2% and solar energy installation 2%.
Left half: two stacked bar charts (average and period-end); right half: large donut chart with labelled segments and a centered commercial/consumer split
Average deposits rose from $164.8B in 3Q25 to $238.3B in 3Q26, with core deposits of $235.6B and interest-bearing deposit costs of 2.24%. The $238B mix is money market and savings 35%, interest checking 31%, demand 27% and time deposits 6%. Total cost of deposits was 1.64% in 3Q26 against a 4.00% Fed funds rate, and non-interest-bearing deposits were $64.2B, or 27.3% of core deposits.
Four-quadrant grid: deposit balance columns, deposit-mix donut, cost-of-deposits line chart and core deposit trend stacked columns with a percentage line
A five-quarter table shows the NPL ratio at 0.59%, NPA ratio 0.64%, 30-89 days past due 0.30%, NCO ratio 0.31% (down from 1.09% in 3Q25) and ACL ratio 1.74% in 3Q26. Bar charts show nonperforming loans rising from $768M to $1,070M, loans 30-89 days past due of $540M (down from a $683M peak in 1Q26) and net charge-offs of $139M, compared with $339M in 3Q25.
Full-width ratio table with blue quarter headers on top; three small navy column charts below separated by thin dividers
Four line charts from 3Q17 to 3Q26 compare each ratio with its 10-year average excluding COVID (dashed line): total net charge-off ratio 0.31%, non-performing assets ratio 0.64%, consumer net charge-off ratio 0.52% and commercial net charge-off ratio 0.22%. Both the total and commercial NCO series show a one-quarter spike in 3Q25 before returning below average.
2x2 grid of navy line charts, each with a dashed grey average line and a labelled 3Q26 end point
Liquidity sources totaled $142B at 9/30/26 (vs $141B at 6/30/26): Fed reserves $15B, unpledged investment securities $34B, available FHLB capacity $15B and Fed discount window availability $78B. The bank kept full Category 1 LCR compliance, ending at 102%, with a 76% loan-to-core-deposit ratio, daily LCR calculations, monthly stress tests and monthly 2052a reporting. A CET1 waterfall moves from 9.9% in 2Q26 to 10.0% in 3Q26 (+33 bps net income, (11) bps RWA, 0 bps buybacks, (16) bps common dividends, +2 bps other), and a trend chart shows reported CET1 of 10.6%, 10.8%, 9.9%, 9.9% and 10.0%, with a fully-phased 9.2% in 3Q26.
Left: liquidity sources table above a grey bullet panel; right: CET1 waterfall chart above a CET1 column trend chart
Fourth-quarter 2026 guidance as of October 19, 2026: average loans and leases (including HFS) up 1-2%; net interest income up 2.5-3.5% from a $2.28B 3Q26 baseline, assuming a 4.25% Fed funds rate at 12/31/26 and including purchase accounting accretion; noninterest income up 2-4% from a $1.05B baseline; noninterest expense down 2-3% from a $1.82B baseline, including about $60MM of anticipated CDI amortization and excluding acquisition-related charges; net charge-off ratio of 30-35 bps; and an effective tax rate of 22.5%.
Centered two-column guidance table with a single blue 4Q26 header and alternating grey rows; small baseline notes under each line item
Section divider introducing the appendix of supplementary digital, portfolio, credit, balance sheet, hedging and non-GAAP slides.
White panel with the word Appendix in blue at left center and a large navy diagonal wedge on the right
Average active digital users grew from 3.19 million in 3Q25 to 3.49 million in 3Q26, and active mobile users from 2.47 million to 2.73 million. Digitally assisted mortgage applications stayed at 97-98%, and the digital share of new consumer deposit accounts was 33% in 3Q26. An award panel notes the Jeanie chatbot was named Best Chatbot by the Tearsheet AI Innovation Awards and that the mobile app serves millions of monthly users and powers more than one billion digital interactions a year.
Four grey column charts with the latest quarter highlighted in blue, arranged in a 2x2 grid, plus a rounded outlined award panel on the right with app imagery
LTM 3Q26 pro-forma noninterest income of $4.2B is split wealth and asset management 25%, commercial payments 24%, consumer banking 16%, capital markets 14%, commercial banking 12%, mortgage banking 4% and other 4%. Fees were about 32% of total pro-forma revenue for the twelve months ending 9/30/26, against a 30% LTM 2Q26 peer median, reflecting a focus on diversifying revenue to lessen cyclicality.
Left: large donut chart with $4.2B in the center; right: two-bar comparison chart above two bullets, separated by a vertical blue rule
Commercial loans averaged $125.6B (period-end $126.4B) in 3Q26, up from $74.9B in 3Q25 after the 1Q26 merger step-up (average +41.9% and period-end +67.0% QoQ in 1Q26). Key statistics for 3Q26 vs 3Q25: NCO ratio 0.22% vs 1.46%, 30-89 day delinquencies 0.24%, 90+ delinquencies 0.01% and nonperforming loans 0.52%. The commercial mix is C&I 68%, commercial mortgage 22%, commercial construction 7% and commercial leases 3%.
Left: paired average/period-end columns above two blue-headed QoQ change strips; right: key statistics table above a pie chart
C&I loans averaged $86.0B (period-end $86.1B) in 3Q26, up from $54.2B average in 3Q25. The NCO ratio was 0.35% (2.01% in 3Q25), 30-89 day delinquencies 0.25%, 90+ delinquencies 0.01% and nonperforming loans 0.52%. Revolving line utilization ranged from 34.9% to 38.5% between 2Q24 and 3Q26 and was 38.0% in 3Q26; 1Q26 and 2Q26 were restated to Fifth Third methodology after the Comerica conversion.
Same portfolio-overview template: paired columns and QoQ strips on the left, key statistics table and a line chart on the right
Loans to non-depository financial institutions were $14.3B, or 8% of loans, at 9/30/26: subscription lines 30%, real estate 25%, corporate credit facilities 24%, private capital warehouse 11% and consumer warehouse 10%. Fifth Third cites the second-lowest NDFI exposure among peers, 87% of the portfolio investment grade or equivalent, a 44 bps criticized rate (down 10 bps sequentially) and zero losses in ten years across real estate, subscription lines and private capital warehouse. BDC balances total $267 million, or 0.15% of total loans.
Left: large segmented donut with category labels and sub-captions; right: two grey bullet panels for NDFI and private capital warehouse characteristics
The Shared National Credit portfolio was $46.6BN, about 26% of total loans, at 9/30/26, spread across other 24%, financial services 16%, rental and leasing 13%, entertainment 12%, retail 11%, manufacturing 8%, business services 8% and wholesale trade 8%. Key statistics: loan balance $46.6B (vs $32.2B in 3Q25), NPLs 0.40% and NCO ratio 0.42%. About 60% of SNC balances are to investment-grade-equivalent borrowers, Fifth Third is lead left or lead right on about 50% of relationships, and criticized assets run below the rest of the commercial book.
Left: tall stacked bar bracketed into a multicolor industry pie; right: key statistics table above a grey bullet panel
Leveraged loans make up 2.1% of $181.0 billion in total loans at 9/30/26, a $3.7 billion portfolio diversified across industries including manufacturing, wholesale trade, arts and entertainment, accommodation and food services, information, retail trade and professional services. The leveraged book is about 2% of loans versus about 8% in 2015, and the leveraged criticized asset ratio remains well below its 5-year average.
Left: total-loans donut with a highlighted green slice that fans out via a grey wedge to a larger multicolor donut on the right; bullet panel at lower left
CRE loans averaged $36.0B in 3Q26 (commercial mortgage $27.3B, construction $8.7B), up from $17.6B in 3Q25. Key statistics for 3Q26: NCO ratio (0.07%) net recovery, 30-89 day delinquencies 0.21%, 90+ delinquencies 0.01% and nonperforming loans 0.56%. CRE mortgage is 53% non-owner occupied (multifamily 28%, industrial 19%, retail 18%, hospitality 10%, medical office 9%, office 8%, other 7%), and the construction book is multifamily 41%, industrial 21%, home builder 19% and other 10%, with hospitality, office and retail making up the remainder.
Portfolio-overview template with stacked mortgage/construction columns, plus two pie charts and a stacked property-type bar on the lower right
Consumer loans averaged $53.7B (period-end $53.9B) in 3Q26, up from $48.4B in 3Q25. The NCO ratio was 0.52%, 30-89 day delinquencies 0.44%, 90+ delinquencies 0.06% and NPLs 0.76%, with a weighted average FICO at origination of 768 and LTV of 79%. By FICO at origination, 67% of the book is 750+, 16% is 720-749, 15% is 660-719 and 2% is below 660.
Portfolio-overview template: paired columns and QoQ strips left; key statistics table and a horizontal FICO distribution bar right
Residential mortgage loans averaged $19.8B (period-end $19.9B) in 3Q26 versus $17.7B in 3Q25. Net charge-offs were nil, 30-89 day delinquencies 0.19%, 90+ delinquencies 0.08% and NPLs 0.80%, with weighted average FICO at origination of 762 and LTV of 75%. 69% of the book had a FICO of 750+ at origination.
Portfolio-overview template with paired columns, QoQ strips, key statistics table and FICO bar
Home equity loans averaged $7.0B (period-end $7.1B) in 3Q26, up from $4.6B in 3Q25, with a 27.2% average QoQ jump in 1Q26. The book posted a (0.03%) net recovery, 30-89 day delinquencies of 0.59%, no 90+ delinquencies and NPLs of 1.89%; weighted average FICO at origination was 775 and LTV 63%, with 68% of balances at 750+.
Portfolio-overview template with paired columns, QoQ strips, key statistics table and FICO bar
Indirect secured consumer loans were steady at $18.2B average and period-end in 3Q26. The NCO ratio was 0.37%, 30-89 day delinquencies 0.56% and NPLs 0.34%, with weighted average FICO at origination of 774 and LTV of 89%. 65% of the book is 750+ FICO, and the portfolio is 84% auto and 16% specialty lending (primarily RV and marine).
Portfolio-overview template plus a small grey/blue pie for the auto vs specialty lending split
Credit card balances held at about $1.6-1.7B average and period-end across the five quarters. The NCO ratio eased to 3.45% from 3.70% in 3Q25; 30-89 day delinquencies were 1.02%, 90+ delinquencies 0.96% and NPLs 1.75%. Weighted average FICO at origination was 743, and 49% of balances were 750+, 19% 720-749, 27% 660-719 and 5% below 660.
Portfolio-overview template with paired columns, QoQ strips, key statistics table and FICO bar
Solar energy installation loans declined to $4.2B average and period-end in 3Q26 from $4.4B in 3Q25, with average balances down 3.2% QoQ. The NCO ratio was 2.18% (2.25% in 2Q26, 1.47% in 3Q25), 30-89 day delinquencies 0.57% and NPLs 0.55%; weighted average FICO at origination was 771, with 66% of the book at 750+.
Portfolio-overview template with paired columns, QoQ strips, key statistics table and a three-band FICO bar
Allocation of the allowance by product at 3Q26: commercial and industrial $1,110M (1.29%), commercial mortgage $509M (1.85%), commercial construction $118M (1.32%) and commercial leases $21M (0.56%), for $1,758M (1.39%) commercial. Consumer: residential mortgage $119M (0.60%), home equity $101M (1.42%), indirect secured $316M (1.74%), credit card $147M (8.86%), solar $354M (8.44%) and other $111M (3.92%), for $1,148M (2.13%). Allowance for loan and lease losses was $2,906M (1.61%); with a $225M reserve for unfunded commitments, the allowance for credit losses was $3,131M (1.74%), down 2 bps from 2Q26 and 22 bps from 3Q25.
Full-width financial table with amount, percent of loans and two change-in-rate columns; bold subtotal and total rows
Commercial NPLs moved from $615M to $658M in 3Q26, with $213M transferred to nonaccrual, $(84)M of paydowns and $(84)M of charge-offs; 1Q26 included $170M of acquired nonaccrual loans. Consumer NPLs fell from $426M to $412M. Total NPLs were $768M, $767M, $960M, $1,041M and $1,070M over the five quarters, and new nonaccrual loans held for investment were $319M in 3Q26.
Two stacked rollforward tables (Commercial and Consumer) with blue quarter headers, plus a Total NPL summary block; section labels on the left
Commercial loans: $31.6BN fixed and $94.8BN variable (1M-based 53%, 3M 7%, prime and overnight 14%), weighted average life 1.7 years. Consumer loans: $44.6BN fixed and $9.3BN variable, weighted average life 3.9 years. Investment portfolio: 58% in bullet or locked-out cash flow securities, AFS and HTM spot yield 3.71%, AFS net unrealized pre-tax loss $4.73BN, including $2.68BN of super-senior AAA non-agency CMBS. Long-term debt: $9.2BN fixed and $7.7BN variable, 46% SOFR-based, weighted average life 3.8 years. The figures include $8.9BN of C&I and $4BN of CRE receive-fixed swaps and $7.3BN of fair value hedges on long-term debt.
Four equal columns, each with a heading, bullet list, pie chart and fixed/variable legend table; bold blue summary sentence across the bottom
Estimated NII sensitivity (FTE) for a +200 bp ramp is +0.2% in 12 months and +2.4% in months 13-24; +100 is +0.2%/+1.5%, -100 is (0.8%)/(3.2%) and -200 is (2.3%)/(8.3%), against ALCO policy limits of (9.0%) and (15.0%). Additional tables show the effect of 5% higher or lower deposit betas and of a $1BN decline or increase in demand deposits. The models assume about 65% up betas and 55-60% down betas with no deposit repricing lags; as of September 30, 2026, 58% of HFI loans were variable rate net of hedges, short-term borrowings were under 2% of funding and about $13.8BN of non-core funding matures beyond one year.
Three stacked sensitivity tables on the left two-thirds; explanatory text and bullets on the right
The $69BN securities portfolio (about 26% of interest-earning assets) is 70% AFS and 30% HTM at amortized cost as of 9/30/2026. The mix is agency CMBS 48%, agency RMBS 31%, Treasuries 11%, other 6% and non-agency CMBS 4%, with an effective duration of 4.4 (HTM 4.9, AFS 4.2). The $20.9BN HTM portfolio was reclassified in 1Q24 to reduce AOCI volatility; the $47.7BN AFS portfolio includes $2.7BN of super-senior AAA non-agency CMBS with 33% weighted average credit enhancement, 20% risk weighting and about 59% WA LTV.
Left: AFS/HTM donut above a securities-mix table; right: bulleted characteristics for HTM and AFS portfolios
The after-tax unrealized loss on AFS and HTM securities was $(5.8)B at 9/30/23, $(3.0)B at 9/30/25, $(2.9)B at 6/30/26 and $(4.1)B at 9/30/26, when the 10-year Treasury yield was 5.3%; this is about 30% capital accretion since 3Q23. Assuming the implied forward curve, the loss is projected to fall to $(4.0)B at 12/31/26, $(3.4)B at 12/31/27 (about 17% accretion), $(2.4)B at 12/31/29 (about 41%) and $(1.7)B at 12/31/31 (about 60%).
Two downward column charts side by side (grey historical, navy projected) separated by a dashed divider, with 10-year yields listed underneath
Tangible book value per share was $17.64 at 12/31/2023, $18.69 at 12/31/2024 (+6%), $22.60 at 12/31/2025 (+21%) and $22.01 at 9/30/2026 (-3%). From AOCI burndown alone, with no earnings contribution from 2026-2029, it is projected at $22.14 at 12/31/2026, $22.92 at 12/31/2027, $23.76 at 12/31/2028 and $24.39 at 12/31/2029, with the 10-year Treasury yield assumed between 5.3% and 5.7%.
Eight navy columns with dashed growth arrows between them, a vertical dashed line splitting actuals from forecast, blue AOCI accretion caps and green-ring yield markers
End-of-period notional value of receive-fixed cash flow hedges is $13B at 3Q26 and rises with forward-starting swaps to $15B in 4Q26, $19B in 1Q27, $20B in 2Q27 and a $21B peak in 3Q27, then steps down to $9B by 4Q31. The weighted average receive-fixed rate is 3.40% in 3Q26 and ranges from 3.49% to 3.88% over the projection.
Stacked column chart (existing swaps in blue, forward-starting in green, actual in grey) with axis breaks; weighted average rate row beneath
Mortgage banking net revenue was $58M, $56M, $44M, $39M and $47M over the five quarters; in 3Q26 it comprised $18M of origination fees and gains on sale, $69M of gross servicing fees and $(40)M of MSR decay. Mortgage originations were $2.3B in 3Q26 ($1.4B held for sale, $0.8B held for investment), with a 1.28% rate lock margin and a 0.93% gain-on-sale margin.
Left: stacked positive/negative column chart with a revenue total row; right: stacked originations columns with a two-row margin table
Expected preferred dividends from 4Q26 to 3Q27: Series H (floating) about $11-12M per quarter, Series I (floating) $9-10M, Series J (floating) $6M, Series K $3M, Series M $7M and Class B Series A $3M, totaling about $39M, $39M, $40M and $41M. Series M was issued in exchange for Comerica's Series B preferred stock when the merger closed on February 1, 2026.
Full-width table with blue quarter headers and alternating light rows; series names centered in the first column
Adjusted EPS was $1.13. Reported EPS of $0.90 included a net negative $0.23 impact from $225 million pre-tax (about $171 million after-tax) of merger-related charges, $34 million pre-tax (about $26 million after-tax) related to interchange litigation, and $19 million pre-tax (about $14 million after-tax) of technology-related asset impairments.
Blue title bar with subtitle; one bold blue lead sentence and three bullets on an otherwise open white slide
Five-quarter reconciliation from GAAP net income ($866M in 3Q26, $801M in 2Q26, $165M in 1Q26, $731M in 4Q25, $649M in 3Q25) to adjusted net income ($1,076M in 3Q26). Pre-tax adjustments include merger-related charges ($225M in 3Q26, $203M in 2Q26, $657M in 1Q26) and an $83M merger-related Day 1 ACL build in 1Q26. Average assets were $302,119M in 3Q26 versus $211,770M in 3Q25. Metrics for 3Q26: ROA 1.14% (adjusted 1.41%), ROE 10.2% (12.8%), ROTCE 16.6% (20.6%) and adjusted ROTCE excluding AOCI 17.4%.
Dense full-slide financial table with blue quarter headers, grey shaded subtotal rows and lettered formula references
Average interest-earning assets were $270,023M in 3Q26. GAAP NII of $2,271M plus a $5M taxable-equivalent adjustment gives FTE NII of $2,276M. Noninterest income of $1,008M reconciles to $1,052M adjusted, and noninterest expense of $2,049M to $1,816M adjusted (after $(215)M of merger-related charges and other items). Revenue (FTE) was $3,284M (adjusted $3,328M), PPNR $1,235M (adjusted $1,512M), NIM 3.34%, efficiency ratio 62.4% and adjusted efficiency ratio 54.6%.
Full-slide reconciliation table with bold section rows and a Metrics block at the bottom
End notes for slides 3 through 17, mostly pointing to the non-GAAP reconciliations on pages 40-41 and pages 27-29 of the earnings release. They note that current-period regulatory capital ratios are estimated, that fully-phased CET1 is based on the March 19, 2026 Basel III standardized approach proposal, that 1Q26 excludes $21 million of net charge-offs taken immediately at the time of the merger, and that LTM fee figures are pro forma for Fifth Third and Comerica as of September 30, 2026.
Navy title on white with small grey text grouped by slide number
End notes for slides 18 through 29: definitions of the NCO and NPL ratios, restatement of 1Q26 and 2Q26 line utilization to Fifth Third methodology, NDFI loans estimated from Call Report schedule RC-C captions with peer data as of 6/30/2026, FICO distributions excluding certain acquired loans, and a split of the unfunded commitment reserve into about $185M commercial and $40M consumer.
Navy title on white with small grey text grouped by slide number
End notes for slides 30 through 41: $12.85BN of commercial variable loans classified as fixed due to swaps (excluding $8BN of forward-starting swaps), $7.3BN of SOFR receive-fix swaps against long-term debt, rate-risk modeling assumptions on beta floors and caps, forward-curve assumptions for the AOCI and TBV projections, and Series M preferred terms. They also list 917,103 thousand average diluted shares and a 24% tax rate assumption for adjustments.
Navy title on white with small grey text grouped by slide number
คำถามทั่วไปเกี่ยวกับสไลด์นี้และเนื้อหาการนำเสนอพื้นฐาน
It is the 44-slide 3Q26 Earnings Presentation that Fifth Third Bancorp released on October 19, 2026 and filed with the SEC as Exhibit 99.2 to a Form 8-K. It covers quarterly highlights, net interest income, fees, expenses, loans, deposits, credit quality, capital and liquidity, and 4Q26 guidance, followed by an appendix of portfolio, balance sheet, hedging and non-GAAP reconciliation slides.
Reported EPS was $0.90 and adjusted EPS $1.13. Net interest income was $2.28 billion with a 3.34% NIM, adjusted ROTCE 20.6%, adjusted ROA 1.41%, adjusted efficiency ratio 54.6%, adjusted PPNR $1,512 million, net charge-offs 31 bps and CET1 10.0%.
The key messages say the Comerica systems integration is complete and the full $850 million expense synergy run-rate is locked in for 4Q26. The deck reports about $1.04 billion of merger-related charges year to date and $225 million pre-tax in 3Q26. The five-quarter charts show the step-up in loans, deposits and fees from 1Q26, when the merger closed on February 1, 2026.
Average loans up 1-2%, net interest income up 2.5-3.5% from $2.28 billion, noninterest income up 2-4% from $1.05 billion, noninterest expense down 2-3% from $1.82 billion, a net charge-off ratio of 30-35 bps and a 22.5% effective tax rate.
Yes. The page offers the original PDF and an editable PPTX. The PPTX was converted from the SEC-filed PDF, not supplied by Fifth Third as an original template. Because the filed slides are rasterized images, most slides in the PPTX are image-based, and you may need to rebuild charts and text boxes to edit them in detail.
The SEC version of the deck was filed as rasterized slide images, so small print such as the cautionary statement and end notes (pages 2 and 42-44) is low-contrast at normal size. Zoom into the slide images or download the PDF to read them, and see the company's earnings release for the full non-GAAP discussion.
The reported-vs-adjusted highlights table (page 4), the NII and NIM walk (page 5), the credit quality overview (page 10), the CET1 waterfall (page 12), the guidance table (page 13) and the repeatable portfolio-overview layout (pages 17-28) adapt well to other banks' quarterly or board presentations.
Bank analysts and investors following Fifth Third or US regional banks, IR and finance teams benchmarking earnings decks, students learning bank financial statements and rate risk, and designers who need a clean, data-dense financial presentation reference.
Original filing of the October 19, 2026 earnings presentation

Create Your Own Slides
Turn your ideas into professional presentations in seconds with 2slides AI.
อ้างอิงการออกแบบมืออาชีพ เลือกสไตล์ของคุณ และสร้างสไลด์ด้วยการแสดงผลข้อความที่สมบูรณ์แบบ ขับเคลื่อนโดย Nano Banana—เริ่มสร้างการนำเสนอของคุณตอนนี้
เอเจนต์ AI ของคุณสำหรับสไลด์ ประหยัดเวลา เปล่งประกายเร็วขึ้นด้วยการสร้างงานนำเสนออัจฉริยะ


© 2026 2slides สงวนลิขสิทธิ์