
อยู่ในคอลเลกชัน ตัวอย่างงานนำเสนออีคอมเมิร์ซ
E-commerce Quarterly Business Review (QBR) example for a DTC coffee brand, Q3 2026 — a sample deck made with 2Slides for the fictional brand Fernbrook Coffee Co., with illustrative figures only
เปิดตัวแก้ไขพร้อมโครงร่างและสไตล์การออกแบบของงานนำเสนอนี้ที่กรอกไว้แล้ว แทนที่โครงร่างด้วยเนื้อหาของคุณเอง หรือเลือกหน้าใดก็ได้ด้านล่างเพื่อใช้เลย์เอาต์ของหน้านั้นเป็นต้นแบบ
การนำทางด่วน
แท็ก
แชร์สไลด์
งานนำเสนอนี้สร้างด้วย 2Slides จากโครงร่างและสไตล์การออกแบบด้านล่าง ใช้สูตรนี้เพื่อเปิดตัวแก้ไขพร้อมข้อมูลทั้งสองส่วนที่กรอกไว้แล้ว จากนั้นแทนที่ส่วนที่อยู่ในวงเล็บด้วยเนื้อหาของคุณเอง
8 สไลด์ · 16:9 · 2K
Quarterly business review for [Brand name], a direct-to-consumer brand selling through [channels, e.g. its own online store, Amazon and wholesale]. [Quarter and year]. Audience: founders and the leadership team.

Page 1 - Cover: [Brand name] / [Quarter] Business Review / [Month year].

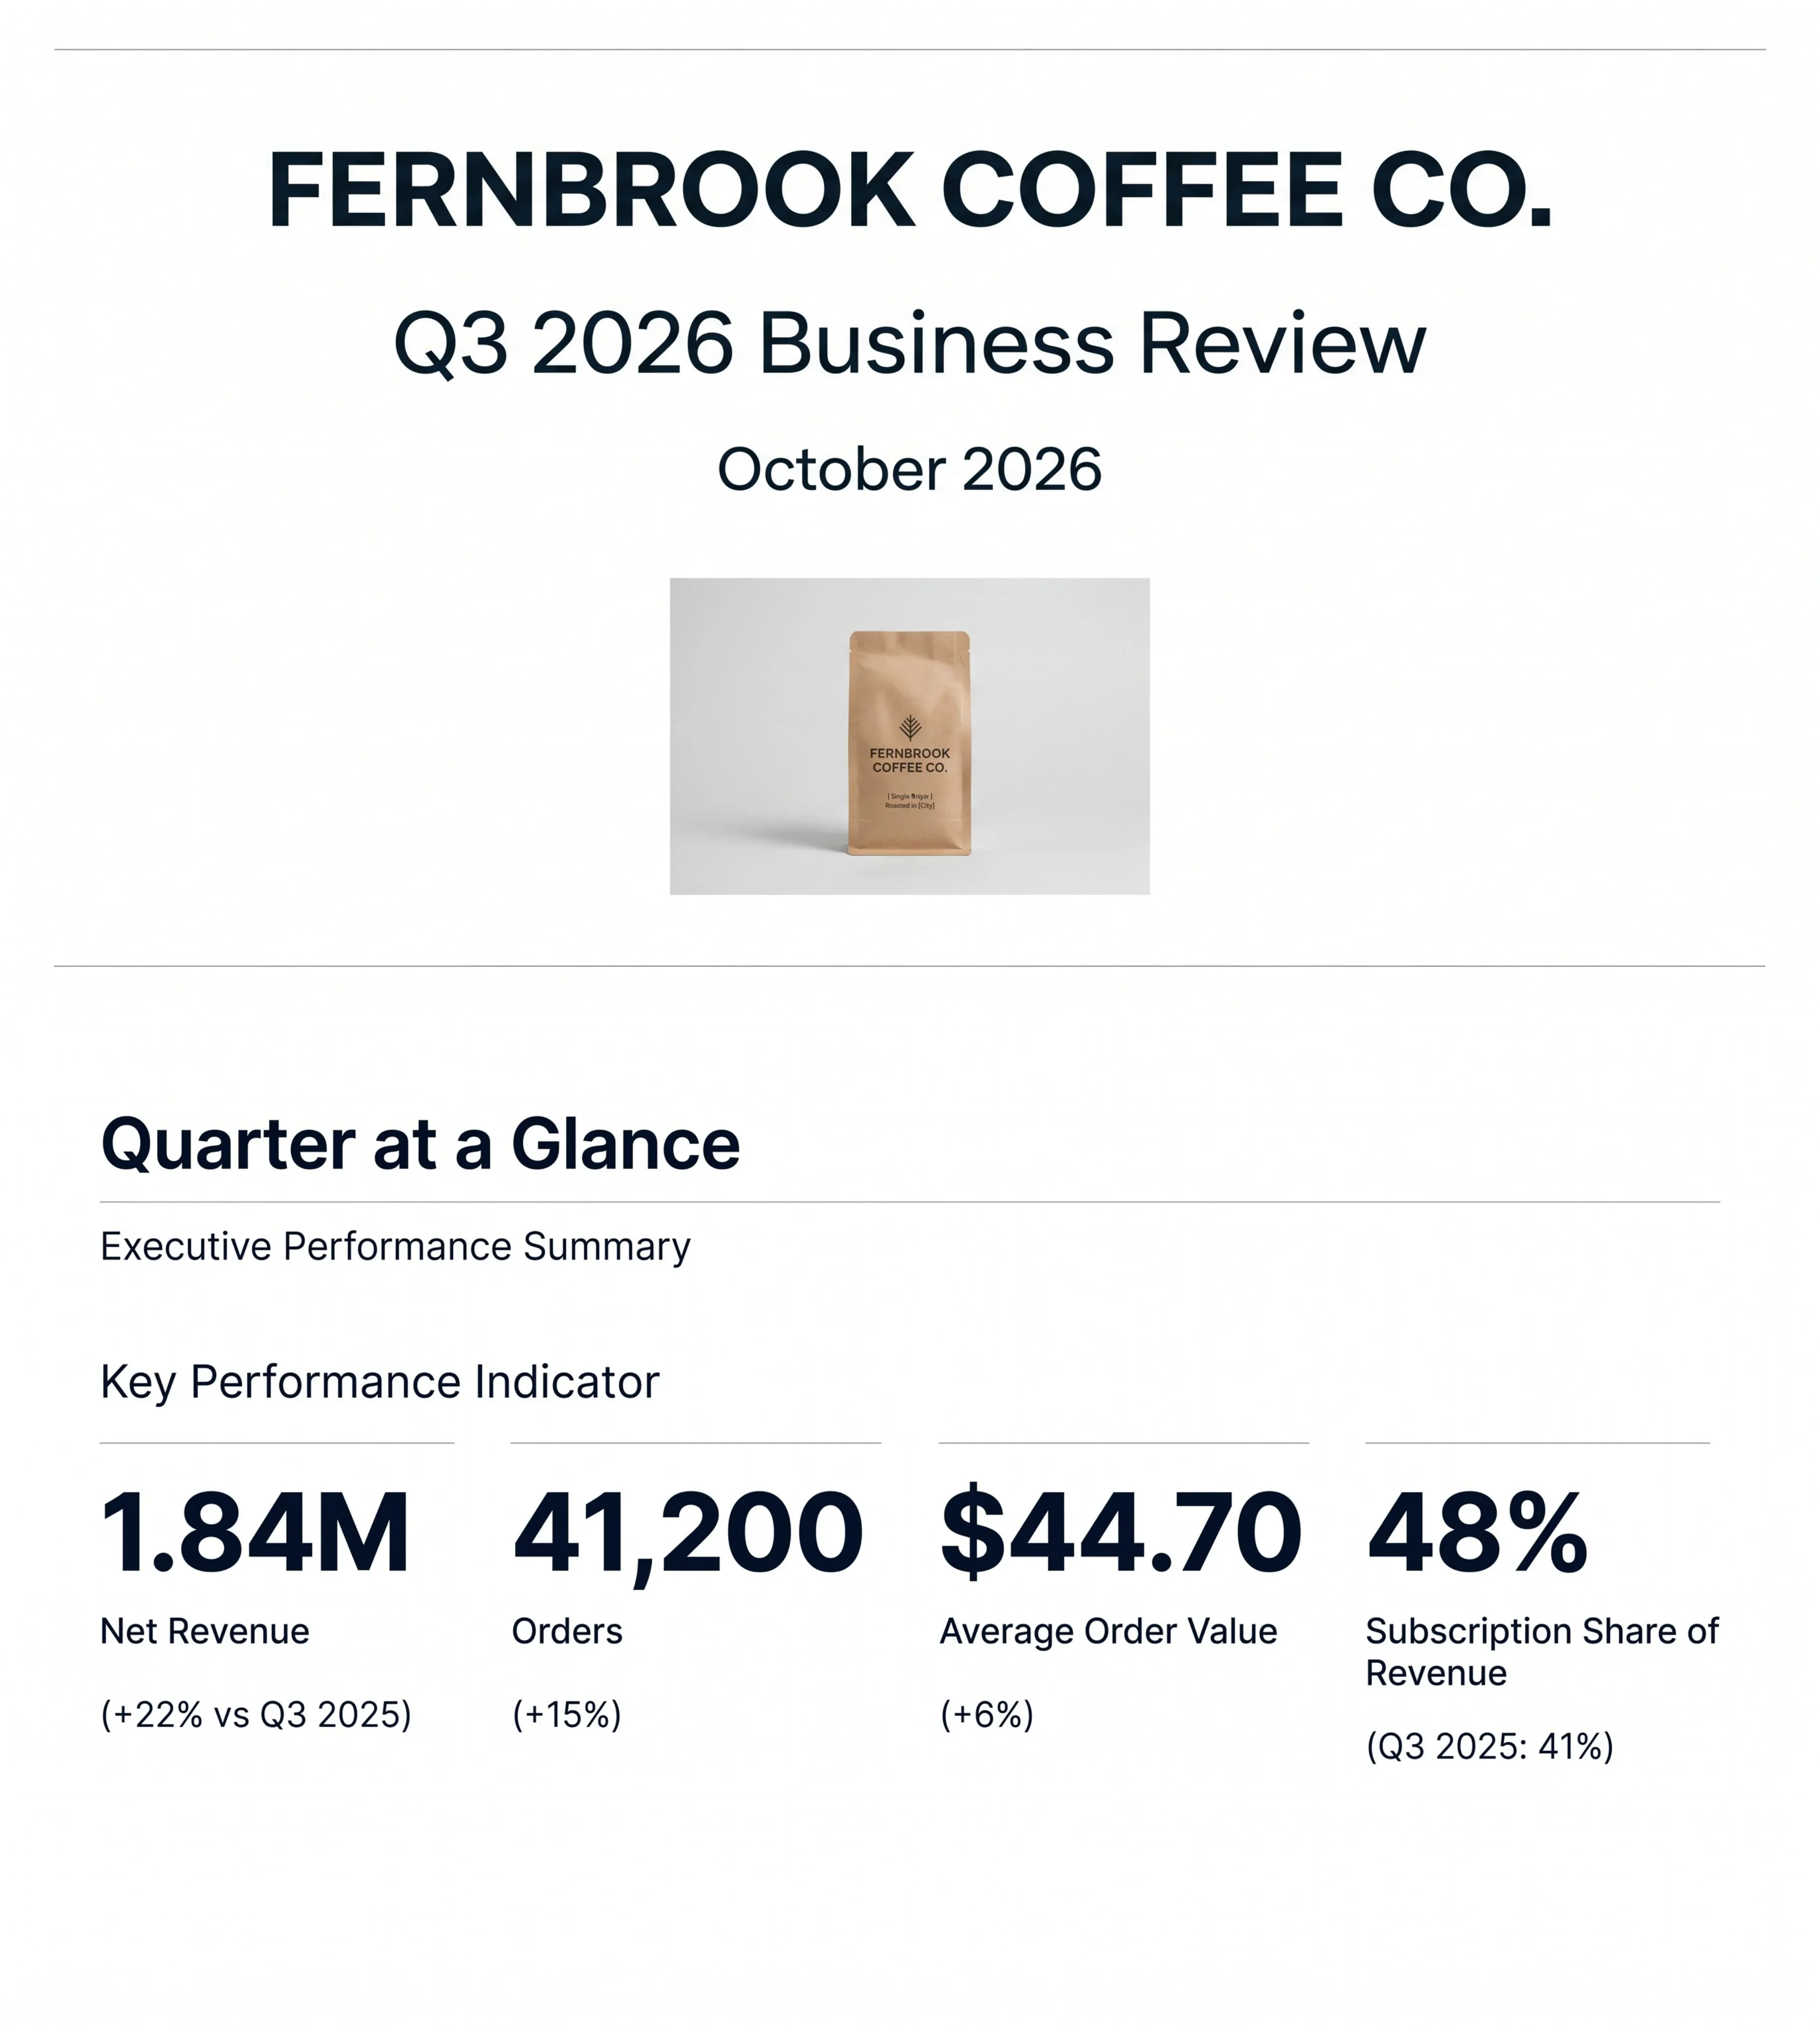
Page 2 - Quarter at a glance (four large KPI figures): Net revenue $[amount] ([+/-x%] vs last year). Orders [number] ([+/-x%]). Average order value $[amount] ([+/-x%]). [Fourth KPI, e.g. subscription share of revenue] [value] ([comparison]).

Page 3 - Revenue by month (bar chart): [Month 1] $[amount], [Month 2] $[amount], [Month 3] $[amount]. Note beside the chart: [what drove the change].

Page 4 - Revenue by channel (bar chart plus a table): [Channel 1] $[amount] ([x%]). [Channel 2] $[amount] ([x%]). [Channel 3] $[amount] ([x%]).

Page 5 - Customers (four figures): New customers [number]. Returning customers [number]. Repeat purchase rate [x%]. [Churn or another retention metric] [value] ([comparison]).

Page 6 - Marketing efficiency (simple table): [Channel] - spend $[amount], new customers [number], CAC $[amount]. [Channel] - spend $[amount], new customers [number], CAC $[amount]. [Channel] - spend $[amount], new customers [number], CAC $[amount]. Blended CAC $[amount] ([comparison]). Blended ROAS [x]x.

Page 7 - Top products (table of five): [Product] - $[revenue]. [Product] - $[revenue]. [Product] - $[revenue]. [Product] - $[revenue]. [Product] - $[revenue].

Page 8 - [Next quarter] priorities and targets: (1) [priority]. (2) [priority]. (3) [priority]. (4) [revenue or growth target].
Modern minimal business review. White background, generous margins, thin grey hairlines, one dark ink for text. Large bold numerals for KPIs with small labels beneath. Charts are flat and simple with clearly labelled bars and values, no 3D, no gradients, no shadows. Tables with light grid lines and right-aligned numbers. Occasional small product photo of a coffee bag only where it helps (cover and top-products page). No clipart, no icons collage. Never print colour codes, style instructions or parameter names as text.
E-commerce Quarterly Business Review (QBR) example for a DTC coffee brand, Q3 2026 — a sample deck made with 2Slides for the fictional brand Fernbrook Coffee Co., with illustrative figures only
มุมมองรายละเอียดของแต่ละหน้าสไลด์ รวมถึงlayout เนื้อหาหลักและองค์ประกอบภาพ
Title slide for the fictional DTC specialty coffee brand Fernbrook Coffee Co., labelled 'Q3 2026 Business Review' and dated October 2026 — i.e. the review is held in the first weeks after the quarter closes, which is the normal timing for an e-commerce QBR. A product photo of a kraft-paper coffee bag with a simple leaf mark establishes the brand without needing a logo slide. As with the rest of this sample deck, the brand and all figures are invented for illustration.
Centered single-column layout framed by thin horizontal rules at top and bottom: large bold brand name, a lighter-weight subtitle with the quarter, the date line, and a centered product image below.
The executive summary leads with four headline KPIs, each with a comparison: net revenue of 1.84M (+22% vs Q3 2025), 41,200 orders (+15%), an average order value of $44.70 (+6%), and a subscription share of revenue of 48% (up from 41% in Q3 2025). This is the slide that answers 'how did the quarter go?' in ten seconds. Note how the four metrics decompose each other: revenue growth (+22%) is roughly order growth (+15%) compounded with AOV growth (+6%), so the slide tells the audience that growth came from both more orders and bigger baskets, while the subscription share shows revenue is becoming more recurring.
Title and subtitle at top, a 'Key Performance Indicator' label, then a four-column KPI row; each column has a thin rule, a very large numeral, the metric name and the year-over-year comparison in parentheses.
A monthly breakdown of the quarter: July $0.58M, August $0.60M and September $0.66M, which add up to the $1.84M quarterly net revenue shown on the previous slide. A 'Strategic Note' at the bottom explains the September step-up: it includes the impact of the Fall Harvest product launch. Pairing a chart with a one-line explanation of the biggest movement is a good QBR habit — it pre-empts the first question leadership will ask.
Title with divider at top; left column holds the 'Monthly Performance Comparison' label, right two-thirds holds a three-bar vertical bar chart with value labels above each bar; a full-width divider and a bold-labelled strategic note sit at the bottom.
Splits revenue across the brand's three sales channels: own online store $1.21M (66%), Amazon $0.42M (23%) and wholesale cafes $0.21M (11%), again summing to $1.84M. For a DTC brand this is a key health check — a two-thirds share through the owned store means the brand keeps customer data and margin, while Amazon and wholesale act as reach and volume channels. The slide shows each channel twice: as big headline numbers for the room, and as a proportional horizontal bar chart so the relative size is obvious.
Upper band: three equal columns separated by vertical rules, each with a large dollar figure, channel name and percentage share. Lower band: 'Revenue Distribution Across Channels' horizontal bar chart with channel labels on the left and value-plus-percentage labels at the end of each bar.
Four customer metrics: 9,800 new customers, 14,300 returning customers, a 58% repeat purchase rate, and monthly subscriber churn of 4.1%, improved from 4.9% in Q2 2026. Returning customers outnumbering new ones, plus falling churn, signal that the subscription programme is working. This slide separates 'how many people did we win' from 'how many did we keep', which is the distinction most e-commerce reports blur when they only show total orders.
Bold title and subtitle at top with a divider; a four-column row of oversized numerals with centered labels below; the churn metric carries a prior-quarter comparison underneath.
A channel performance table lists spend, new customers and customer acquisition cost (CAC) by channel: paid social $142K spend, 3,900 new customers, $36 CAC; search $88K, 2,900, $30; influencer $46K, 1,100, $42. Below, 'Efficiency Totals' shows a blended CAC of $34 (down from $39 in Q2 2026) and a blended ROAS of 3.4x. The table makes the trade-off visible: search is the cheapest channel per customer, influencer the most expensive. The paid channels account for 7,900 of the 9,800 new customers on the previous slide, with the remainder implicitly coming from organic and other sources.
Title and subtitle with divider; a 'Channel Performance Breakdown' four-column bordered table (Channel, Spend, New Customers, CAC) with right-aligned numbers; an 'Efficiency Totals' section with two large centered KPIs side by side.
Ranks the five best-selling SKUs by quarterly revenue: Fernbrook House Blend 12oz $412K, Fall Harvest Single Origin 12oz $236K, Decaf Night Owl 12oz $168K, Cold Brew Pack x6 $131K and Pour-Over Starter Kit $97K. The hero product is highlighted with a packshot and a large '$412K Revenue' figure. The Fall Harvest SKU ranking second ties back to the September launch noted on the revenue trend slide, so the deck's story stays connected from slide to slide.
Title with divider; left side is a horizontal bar chart of five SKUs with value labels; right side stacks a product image with a large hero revenue figure above a ranked two-column table repeating the top five.
Closes the review by turning results into commitments for the next quarter: holiday gift sets live by 1 November, grow subscription share to 52% (from 48%), hold blended CAC at or below $35, and a Q4 revenue target of $2.3M. Two of the targets are pulled out as big numbers — a 52% subscription share target and a $35 blended CAC ceiling — so the team leaves with measurable goals that can be checked at the next QBR.
Centered two-line title; below, a two-column split framed by horizontal rules: left half shows two oversized target numerals with labels, right half is a ruled list of four bullet priorities.
คำถามทั่วไปเกี่ยวกับสไลด์นี้และเนื้อหาการนำเสนอพื้นฐาน
No. Fernbrook Coffee Co. is a fictional direct-to-consumer coffee brand, and this deck is an example made with 2Slides. All revenue, order, customer, CAC and ROAS figures are illustrative and were chosen to be realistic and internally consistent, not taken from any real business.
A solid e-commerce QBR usually covers: headline KPIs (net revenue, orders, average order value, and subscription or repeat share), the revenue trend by month, revenue by sales channel (own store, marketplaces like Amazon, wholesale), customer acquisition and retention (new vs returning customers, repeat purchase rate, churn), marketing efficiency (spend, CAC by channel, blended CAC, ROAS), top products by revenue, and targets for the next quarter. This example follows exactly that order in 8 slides.
It moves from outcome to cause to action. Slide 2 says how the quarter went, slides 3–4 show when and where revenue came from, slides 5–6 explain who bought and what it cost to win them, slide 7 shows which products drove it, and slide 8 converts the findings into Q4 targets. Each data slide also includes a comparison to last year or last quarter so the numbers have context.
Yes. The structure maps directly onto a Shopify store report: replace the monthly bars with weekly figures for a monthly report, swap the channel split for your own sales channels, and fill the customer and marketing slides from your Shopify analytics and ad platforms. The PPTX download is editable in PowerPoint, Keynote or Google Slides.
Yes. A similar QBR can be created in 2Slides by uploading a sales export or spreadsheet (for example a Shopify orders export, an Amazon Seller Central report or a CSV of channel and marketing spend) and asking for a quarterly business review. 2Slides generates the KPI slides, charts and tables; you then review the numbers and edit as needed.
Channel CAC divides one channel's spend by the new customers it brought in (for example $88K search spend / 2,900 customers ≈ $30). Blended CAC divides total marketing spend by total new customers across channels. Showing both, as slide 6 does, tells you which channels to scale and whether overall acquisition is getting cheaper.
DTC and Shopify brand founders, e-commerce and growth managers, agencies reporting to e-commerce clients, and board members or investors who want to see a clear, compact format for reviewing an online brand's quarter.
The deck is available as a PDF and as an editable PPTX file. The design is a minimalist navy-on-white style with large KPI numbers, simple bar charts and clean tables, so it adapts easily to any brand's colours.

Create Your Own Slides
Turn your ideas into professional presentations in seconds with 2slides AI.
อ้างอิงการออกแบบมืออาชีพ เลือกสไตล์ของคุณ และสร้างสไลด์ด้วยการแสดงผลข้อความที่สมบูรณ์แบบ ขับเคลื่อนโดย Nano Banana—เริ่มสร้างการนำเสนอของคุณตอนนี้
เอเจนต์ AI ของคุณสำหรับสไลด์ ประหยัดเวลา เปล่งประกายเร็วขึ้นด้วยการสร้างงานนำเสนออัจฉริยะ


© 2026 2slides สงวนลิขสิทธิ์