
อยู่ในคอลเลกชัน ตัวอย่างงานนำเสนอสำหรับนักลงทุน
Axon Enterprise (NASDAQ: AXON) Q3 2026 Investor Presentation (Investor Deck, November 2026): the public safety technology company behind TASER devices, Axon body cameras and the Axon Cloud software platform presents its mission, integrated hardware and software ecosystem, US$159B total addressable market, Q3 2026 results (US$909M quarterly revenue, up 28% year over year), forward-looking indicators (US$1.8B ARR, 126% net revenue retention, US$15.8B future contracted bookings), raised FY2026 guidance of US$3.61-3.63B revenue, and a 2028 target model of US$6B revenue at a 28% Adjusted EBITDA margin.
ใช้หน้าปกของงานนำเสนอนี้เป็นต้นแบบสไตล์สำหรับสไลด์ที่สร้างจากเนื้อหาของคุณเอง หรือเลือกหน้าใดก็ได้ด้านล่างเพื่อใช้เลย์เอาต์ของหน้านั้นเป็นต้นแบบ
การนำทางด่วน
แท็ก
แชร์สไลด์
Axon Enterprise (NASDAQ: AXON) Q3 2026 Investor Presentation (Investor Deck, November 2026): the public safety technology company behind TASER devices, Axon body cameras and the Axon Cloud software platform presents its mission, integrated hardware and software ecosystem, US$159B total addressable market, Q3 2026 results (US$909M quarterly revenue, up 28% year over year), forward-looking indicators (US$1.8B ARR, 126% net revenue retention, US$15.8B future contracted bookings), raised FY2026 guidance of US$3.61-3.63B revenue, and a 2028 target model of US$6B revenue at a 28% Adjusted EBITDA margin.
มุมมองรายละเอียดของแต่ละหน้าสไลด์ รวมถึงlayout เนื้อหาหลักและองค์ประกอบภาพ
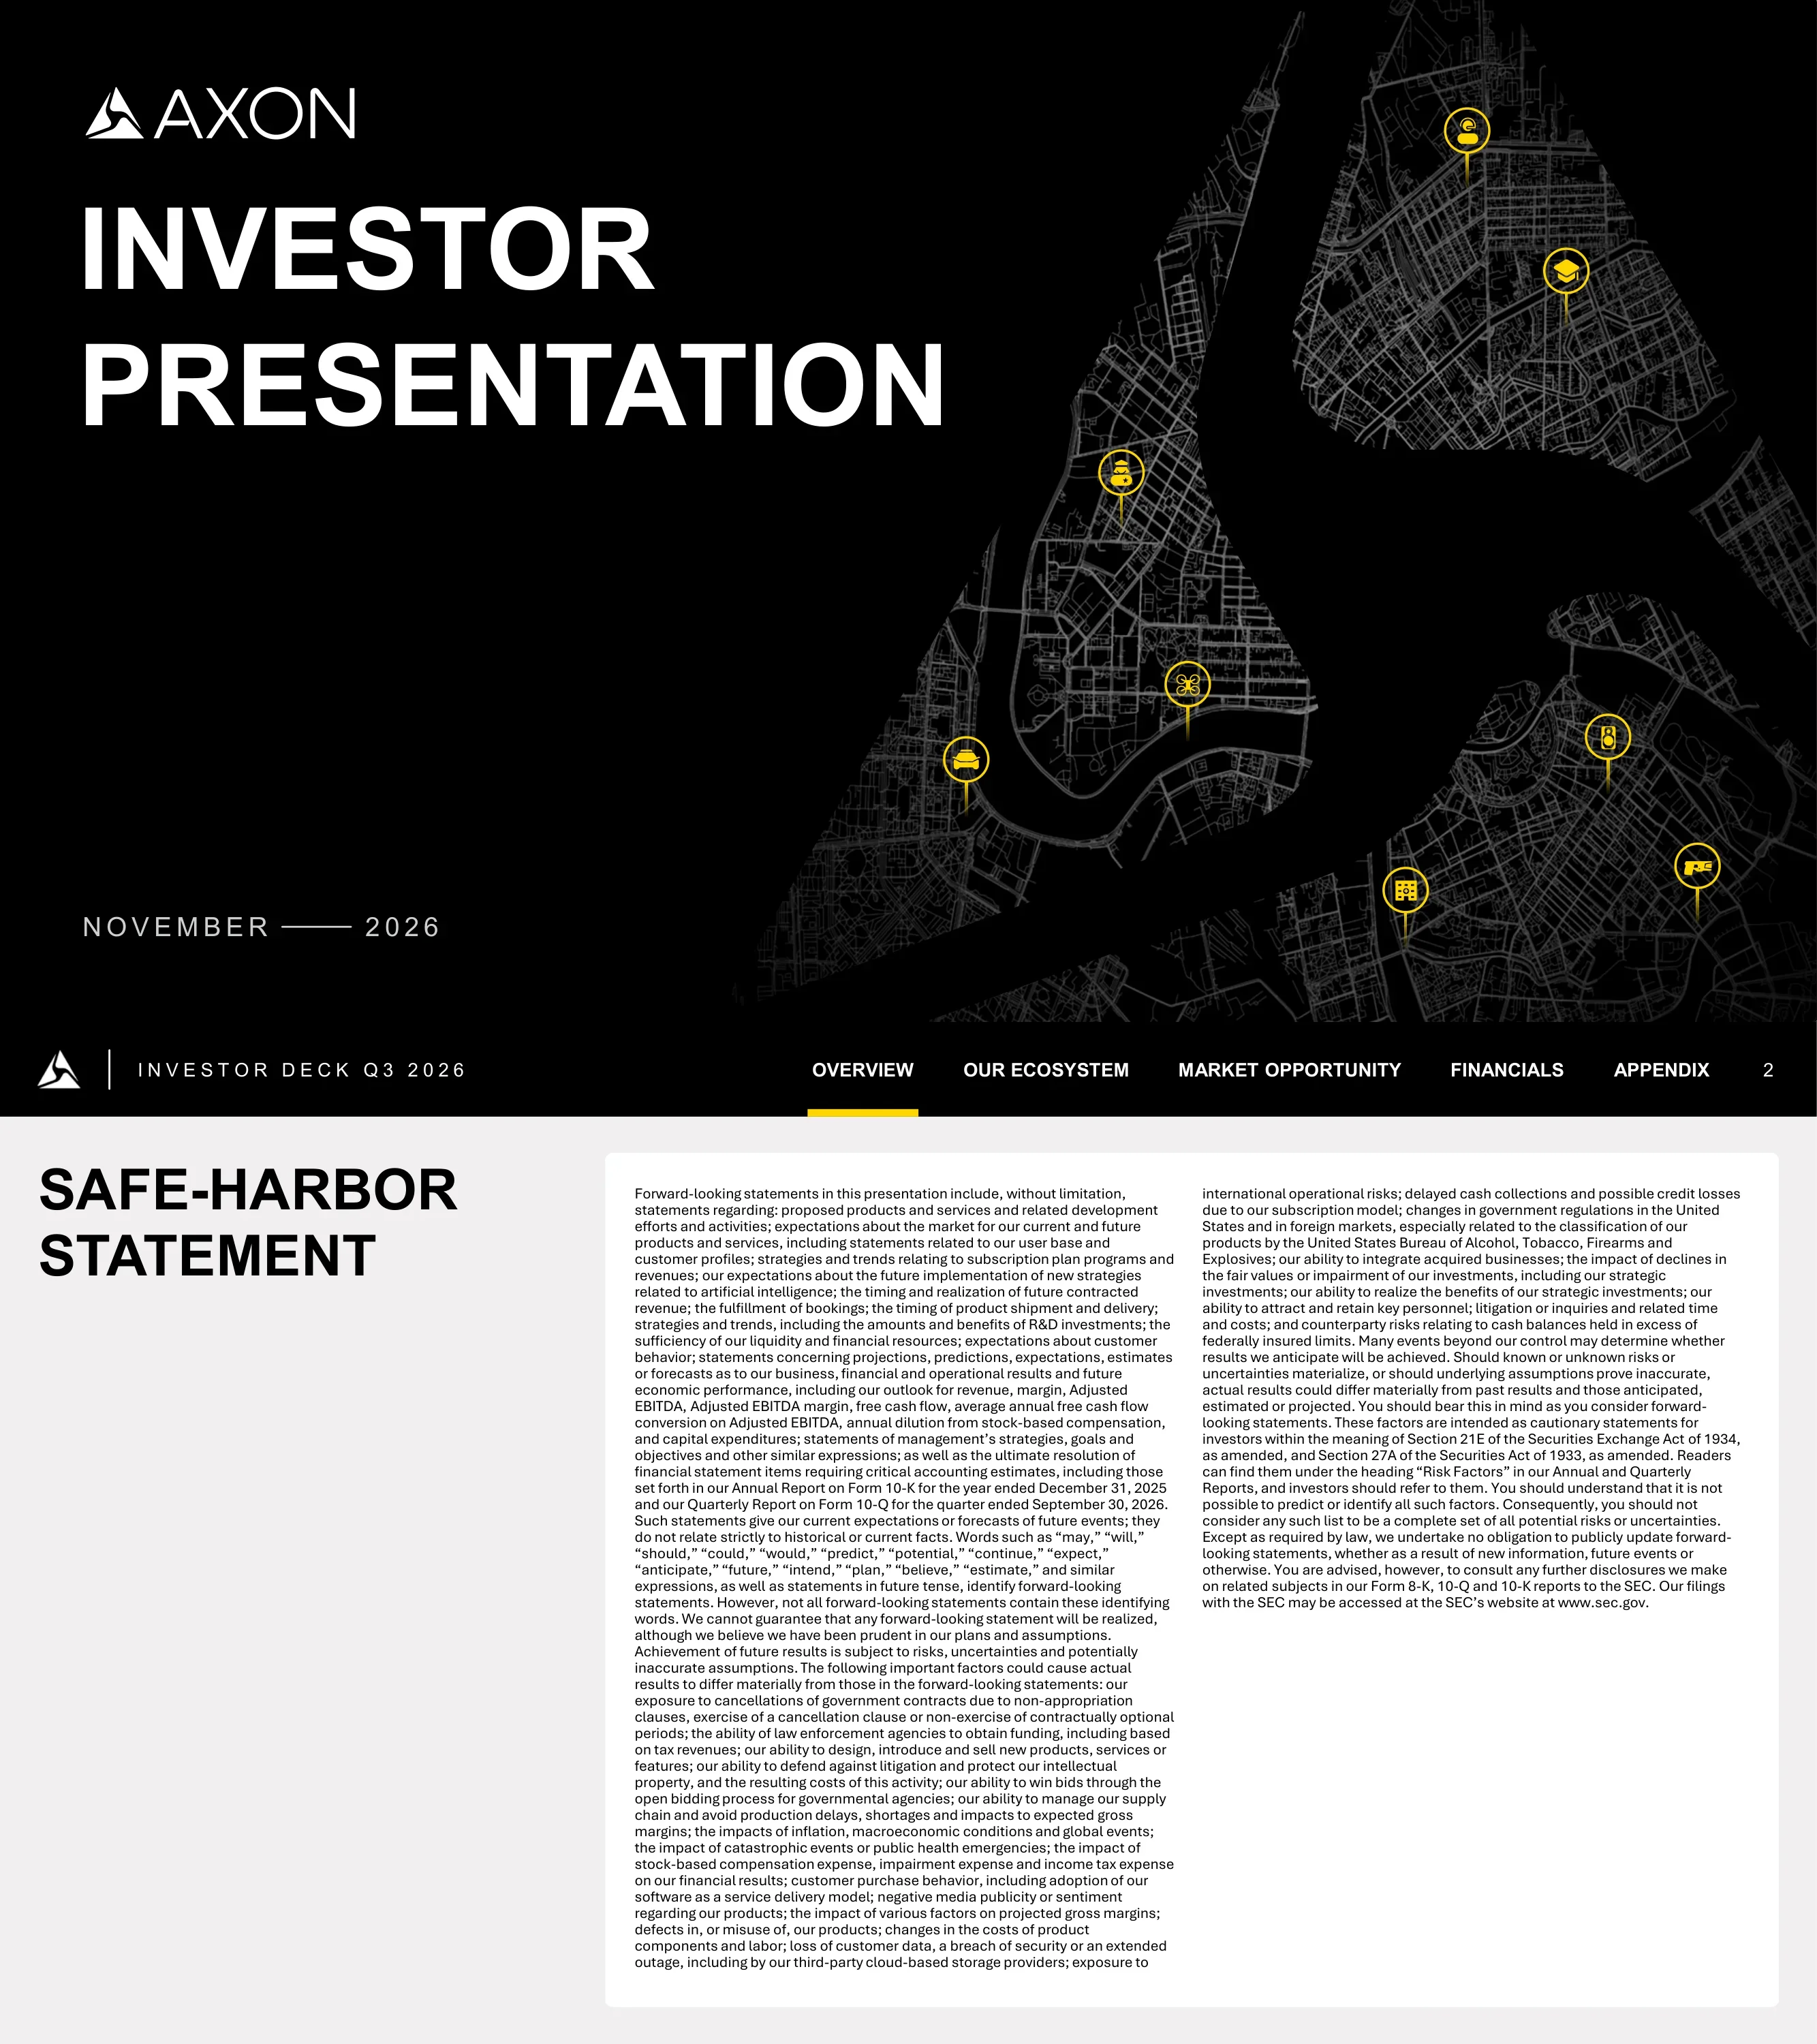
Cover slide with the Axon logo, the title Investor Presentation and the date November 2026.
Full-bleed black background with large left-aligned white title and a dark street-map graphic shaped like the Axon triangle mark on the right, dotted with yellow location pins.
Forward-looking statements disclaimer covering products, AI strategy, bookings, guidance and risk factors, referencing the 2025 Form 10-K and the Form 10-Q for the quarter ended September 30, 2026.
Top navigation bar with five section tabs and page number; large bold title on the left and a white two-column text panel on the right.
Section divider opening the Overview chapter.
Large black rounded panel with the section name and street-map texture, plus two stacked black-and-white photos on the right.
States Axon's moonshot goal, charts combined US gun fatalities between police and the public from 2015 to 2025, notes a nearly 10% decline in 2025, and quotes a sheriff citing a 42% reduction in deputy-involved shootings attributed partly to TASER 10.
Dark slide with an oversized headline on the left, a line chart spanning the bottom and a translucent quote card over a moon image on the right.
Describes Axon as building the operating system for public safety: a technology platform, mission-driven to protect life, capture truth and accelerate justice, a market leader in cloud-powered hardware and software, with an attractive financial profile. Key numbers: US$159B TAM, 1M+ software users and 1M+ TASER devices sold.
Three columns: title and officer photo on the left, four checkmark statements in the middle, and a black TAM card above a yellow By the Numbers card on the right.
Four customer segments: US State & Local (over 17,000 agencies across law enforcement, corrections, justice and fire & EMS), US Federal (FedRAMP High cloud, leading counter-drone provider), International (deployed in more than 85 countries) and Enterprise (workplace safety for retail, healthcare and logistics).
Four equal cards, each with a yellow header, a black-and-white portrait photo and two short text statements.
Six headline metrics: US$2.8B 2025 annual revenue, US$1.8B annual recurring revenue, US$159B TAM, 25.5% 2025 Adjusted EBITDA margin, 126% net revenue retention and US$15.8B future contracted bookings.
Title and drone-pilot photo on the left; 3x2 grid of white KPI tiles on the right.
Section divider opening the Our Ecosystem chapter.
Black map panel with large two-line title and two stacked photos on the right.
Usage proof points as of December 31, 2025: a live TASER 10 cartridge fired nearly every 30 seconds in the US, 400K+ VR training sessions, over 60 million hours of Axon Body 3 and Body 4 recordings, 1 million monthly Fusus livestreams, 300K+ community cameras connected and 200K monthly Axon Assistant messages.
City skyline photo on the left, six checkmark statements in the middle, and a mosaic on the right pairing yellow Protect Life / Capture Truth / Accelerate Justice tiles with product images.
Ecosystem map organized as Sense (fixed cameras/ALPR, drones, body cameras, in-car cameras, emergency call center, real-time crime centers), Respond (TASER devices, drones as first responder, counter-drone, tactical drone, training, communications) and Resolve, all built on the Axon Platform Foundation: Axon Records, AI Era, Axon Fusus, Axon Justice, Axon Evidence and Axon 911.
Symmetric infographic: blue glowing nodes on the left, orange nodes on the right converging on a central brain-shaped network with the Axon logo, and a platform foundation bar along the bottom.
Step-by-step incident timeline: a 911 call starts an AI-assisted workflow, the real-time crime center pulls in camera feeds, a remote drone is dispatched and streams live video, in-car cameras add data, an officer arrives with an AI-enabled body camera and TASER, video uploads to Evidence.com, and reports flow into records and justice workflows.
Horizontal timeline with alternating white and yellow callouts on vertical stems above a yellow sound-wave band labelled Sense, Respond and Resolve, with an officer photo at center.
Counter-drone scenario at a stadium: a drone threat is detected by Dedrone Tracker AI, the aircraft and operator location are identified, security reaches the pilot, Dedrone Defender delivers precise interference and the disruption ends in about three minutes.
Timeline from 0:00 to 3:00 over a yellow waveform, with a sensor tower, a hostile drone and a stadium under a protective dome on the right.
Enterprise retail scenario: associates train in VR, an incident occurs, the security team is alerted, details are summarized, law enforcement is dispatched, and a post-incident report links the event to a series of crimes; a body-worn camera with AI Assistant helps the associate communicate and document.
Pre-incident to post-incident timeline over the yellow waveform, with a retail associate wearing a body camera on the left and a yellow callout box.
Six customer testimonials: Redaction Assistant cut redaction time 75% (Rowlett PD), Draft One cut report-writing time 67% (Fort Collins PD), Fleet 3 ALPR equals five officers (Fairfax County PD), 400+ unauthorized drone detections with Dedrone (Tulsa State Fair), TASER 10 "a no-brainer" (Scottsdale PD) and Fusus sped stolen-vehicle recovery by 32 minutes (Cobb County PD).
Title and laptop photo on the left; 2x3 grid of white quote cards with yellow icons on the right.
Section divider opening the Market Opportunity chapter.
Black map panel with large title and two stacked photos on the right.
Five growth drivers: upgrade products, create new categories (AI, drones, robotic security), modernize antiquated technologies, solve universal problems beyond law enforcement, and expand globally, each with a one-line takeaway.
Five vertical cards with yellow headers, photos, descriptive text and grey summary boxes beneath.
US$159B TAM split by end customer (US State & Local US$19B, Enterprise US$48B, International Government US$76B, US Federal US$12B, Civilian US$5B) and by product area (DEMS + add-ons US$41B, TASER & training US$14B, body camera US$13B, AI plans US$17B, real-time operations US$25B, drones & robotics US$20B, vehicle intelligence US$30B). US State & Local law enforcement TAM (about US$15B) is under 15% penetrated.
Two horizontal stacked bars with legends on the left, a yellow penetration callout, and a large yellow circle with the TAM total on the right.
Line chart of US public safety spending growth from 1978 to 2020 (corrections, aggregate public safety, fire, police vs. US GDP) showing durable budget growth over 40+ years, and a pie chart showing Axon captures under 1% of the average customer budget with potential to reach 3% through premium bundle adoption.
Two white panels: multi-line chart on the left and pie chart on the right, each with a yellow takeaway banner below.
Proof points across verticals: 8 in 10 UK officers say body cameras make them safer; a DHS enterprise-wide IDIQ for body cameras and software; 60% of CEOs increased budgets for anti-theft technology; 70% reduction in excessive force in corrections; US$3M savings across Tennessee with Axon Justice.
Five vertical cards with yellow headers, monochrome photos and a large statistic with supporting text.
A four-step flywheel (build products and subscription plans, enhance customer experience, attract new users, leverage data and devices) alongside three subscription tiers: OSP 1.0 (2017) at US$99, OSP 10 Premium at US$370 and OSP 10 Premium with AI Era Plan at US$569, plus 126% net revenue retention, 60+ net promoter score and 95%+ of revenue from subscription customers.
Circular flywheel diagram around a yellow Axon logo on the left; three pricing columns with checklists and two KPI boxes on the right.
Section divider opening the Financials chapter.
Black map panel with title and two stacked photos on the right.
Explains revenue recognition for the OSP 10 Premium with AI Era Plan: hardware (TASER 10, cartridges, VR headsets, Axon Body 4, Axon Air, DedroneBeyond radar) recognized on delivery, software and services recognized ratably, and an optional AI Era add-on; illustrative five-year chart for a 750-officer agency shows 75%+ software revenue over the term and 95%+ of revenue tied to subscription customers.
Left column with three labeled revenue streams; right panel with a five-year stacked bar chart and two yellow KPI boxes below.
Quarterly segment revenue from Q3 2025 (US$711M) to Q3 2026 (US$909M: Connected Devices US$472M, Software & Services US$437M) and annual revenue from US$1,187M in 2022 to US$2,780M in 2025 and US$3,417M TTM. Q3 2026 gross margin 56.7% (adjusted 59.2%) with 28% YoY growth; FY2025 gross margin 59.7% (adjusted 62.6%) with a 33% 2022-2025 revenue CAGR.
Stacked quarterly bar chart on the left and annual bar chart with yellow TTM bar on the right; two margin tables with yellow growth callouts beneath.
Four charts: total revenue (US$2.8B in 2025), annual growth (37%, 31%, 33%, 33% for 2022-2025), Connected Devices revenue (US$964M to US$1,577M, 2023-2025) and Software & Services revenue (US$597M to US$1,203M, 2023-2025).
2x2 grid of white chart cards, each with a headline number and a bar chart highlighting 2025 in yellow.
Four-year margin trends for 2022-2025: GAAP gross margin (59.7% in 2025), adjusted gross margin (62.6%), GAAP net income margin (4.5%, down from 18.1%) and Adjusted EBITDA margin rising from 19.5% to 25.5%.
2x2 grid of white chart cards with headline percentage and four bars each.
Future contracted bookings grew from US$3.7B (Q3 2022) to US$15.8B (Q3 2026); net revenue retention rose from 120% to 126%; ARR grew from US$432M to US$1,750M; revenue from customers on subscription plans reached 95%+ (from 88% in 2021).
2x2 grid of white chart cards with five bars each and yellow current-period bars.
Q4 2026 guidance of US$990M-1.01B revenue and US$245-250M Adjusted EBITDA. FY2026 guidance updated November 5, 2026 to US$3.61-3.63B revenue (prior: 32-34% growth), US$924-929M Adjusted EBITDA (~25.6% margin, prior ~25.5%), US$130-150M capex (prior US$160-190M) and US$350-400M free cash flow (prior ~US$450M). On track for a 30%+ five-year revenue CAGR and 600+ bps five-year margin expansion.
Yellow-header guidance tables for Q4 and full year, with two grey On Track stat boxes at top right.
Three-year targets: US$6B revenue and a 28% Adjusted EBITDA margin in 2028 (from US$2.8B and 25.5% in 2025), average annual free cash flow conversion of 60% of Adjusted EBITDA, and annual stock-based compensation dilution below 2.5%.
Stacked KPI cards and a yellow targets table on the left; two-bar revenue chart with a margin line overlay on the right.
Section divider opening the Appendix.
Black map panel with title and two stacked photos on the right.
Definitions of annual recurring revenue, dollar-based net revenue retention, future contracted bookings and bookings (including five-year bookings).
Title on the left and a large white text panel with bold sub-headings on the right.
Explains the non-GAAP measures used (EBITDA, Adjusted EBITDA, adjusted gross margin, non-GAAP net income and EPS, free cash flow, adjusted free cash flow and conversion), 2026 methodology changes and cautions on their use.
Large stacked title on the left and a white panel of small-print paragraphs and bullet definitions on the right.
Reconciles gross margin to adjusted gross margin for Q3 2026 (net sales US$908.6M, gross margin 56.7%, adjusted 59.2%), Q3 2025 and full years 2022-2025 (FY2025 net sales US$2,779.5M, adjusted gross margin 62.6%).
Full-width financial table with a yellow header row and three-month vs. twelve-month column groups.
Reconciles net income to Adjusted EBITDA: Q3 2026 net income US$57.0M and Adjusted EBITDA US$235.7M (25.9% margin) versus US$177.0M (24.9%) in Q3 2025; FY2025 Adjusted EBITDA US$710.2M (25.5% margin).
Full-width reconciliation table with yellow header and bold subtotal rows.
Reconciles net income to non-GAAP net income: Q3 2026 non-GAAP net income US$143.5M (15.8% margin) and non-GAAP EPS US$1.72 versus US$1.24 in Q3 2025; FY2025 non-GAAP EPS US$7.12.
Full-width reconciliation table with yellow header, adjustments, tax effects and per-share rows.
Q3 2026 operating cash flow of US$19.7M and capex of US$38.6M gave free cash flow of negative US$18.9M and adjusted free cash flow conversion of (7.6%); FY2025 adjusted free cash flow was US$85.6M, a 12.1% conversion of Adjusted EBITDA.
Full-width table with yellow header and shaded subtotal rows.
Closing slide with the Axon logo and Thank You.
Black rounded panel with large white text on the left and the street-map Axon mark on the right.
คำถามทั่วไปเกี่ยวกับสไลด์นี้และเนื้อหาการนำเสนอพื้นฐาน
It is Axon Enterprise's (NASDAQ: AXON) 36-page company investor deck dated November 2026, published on investor.axon.com with its Q3 2026 results. It covers the company's mission, product ecosystem (TASER, body cameras, drones, Dedrone counter-drone and Axon Cloud software), market opportunity, financials, 2026 guidance and 2028 targets, plus non-GAAP reconciliations.
Quarterly revenue was US$909 million, up 28% year over year, split into US$472 million Connected Devices and US$437 million Software & Services. Gross margin was 56.7% (59.2% adjusted), Adjusted EBITDA was US$235.7 million (25.9% margin), ARR reached US$1.8 billion, net revenue retention was 126% and future contracted bookings were US$15.8 billion.
As of November 5, 2026, Axon guides FY2026 revenue of US$3.61-3.63 billion, Adjusted EBITDA of US$924-929 million (about 25.6% margin), capex of US$130-150 million and free cash flow of US$350-400 million. Q4 2026 guidance is US$990 million to US$1.01 billion revenue. The 2028 target model calls for US$6 billion revenue at a 28% Adjusted EBITDA margin.
Page 17 splits the TAM by end customer (International Government US$76B, Enterprise US$48B, US State & Local US$19B, US Federal US$12B, Civilian US$5B) and by product area, from digital evidence management and add-ons (US$41B) to vehicle intelligence (US$30B) and real-time operations (US$25B). It notes US State & Local law enforcement is under 15% penetrated.
Axon refreshes its full company deck every quarter. The previous edition is in the gallery as the Axon Q2 2026 Investor Presentation (https://2slides.com/gallery/axon-q2-2026-investor-presentation). This November 2026 version updates the quarterly segment revenue, forward-looking indicators to Q3 2026, and the guidance table with the November 5, 2026 FY2026 outlook.
Yes, as design reference. The deck uses a reusable structure: a black header with five section tabs and a yellow active-tab marker, photo-based section dividers, KPI tile grids, small-multiple bar charts, incident timelines and clean financial tables. Replace Axon's content, logos and photos with your own; the brand assets and data belong to Axon.
This entry provides the original PDF as published by Axon, all 36 pages. An editable PPTX is not included for this edition, so use the PDF and the page-by-page analysis as reference when rebuilding the layouts.
All figures are in US dollars (US$). The deck reports both GAAP and non-GAAP measures such as adjusted gross margin, Adjusted EBITDA, non-GAAP net income and adjusted free cash flow; the appendix (pages 30-35) gives statistical definitions and full reconciliations.
Official investor relations site where Axon publishes its quarterly investor deck, earnings releases and SEC filings.

Create Your Own Slides
Turn your ideas into professional presentations in seconds with 2slides AI.
อ้างอิงการออกแบบมืออาชีพ เลือกสไตล์ของคุณ และสร้างสไลด์ด้วยการแสดงผลข้อความที่สมบูรณ์แบบ ขับเคลื่อนโดย Nano Banana—เริ่มสร้างการนำเสนอของคุณตอนนี้
เอเจนต์ AI ของคุณสำหรับสไลด์ ประหยัดเวลา เปล่งประกายเร็วขึ้นด้วยการสร้างงานนำเสนออัจฉริยะ


© 2026 2slides สงวนลิขสิทธิ์