
อยู่ในคอลเลกชัน ตัวอย่างงานนำเสนอสำหรับนักลงทุน
Avery Dennison Q3 2026 Earnings Presentation — the 17-page "Third Quarter 2026 Financial Review and Analysis" (preliminary, unaudited) supplemental deck dated October 29, 2026, filed with the SEC as Exhibit 99.2 to Form 8-K. It covers Q3 net sales of $2.3 billion with 3.7% organic growth, reported EPS of $2.24 and adjusted EPS of $2.42, Materials Group and Solutions Group segment results, high-value category and Intelligent Labels (RFID) trends, and FY 2026 adjusted EPS guidance of $10.10 to $10.24.
ใช้หน้าปกของงานนำเสนอนี้เป็นต้นแบบสไตล์สำหรับสไลด์ที่สร้างจากเนื้อหาของคุณเอง หรือเลือกหน้าใดก็ได้ด้านล่างเพื่อใช้เลย์เอาต์ของหน้านั้นเป็นต้นแบบ
การนำทางด่วน
แท็ก
แชร์สไลด์
Avery Dennison Q3 2026 Earnings Presentation — the 17-page "Third Quarter 2026 Financial Review and Analysis" (preliminary, unaudited) supplemental deck dated October 29, 2026, filed with the SEC as Exhibit 99.2 to Form 8-K. It covers Q3 net sales of $2.3 billion with 3.7% organic growth, reported EPS of $2.24 and adjusted EPS of $2.42, Materials Group and Solutions Group segment results, high-value category and Intelligent Labels (RFID) trends, and FY 2026 adjusted EPS guidance of $10.10 to $10.24.
มุมมองรายละเอียดของแต่ละหน้าสไลด์ รวมถึงlayout เนื้อหาหลักและองค์ประกอบภาพ
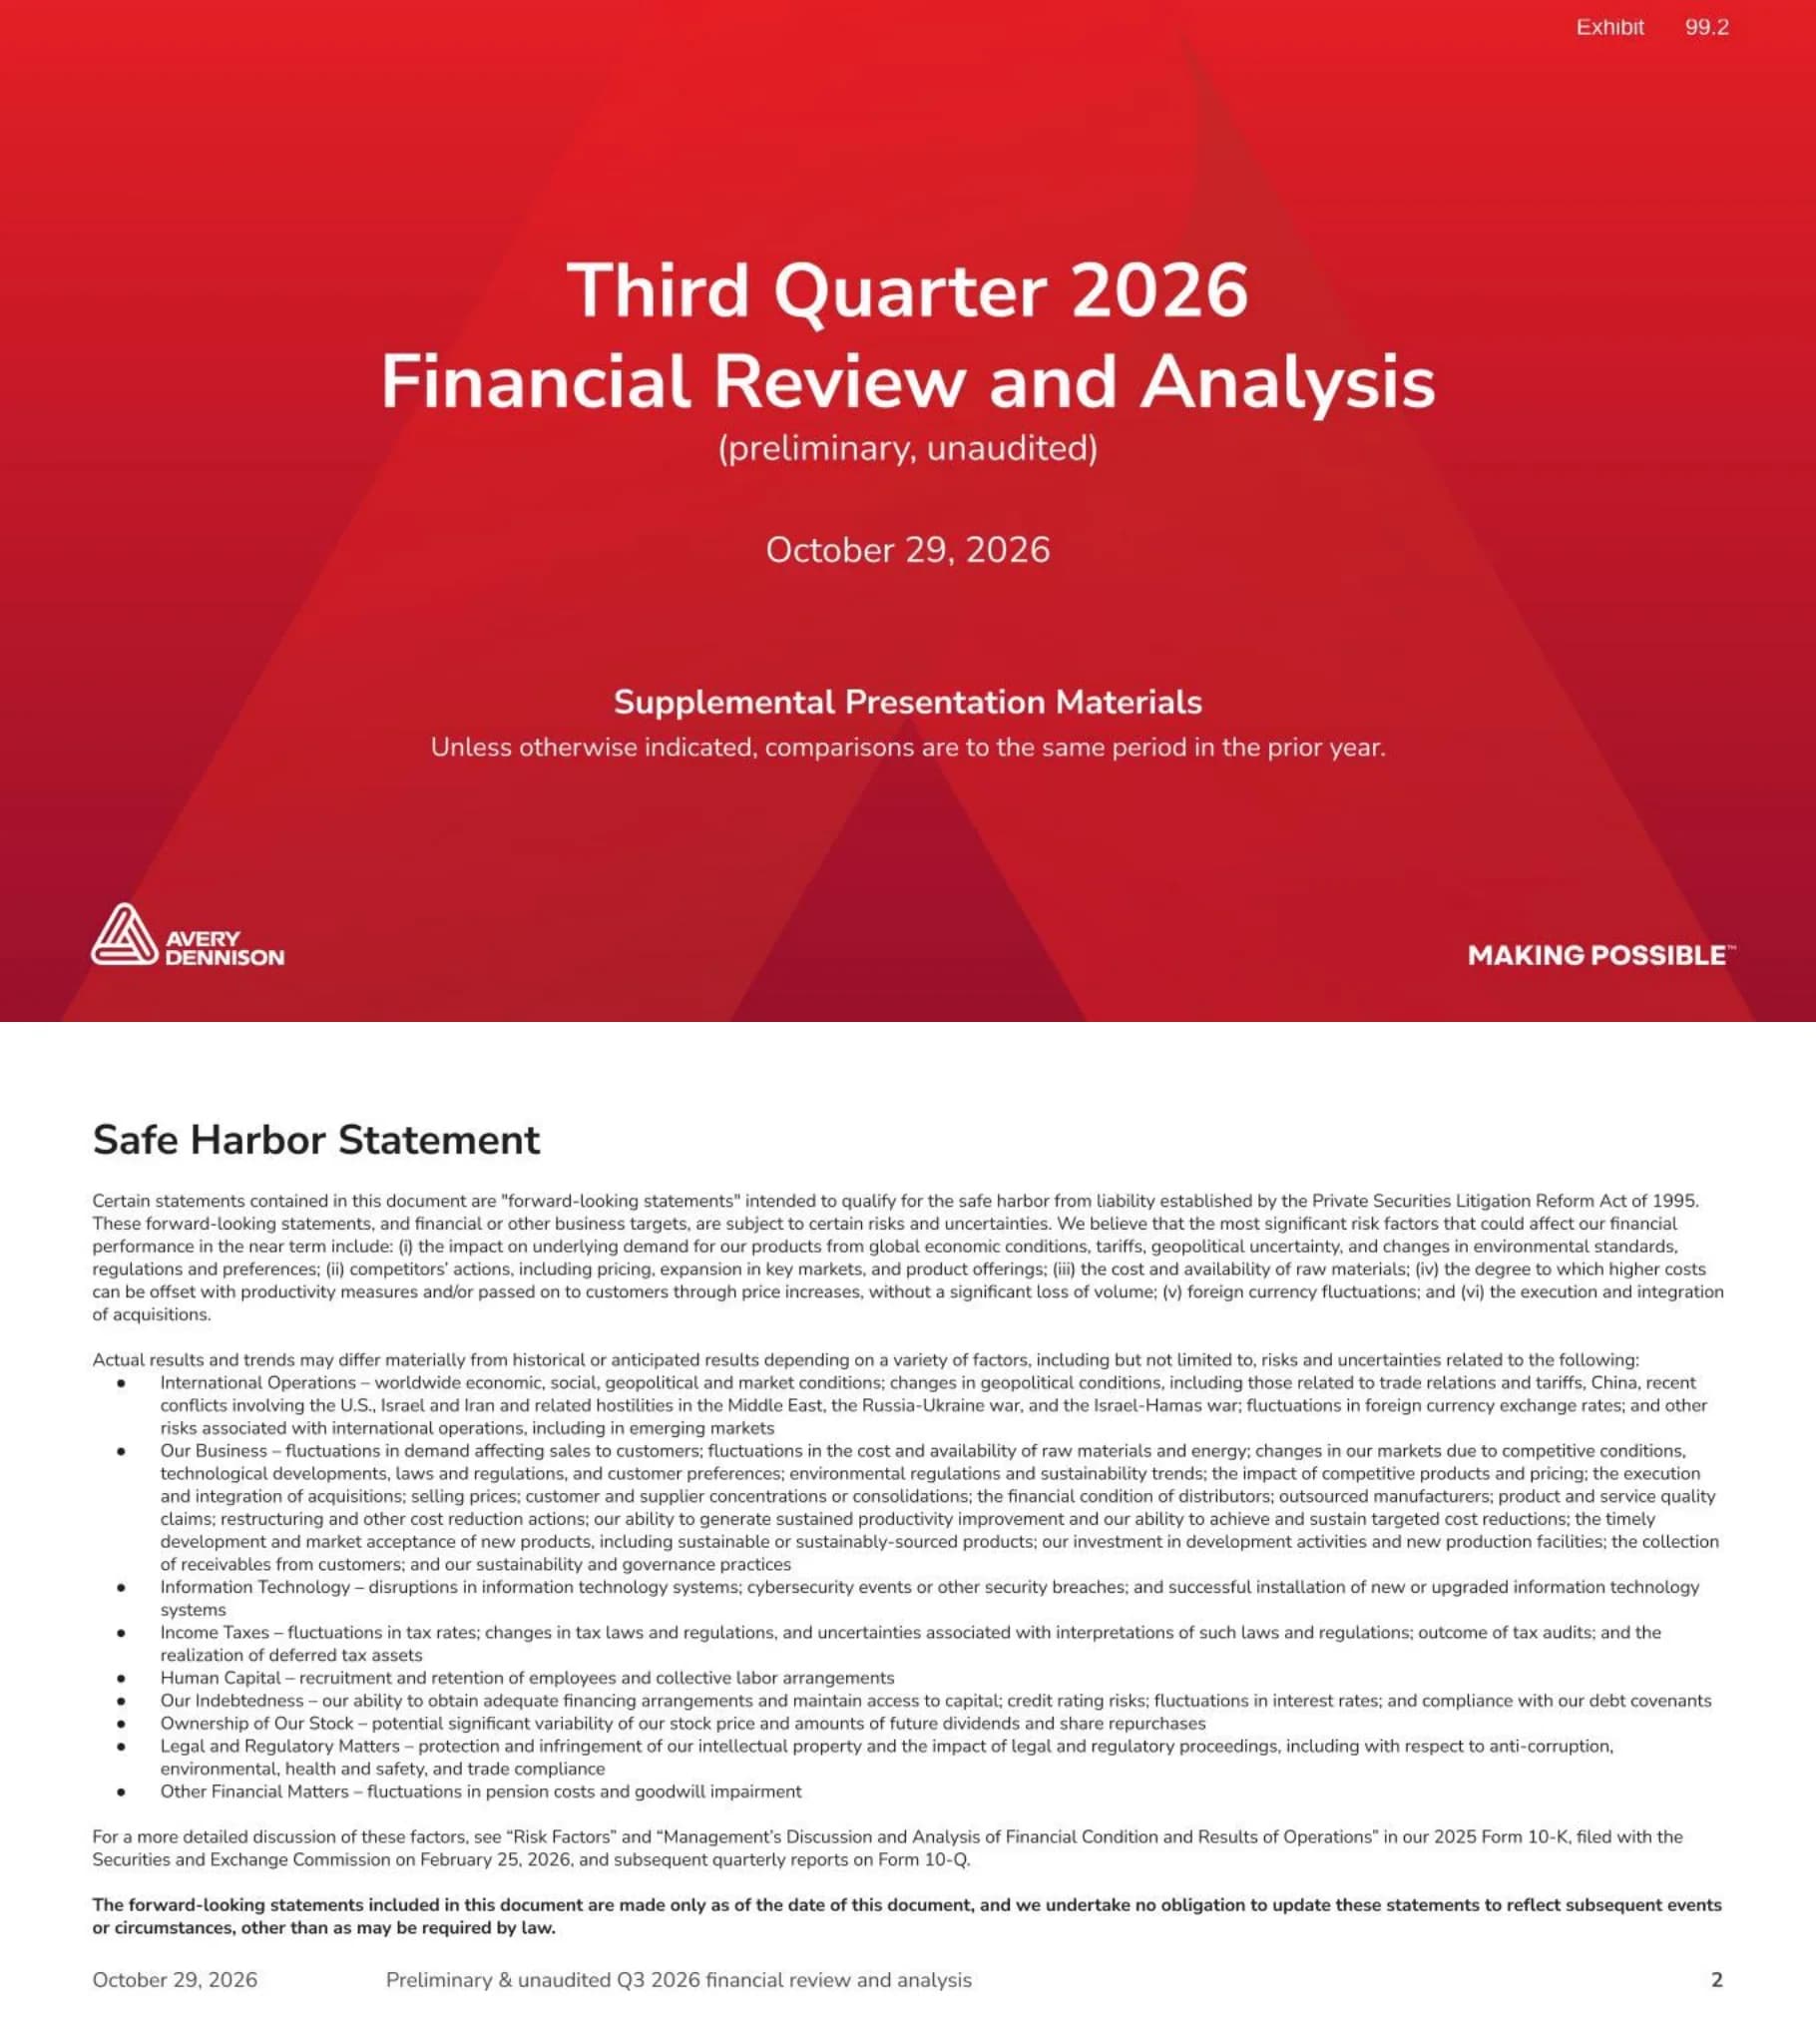
Cover slide titled "Third Quarter 2026 Financial Review and Analysis" (preliminary, unaudited), dated October 29, 2026, labelled Supplemental Presentation Materials, with a note that comparisons are to the same period in the prior year unless otherwise indicated. An "Exhibit 99.2" marker sits in the top-right corner.
Full-bleed red gradient background with a large faint triangular 'A' motif; centered title block, date and subtitle; Avery Dennison logo bottom-left and the 'Making Possible' tagline bottom-right.
Forward-looking statements disclaimer under the Private Securities Litigation Reform Act of 1995. It lists the most significant near-term risk factors (demand and tariffs, competitor actions, raw material costs, ability to offset higher costs, currency, acquisitions) and broader risk categories: international operations including Middle East conflicts and the Russia-Ukraine war, the business, information technology, income taxes, human capital, indebtedness, stock ownership, legal and regulatory matters, and other financial matters. It refers readers to the 2025 Form 10-K filed on February 25, 2026.
White text-heavy slide: bold title top-left, dense paragraphs and a bulleted list of risk categories, closing bold sentence; footer with date, deck title and page number.
Explains the non-GAAP measures used in the deck and why they are used, and points to reconciliations in the appendix and in Attachments A-4 through A-8 of the October 29, 2026 news release. Defines sales change ex. currency, organic sales change, adjusted operating income, adjusted EBITDA and margins, adjusted tax rate, adjusted net income, adjusted EPS, net debt to adjusted EBITDA ratio, adjusted free cash flow and adjusted free cash flow conversion. Notes that fiscal 2025 ran from December 29, 2024 to December 31, 2025, and that fiscal years from 2026 onward match the calendar year.
Single-column small-print text slide with bolded measure names leading each definition bullet; standard footer.
Q3 2026 highlights: net sales of $2.3 billion; organic sales growth of 3.7%, including a roughly 2-point destocking impact, about half of what was anticipated; sales change ex. currency up 4.9%. Reported operating income was $273 million, with adjusted EBITDA margin of 15.8% (down 70 bps) and adjusted operating margin of 12.1% (down 60 bps). Reported EPS was $2.24 and adjusted EPS was $2.42, up 2%, including an estimated 6% destocking impact. Adjusted free cash flow was $246 million ($716 million year to date), $481 million was returned to shareholders in the first nine months, and net debt to adjusted EBITDA was 2.2. The right-hand panels say high-value and base categories both grew mid-single digits organically. The FY 2026 outlook calls for adjusted EPS of $10.10 to $10.24, about 3.5% organic growth and a roughly 1.5% Q4 sales headwind from the calendar shift.
Three light-grey panels with red top rules: a tall left panel 'Third Quarter Results' with bold metric headers and nested bullets, and two stacked right panels 'Strength & Durability of Franchise' and 'FY 2026 Outlook'.
Two tables across 1H25, 2H25, 1Q26, 2Q26 and 3Q26. Organic sales growth was 1%, 0%, 1%, 8% and 4%; the estimated customer inventory management effect was about 1%, 4% and (2)% in the three 2026 quarters, leaving underlying performance of 1%, 0%, about 0%, about 4% and about 6%. Adjusted EPS growth was 0%, 2%, 7%, 19% and 2%; the inventory effect was about 2%, 11% and (6)%, leaving underlying growth of 0%, 2%, about 5%, about 8% and about 8%. A note says 2H25 includes the impact of the extra days.
Two stacked comparison tables with red column headers for each period, a grey headline-metric row, and a boxed outline around the 'Underlying performance' row; footnote below.
Materials Group reported sales rose 8.5% to $1.6 billion and were up 4.9% organically. High-value and base categories both grew mid-single digits, with low-single-digit volume/mix growth and a mid-single-digit price benefit. Reported operating margin was 13.7%; adjusted operating margin was 14.1% and adjusted EBITDA margin 16.4%, each down 110 bps, as productivity was more than offset by negative volume/mix and higher employee-related costs. Donut charts show 2025 sales by product (Label Materials, Graphics & Reflective, Performance Materials, Other; high-value categories 38%) and the 2025 sales estimate by end market (U.S. & Canada, Western Europe, E. Europe & MENA, Asia Pacific, Latin America; emerging markets 39%).
Left column of commentary split by red rules into sales and margin sections; right column with two donut charts, each with a legend and a center callout.
Solutions Group reported sales fell 1.8% to $687 million but were up 0.8% organically. High-value categories were comparable to the prior year, including a headwind from logistics Intelligent Labels; base categories grew low single digits and overall apparel categories grew mid-single digits. Reported operating margin was 10.5%; adjusted operating margin was 10.8% and adjusted EBITDA margin 17.8%, each up 80 bps, as productivity was partly offset by higher employee-related costs. Donut charts show 2025 sales by product (Base Solutions, Intelligent Labels, Vestcom, Embelex; high-value categories 60%) and the 2025 sales estimate by end market (U.S. & Canada, Europe, Asia Pacific, Latin America).
Mirrors the Materials Group slide: commentary on the left and two donut charts with legends on the right.
High-value category sales grew mid-single digits organically in Q3, which the company says continues to outpace global GDP. In the Materials Group, Specialty & Durables were up high single digits, Performance Materials up mid-single digits and Graphics & Reflectives up low single digits. In the Solutions Group, Embelex grew mid-single digits despite lapping the World Cup and Vestcom was up low single digits. Enterprise Intelligent Labels grew low single digits, with gains in apparel, general retail and food offsetting weakness in logistics. A donut chart shows about $4 billion of 2025 high-value category sales, 45% of total company sales.
Two-column slide with red and dark-grey header rules: bulleted results on the left with a dark-grey callout banner at the bottom; a large donut chart on the right with a two-group legend.
Intelligent Labels (RFID) sales grew low single digits organically in Q3. Apparel and general retail rose about 10% on apparel program expansions and a recovery in general retail. Food and logistics fell mid-teens: faster growth in food was more than offset by soft logistics demand and lapping outsized 2025 share gains. Outlook by end segment: continued growth in apparel and general retail; acceleration in food as a new grocery customer ramps and pilots expand, moving toward commercialization with the largest U.S. grocery retailer; and expanding logistics pilots with additional customers. A donut chart shows about $0.9 billion of 2025 sales by category: Apparel, Food & Logistics, General Merchandise and All Other.
Left column with 'Overall Results' and 'Key End Segment Insights' sections in red headings; right side shows a large red-toned donut chart with segment labels on the slices and a big '$0.9B' center figure.
FY 2026 guidance table: reported EPS of $9.45 (low) to $9.59 (high), plus about $0.65 of estimated restructuring costs and other items, gives adjusted EPS of $10.10 to $10.24. Assumptions: reported sales growth of about 5.5% and organic growth of about 3.5%, including about a 1.5% benefit from currency translation, about a 1% benefit from a prior-year acquisition and a 0.4% headwind from the calendar adjustment (about 1.5% in Q4). Other full-year items: about a $0.30 net EPS tailwind from currency and a lower share count, partly offset by a higher adjusted tax rate and interest expense; more than $65 million of incremental restructuring savings (previously more than $60 million); most 2025 temporary savings, largely incentive compensation, remain a headwind; a target of 100%+ adjusted free cash flow conversion; fixed and IT capital spending of about $240 million (previously about $260 million); and an assumption that most remaining customer destocking happens in Q4.
Full-width three-row guidance table with Low and High columns and grey-shaded reported and adjusted EPS rows, followed by two bulleted sections.
Section divider for the appendix: "Summary Information & Reconciliation of Non-GAAP Financial Measures from GAAP."
Dark-red full-bleed divider with large diagonal rounded-bar shapes, left-aligned white title and subtitle, and the logo bottom-left.
A table compares S&P Global Market Intelligence's October 2026 outlook with its January 2026 outlook for real GDP, retail volume and CPI. World figures are GDP 2.6% (change (0.1)%), retail volume 1.1% ((0.5)%) and CPI 3.9% (+1.0%). U.S.: GDP 2.4% (+0.1%), retail volume 1.3% (+0.2%), CPI 3.4% (+0.9%). Europe: 1.4% / 0.7% / 4.4%. APAC: 4.3% / 1.4% / 2.8%. Latin America: 2.0% / 1.3% / 6.9%. Change cells are shaded green or pink. A line chart of University of Michigan U.S. consumer sentiment from about 2019 to 2026 falls from near 100 to below 50 at the end of the period.
Split layout divided by a vertical rule: a forecast table with red headers and green or pink change cells on the left, and a red line chart on the right; source notes under each.
Reconciliation of Q3 2026 net sales change to organic sales change for the total company, Materials Group and Solutions Group. Net sales change was 5.2%, 8.5% and (1.8)%. Reclassification of sales between segments was nil, (1.4)% and 2.8%; foreign currency translation was (0.3)%, (0.3)% and (0.2)%. Sales change ex. currency was 4.9%, 6.7% and 0.8%. Acquisitions were (1.3)%, (1.8)% and nil, giving organic sales change of 3.7%, 4.9% and 0.8%. A footnote says totals may not sum due to rounding.
Centered reconciliation table with three red header columns, bold subtotal rows on light-grey shading and indented adjustment rows.
Five-quarter trend from 3Q25 to 3Q26. Net sales change was 1.5%, 3.9%, 7.0%, 10.9% and 5.2%. Currency translation was (1.7)%, (1.7)%, (4.7)%, (2.0)% and (0.3)%, and extra days were (1.5)% in 4Q25. Sales change ex. currency was (0.2)%, 0.6%, 2.3%, 8.9% and 4.9%. Acquisitions were nil, (0.8)%, (1.2)%, (1.3)% and (1.3)%. Organic sales change was (0.2)%, (0.2)%, 1.1%, 7.6% and 3.7%. Materials Group organic change was (1.9)%, (0.9)%, 1.9%, 9.7% and 4.9%; Solutions Group organic change was 3.6%, 1.3%, (0.9)%, 2.6% and 0.8%.
Wide table with red quarter headers, bold subtotal rows, indented adjustment rows, and a separate two-row block for segment organic change; rounding footnote.
Margins for 3Q26 vs 3Q25. Reported operating margin: Materials Group 13.7% vs 14.3%, Solutions Group 10.5% vs 9.7%, total company 11.7% vs 11.9%. Adjusted operating margin: 14.1% vs 15.2%, 10.8% vs 10.0% and 12.1% vs 12.7%. Adjusted EBITDA margin: 16.4% vs 17.5%, 17.8% vs 17.0% and 15.8% vs 16.5%.
Three side-by-side mini tables (reported operating, adjusted operating, adjusted EBITDA margin), each with 3Q26 and 3Q25 columns; the reported table has grey headers and the adjusted tables red headers; bold total company row.
Two donut charts. The estimated 2025 sales by end market are split among non-durable goods (the largest slice), industrial/durable, apparel and logistics, with the center reading "60%+ Staples." 2025 sales by manufacturing location total $8.9 billion across U.S. & Canada, Western Europe, EEMENA, China, Other Asia-Pacific and Latin America. Exact slice percentages are not labelled.
Two large side-by-side donut charts with in-slice labels and bold center figures under their own headings.
Back cover with averydennison.com, the #MakingPossible hashtag, social media icons (LinkedIn, Facebook, Instagram, X, YouTube, Threads), a vertical 'Making Possible' tagline and a 2026 copyright and trademark notice.
Red gradient full-bleed background matching the cover, with the website top-left, rotated tagline along the right edge, a social icon row, small legal text bottom-right and the logo bottom-left.
คำถามทั่วไปเกี่ยวกับสไลด์นี้และเนื้อหาการนำเสนอพื้นฐาน
According to the deck, net sales were $2.3 billion, with organic sales growth of 3.7% and sales up 4.9% ex. currency. Reported operating income was $273 million, reported EPS was $2.24 and adjusted EPS was $2.42, up 2%. Adjusted free cash flow was $246 million for the quarter and $716 million year to date.
The company expects adjusted EPS of $10.10 to $10.24 (reported EPS of $9.45 to $9.59, with about $0.65 of restructuring costs and other items). It assumes about 5.5% reported sales growth and about 3.5% organic growth, and expects most remaining customer destocking to occur in Q4.
Materials Group sales rose 8.5% to $1.6 billion (4.9% organic) at a 13.7% reported operating margin, with adjusted margins down 110 bps. Solutions Group sales fell 1.8% to $687 million but grew 0.8% organically, with a 10.5% reported operating margin and adjusted margins up 80 bps.
The deck estimates customer inventory management reduced organic sales growth by about 2 points and adjusted EPS growth by about 6% in Q3. Excluding these effects, it puts underlying organic growth at about 6% and underlying adjusted EPS growth at about 8%.
It is Avery Dennison's "Third Quarter 2026 Financial Review and Analysis" (preliminary, unaudited), dated October 29, 2026. It was filed with the SEC as Exhibit 99.2 to a Form 8-K and is also posted at investors.averydennison.com. The SEC filing renders the slides as images, so the PDF here is assembled from those exhibit pages.
Yes. The original 17-page PDF and a PPTX converted from it are both available. Because the source slides are SEC exhibit images, the PPTX layout and text may need cleanup before you reuse it as a template.
A branded cover and back cover, a three-panel results-and-outlook summary, a destocking bridge table, segment slides that pair commentary with donut charts, a guidance table, a macro dashboard with a line chart, and non-GAAP reconciliation and margin comparison tables.
Intelligent Labels is Avery Dennison's RFID business, with about $0.9 billion of 2025 sales. In Q3 it grew low single digits organically: apparel and general retail rose about 10%, while food and logistics fell mid-teens as soft logistics demand outweighed faster growth in food.
Original exhibit filed with the SEC on Form 8-K, from which this deck was assembled

Create Your Own Slides
Turn your ideas into professional presentations in seconds with 2slides AI.
อ้างอิงการออกแบบมืออาชีพ เลือกสไตล์ของคุณ และสร้างสไลด์ด้วยการแสดงผลข้อความที่สมบูรณ์แบบ ขับเคลื่อนโดย Nano Banana—เริ่มสร้างการนำเสนอของคุณตอนนี้
เอเจนต์ AI ของคุณสำหรับสไลด์ ประหยัดเวลา เปล่งประกายเร็วขึ้นด้วยการสร้างงานนำเสนออัจฉริยะ


© 2026 2slides สงวนลิขสิทธิ์