
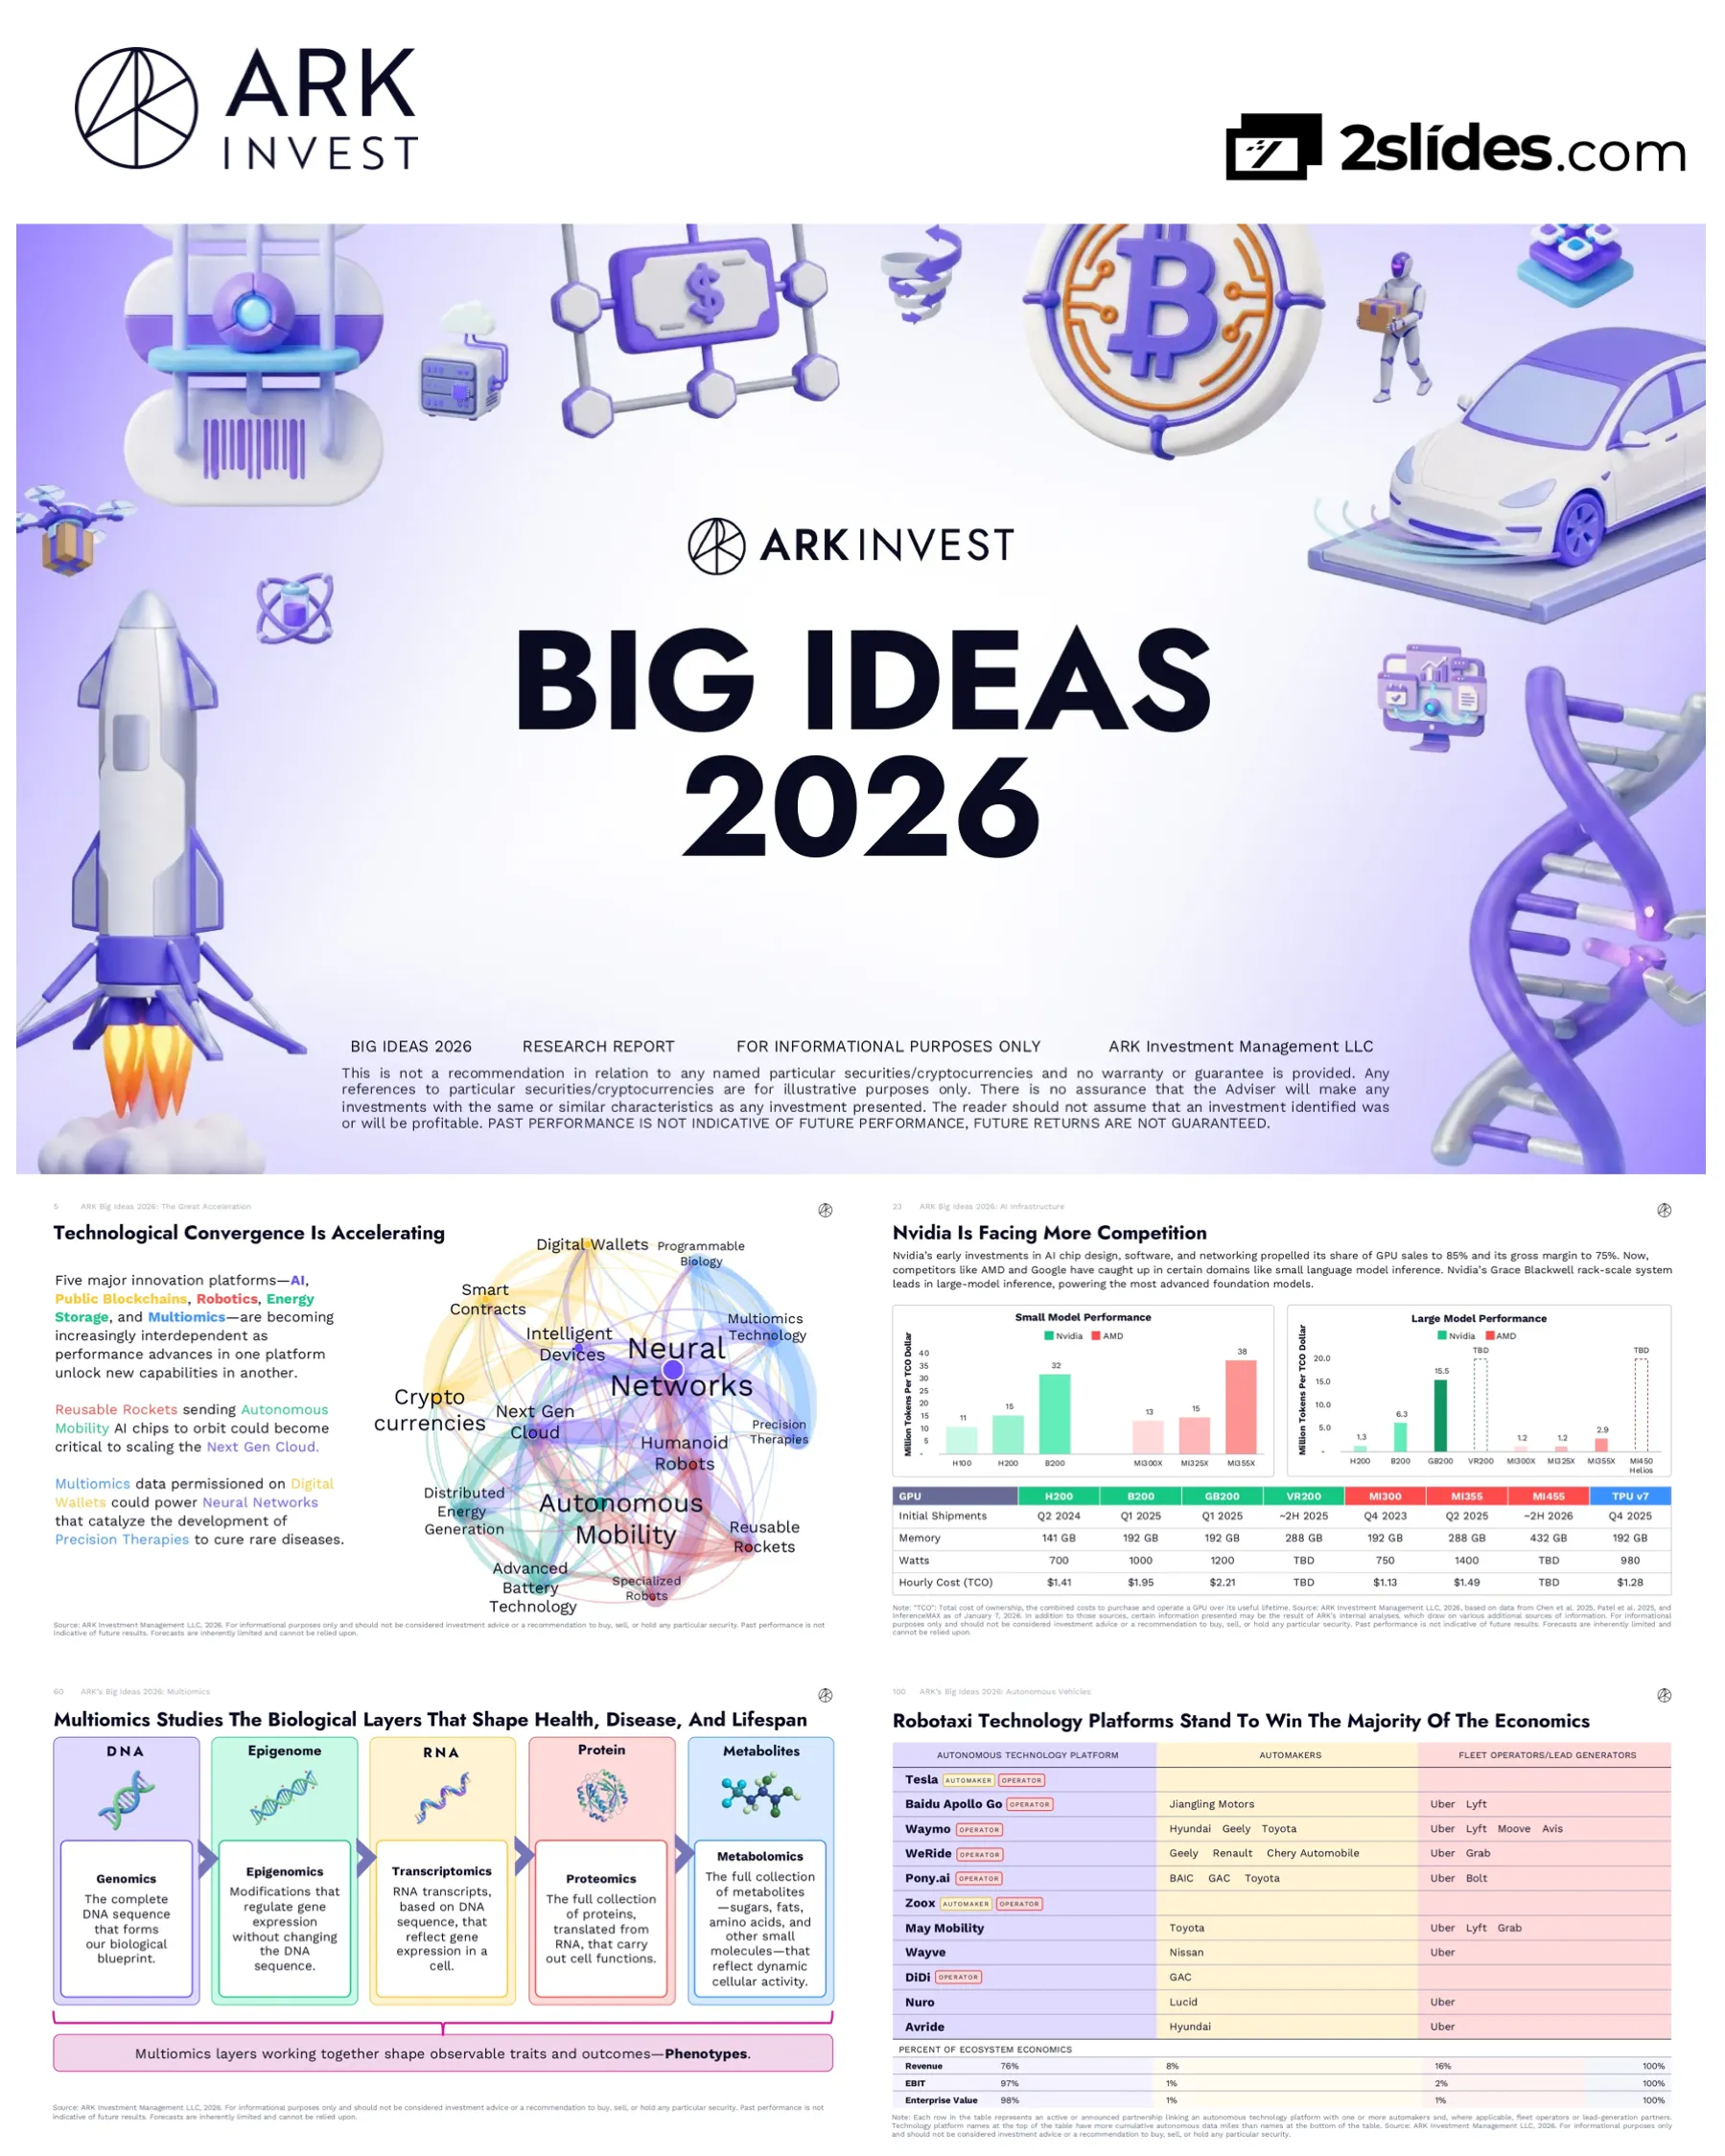
ARK Invest Big Ideas 2026 - Disruptive Innovation Platforms and Investment Opportunities
การนำทางด่วน
แท็ก
แชร์สไลด์
ARK Invest Big Ideas 2026 - Disruptive Innovation Platforms and Investment Opportunities
มุมมองรายละเอียดของแต่ละหน้าสไลด์ รวมถึงlayout เนื้อหาหลักและองค์ประกอบภาพ
Title page for ARK Investment Management's 10th annual Big Ideas research report, emphasizing disruptive innovation themes
Bold typography with 'BIG IDEAS 2026' as main title, disclaimer text at top, ARK branding
Overview of key risks associated with disruptive innovation investments including rapid pace of change, uncertainty, regulatory hurdles, competitive landscape, and political/legal pressure
Centered circular diagram with 'DISRUPTIVE INNOVATION' at center, risk factors radiating outward, source citation at bottom
Lists 13 Big Ideas with page numbers: The Great Acceleration (4), AI Infrastructure (19), AI Consumer OS (25), AI Productivity (32), Bitcoin (38), Tokenized Assets (45), DeFi Applications (52), Multiomics (58), Reusable Rockets (78), Robotics (83), Distributed Energy (90), Autonomous Vehicles (95), Autonomous Logistics (101)
Two-column layout with Big Ideas titles on left and page numbers on right, introduction paragraph at top
Chapter opener explaining how AI is the central dynamo accelerating five major innovation platforms and igniting macroeconomic growth inflection. Author: Brett Winton, Chief Futurist
Large title with subtitle, author credit, minimal text on clean background
Complex diagram showing five major innovation platforms (AI, Public Blockchains, Robotics, Energy Storage, Multiomics) with their component technologies and interdependencies. Examples of convergence include reusable rockets enabling AI infrastructure and multiomics data powering precision therapies
Five-column framework with technology stacks, interconnection lines showing relationships, explanatory text boxes
Two charts showing: 1) AI's dominant role as technological catalyst with increasing importance of robotics, 2) Convergence Network Strength increased 35% in 2025, growing from ~24 to ~32 on 100-point scale. Details major developments in cross-platform catalysis
Two side-by-side bar charts with explanatory bullet points, horizontal layout
Analysis of reusable rocket demand driven by AI compute needs. Shows potential 60x increase in demand for space-based AI infrastructure. Compares terrestrial vs space compute costs at different launch price points
Two charts: logarithmic scale bar chart for upmass demand, horizontal bar chart comparing cost ratios
Historical chart of US fixed asset investment as percent of GDP from 1852-2030, showing major technology waves (railroad, telephony, electrification, cars, computers) and forecasting AI-driven investment surge through 2030
Line chart spanning 178 years with technology wave annotations and forward projections
Framework showing four ways disruptive tech drives growth: accelerates capital formation, increases returns on deployed capital, transforms non-market activity into GDP, frees human potential. Uses robotaxis as example
Four-column framework with robotaxis case study at bottom showing specific mechanisms
Detailed analysis of how household humanoid robots could impact GDP. Currently only $2,600 of ~$68,000 home upkeep value flows to GDP. Single humanoid could add $62,000 per household, potentially boosting US GDP by 20% ($6 trillion)
Two side-by-side bar charts comparing current vs robot-enabled GDP impact
Logarithmic chart showing global real GDP growth from 100,000 BC to 2030. ARK forecasts 7.3% annual growth vs IMF's 3.1%, driven by five innovation platforms and capital investment adding 1.9 percentage points
Logarithmic timeline chart with historical data points and diverging forecasts
Analysis explaining why quantum computing won't be disruptive for 20-40 years. Shows distance from cracking RSA 2048 under different progress scenarios. Even with Moore's Law pace, useful quantum computing not until 2040s-2060s
Area chart showing progress scenarios with explanatory text box
Chart showing innovation share of global equity market cap growing from ~20% today to 35% by 2030. Compares nominal GDP growth vs innovation and non-innovation market cap growth rates. Historical context from 1870 railroad market dominance
Area chart with historical data and forward projections, growth rate comparison table
Summary of AI innovation platform describing computational systems evolving with data, neural networks, next-gen cloud infrastructure, and intelligent devices. Emphasizes AI's transformative impact across all sectors
Text-focused slide with centered content, white space, minimal graphics
Description of battery technology enabling autonomous mobility, electric drivetrains, flying taxis, and distributed energy generation. Emphasizes cost decline impacts and integration with AI data center power demands
Text-focused slide with centered content describing platform components
Explains multiomics technologies (DNA, RNA, protein data), programmable biology, precision therapies, and AI-powered autonomous labs collapsing drug discovery costs. Mentions pan-cancer blood tests and novel biological constructs
Text-focused slide describing multiomics ecosystem
Describes migration of money and contracts onto public blockchains, cryptocurrencies, stablecoins, smart contracts, and digital wallets. Emphasizes transparency, reduced capital controls, and AI-driven purchasing agents
Text-focused platform description
Overview of humanoid robots, specialized robots, and reusable rockets. Describes AI-enabled automation across manufacturing, logistics, healthcare, and space-based compute infrastructure unconstrained by terrestrial limitations
Text-focused robotics platform summary
Chapter introduction defining next generation of cloud infrastructure. Authors: Frank Downing (Director of Research, AI & Cloud) and Jozef Soja (Research Analyst, AI & Cloud)
Chapter title with subtitle and author credits
Two charts showing: 1) Inference costs dropped 99%+ in past year (from $28.90 to $0.10 per million tokens), 2) OpenRouter demand increased 25-fold since December 2024 from ~250B to ~7,000B tokens
Two charts side-by-side: logarithmic cost decline and exponential demand growth
Chart showing data center systems investment accelerated from 5% CAGR (2012-2023) to 29% CAGR (ChatGPT moment onward). Annual investment reached ~$500B in 2025, up 2.5x from 2012-2023 average
Bar chart with CAGR annotations and trend line
Two charts comparing current tech boom to dot-com era: 1) Capex as % of GDP matches 1998 levels, 2) P/E ratios for Mag 6 (~45x) well below dot-com peak (~115x for Cisco/Oracle/Nokia/Intel/Microsoft)
Two side-by-side charts with historical comparisons
Performance comparison showing AMD catching up to Nvidia in small model inference (MI355X: 38 vs Nvidia B200: 32 tokens per TCO dollar). Large model performance still Nvidia-dominated. Detailed GPU specifications table included
Two bar charts comparing performance, specifications table below
Forecast showing data center systems investment reaching $1.4T by 2030 (30% CAGR). Market share shift from traditional to accelerated servers (GPUs and ASICs). ASICs expected to gain significant share
Stacked bar chart and market share area chart
Chapter introduction on transforming search, discovery, transactions, and e-commerce economics. Authors: Nicholas Grous (Director) and Varshika Prasanna (Research Associate)
Chapter title with authors
Framework showing evolution: Command Era (1980-1994), Web Era (1995-2006), Mobile Era (2007-2022), Agentic Era (2022+). Chart shows AI adoption outpacing internet adoption (~27% penetration in 3 years vs ~7% for internet)
Timeline framework with adoption comparison chart
Timeline showing transaction time compression: Pre-internet (60 min) → Web (10 min) → Mobile (5 min) → Agentic AI (1.5 min). Notes 95% of consumer journey occurs before purchase
Line graph showing time compression across eras with purchase funnel stages
Diagram showing agentic enablers (MCP, ACP, A2A, AP2, UCP) connecting AI platforms (ChatGPT, Gemini, Claude) to retailers through standardized protocols, contrasting with internet era's complex disconnected integrations
Side-by-side comparison: internet era complexity vs agentic era simplicity
Projection of AI-facilitated online spend growing from $0.1T (2%) in 2025 to $8T (25%) in 2030. Includes table comparing traditional marketplaces vs AI agents across discovery, engagement, decision-making, and purchasing
Area chart with percentage overlay and comparison table
Two charts showing: 1) AI search traffic share growing from 10% (2025) to 65% (2030), 2) AI search ad spend reaching ~$300B by 2030 with ~50% CAGR while traditional search stagnates
Two area charts showing market share shift and revenue growth
Forecast showing AI consumer revenue growing from ~$20B (2024) to ~$900B (2030) at ~105% CAGR. Lead generation and advertising drive growth, overwhelming subscription revenue contributions
Stacked area chart showing three revenue streams
Chapter on scaling digital intelligence. Authors: Frank Downing and Jozef Soja
Simple chapter divider
Chart showing AI agent task duration capability increased 5x from 6 minutes to 31 minutes at 80% success rate during 2025. ChatGPT Plus subscriber payback period analysis showing break-even in ~0.5 day
Line chart with exponential growth and payback calculation box
Two charts showing: 1) Software development costs fell 91% (April to December 2025) from $3.50 to $0.32 per million tokens, 2) Annualized cost declines of 93-99.7% across different benchmarks
Logarithmic cost chart and horizontal bar chart of decline rates
Chart showing Chinese models trailing US by only 6 months in performance. Production capacity comparison: TSMC produces 38x more compute than SMIC (~135B vs ~3.5B transistors daily)
Scatter plot of model performance over time and production capacity comparison
Charts showing general purpose AI revenue (OpenAI: $20B, Anthropic: $9B in 2025) and specialized startups (Cursor: $1B ARR, Harvey, OpenEvidence, Sierra: $100M ARR each) growing rapidly at 250-850% CAGR
Two charts: bar chart for general purpose and callout boxes for specialized startups
Forecast showing global software spend could grow 19-56% annually (vs 14% historical) depending on AI adoption scenario. Three scenarios ranging from $3.4T to $13T by 2030, unlocking $22T-$117T in value
Stacked bar chart showing development phases and three scenario comparisons
Chapter on leading movement into new asset class. Author: David Puell (Research Trading Analyst & Associate PM)
Chapter divider
Timeline of 2025 bitcoin institutional developments including Trump's strategic reserve, Metaplanet's $5.4B treasury, SEC's generic listing standards, Fidelity Crypto IRA, Texas strategic reserve, Wisconsin pension fund allocation
Line chart of bitcoin price with timeline annotations of major events
Chart showing US ETF and public company bitcoin holdings grew from 8.7% to 12% of total supply in 2025. ETF balances increased 19.7%, public company holdings grew 73%
Dual-axis chart with absolute numbers and percentage
Charts showing bitcoin's Sharpe ratio surpassed ETH, SOL, and CoinDesk 10 average for most of 2025. Average yearly Sharpe ratio comparisons across different timeframes (since Nov 2022, 2024-2025, 2025)
Line chart and grouped bar chart comparing Sharpe ratios
Chart showing 2025 had shallowest average drawdowns in bitcoin history across 5-year, 3-year, 1-year, and 3-month horizons, demonstrating reduced volatility as safe-haven asset
Multiple time series showing drawdown patterns
Side-by-side comparison of 2024 vs 2025 assumptions for bitcoin 2030 forecast. Major changes: Digital Gold TAM increased 37% (gold up 64.5%), Emerging Market penetration decreased 80% (due to stablecoin adoption)
Two side-by-side tables comparing TAM and penetration assumptions
Forecast showing digital asset market cap growing at ~61% CAGR to $28T by 2030. Bitcoin expected to dominate at 70% (~$16T at 63% CAGR), smart contracts reaching ~$6T (54% CAGR)
Stacked bar chart with detailed breakdown bullet points
Chapter on moving trillions onto blockchains. Authors: Lorenzo Valente (Director) and Raye Hadi (Research Associate)
Chapter divider
Timeline of 2025 stablecoin developments following GENIUS Act: Circle IPO/Layer 1, Wyoming's FRNT, Stripe's Tempo, Tether's Plasma, major bank stablecoin launches. Weekly transaction volume chart showing surge to $1.2T
Line chart with timeline annotations of major events
Chart showing stablecoin adjusted transaction volume reached $3.5T (30-day average) in December 2025, 2.3x larger than Visa + PayPal + Remittances combined. USDC dominates at ~60% share, USDT ~35%
Logarithmic line chart comparing payment systems over time
Chart showing tokenized real-world assets grew 208% to $18.9B in 2025. Led by US Treasuries ($9B including BlackRock's $1.7B BUIDL), commodities ($4.1B with Tether/Paxos gold dominating), and institutional funds
Stacked area chart showing RWA categories over time
Bar chart showing assets on major blockchains. Ethereum dominates with $400B+. Stablecoins and top 50 tokens account for ~90% on most chains. Solana unique with ~21% in memecoins
Horizontal bar chart showing asset composition by blockchain
Forecast showing tokenized assets growing from $19B to $11T (~1.38% of financial assets) by 2030. Bank deposits and public equities expected to see greater on-chain migration than sovereign debt
Stacked area chart with category projections
Analysis of traditional companies launching on-chain infrastructure: Circle (Arc), Coinbase (Base, cbBTC), Kraken (Ink), etc. Charts showing cbBTC bitcoin-backed loans growth and Robinhood tokenized equities reaching $15M market cap
Two charts showing cbBTC growth and tokenized equity breakdown
Chapter on designing engines of digital asset growth. Authors: Lorenzo Valente and Raye Hadi
Chapter divider
Charts showing application revenue hit $3.8B in 2025 (January alone: $800M+ record). App/network revenue ratio increased. 70 applications generate $1M+ MRR. Led by Hyperliquid, Pump.fun, Pancakeswap
Combined bar and line chart showing revenue and ratio
Bar chart comparing assets on platform: Traditional fintechs (Coinbase $500B, Robinhood $157B) vs DeFi protocols (Tether $160B, Aave $67B). Top 50 DeFi platforms have $1B+ TVL, top 12 have $5B+
Horizontal bar chart comparing platforms
Bar chart showing revenue per employee: Hyperliquid leads at ~$60M+, followed by Tether (~$55M). Crypto companies dominate top rankings ahead of OnlyFans, Valve, Nvidia. Highlights double-digit headcount powering world-class revenues
Horizontal bar chart ranking companies by efficiency
Charts showing Hyperliquid revenue growing to $100M+ monthly. Market share analysis shows on-chain exchanges (led by Hyperliquid) taking significant share from Binance in perpetual futures market
Stacked area chart and area share chart
Analysis showing 90%+ of Ethereum and Solana market value attributed to monetary premium rather than network revenue (using 50x revenue multiple). Only few digital assets will retain monetary properties
Stacked bar chart showing value decomposition
Chapter on AI-native biology catalyzing healthcare shifts. Authors: Shea Wihlborg PhD and Brett Winton. Notes five educational subsections ahead
Chapter divider with structural note
Section divider
Simple section header
Framework showing multiomics layers: Genomics (DNA blueprint), Epigenomics (gene expression regulation), Transcriptomics (RNA transcripts), Proteomics (proteins), Metabolomics (metabolites). Together shape observable phenotypes
Linear flow diagram showing biological information flow
Table mapping companies to biological layers: DNA (Illumina, CRISPR Therapeutics), Epigenome (10X Genomics, Ipsen), RNA (Tempus, Ionis), Protein (Quantum Si, Nurix), Metabolites (908 Devices, Ultragenyx)
Five-column table with company examples
Circular flywheel diagram showing how multiomics generates data → AI creates insights → better tools/tests/cures → more data. Includes company examples: Multiomics tools (Illumina, PacBio), Diagnostics (Guardant, Natera), AI drugs (Absci, Generate Bio), Cures (Beam, CRISPR Tx)
Circular flywheel with four segments and company callouts
Section divider
Section header
Two charts: 1) Historical genome sequencing cost decline from $100M+ (2001) to ~$100 (2024) following Wright's Law, 2) Forecast of 10-fold cost declines by 2030 across genome, epigenome, and structural variant testing
Logarithmic historical chart and forecast bar comparison
Charts showing molecular test volumes growing from ~2M (2020) to ~7M (2025E) to ~30M (2030E), generating data tokens increasing from ~20T to ~200T by 2030 - exceeding frontier LLM training data (15T tokens)
Two growth charts: test volumes and data tokens generated
Chart showing AI-enabled diagnostics as percent of FDA approvals inflected post-ChatGPT from single-digit % to forecast ~30% by 2030, approaching ~100% over time. Example: Tempus ECG-AF for atrial fibrillation detection
Time series with pre/post ChatGPT distinction and forecast
Section divider
Section header
Comparison showing AI reducing drug development costs from $2.4B (industry average) to $1.7B (initial AI efforts) to $0.7B (future AI design). Time-to-market reduced from 13 to 11 to 8 years. Failure rates drop significantly
Stacked bar chart showing development phase costs and timeline
Charts showing: 1) AI drug generating $4B cumulative cashflow over 30 years vs traditional drug's $1B, 2) Patent life value increasing 30-80% depending on time-to-market acceleration (2-5 years faster)
Cashflow curve and patent value analysis chart
Section divider
Section header
Analysis showing cure price of ~$1.1M represents 15x lifetime prescription costs ($75K). Cure enterprise value averages $3.5B - 20x typical drug value. Frontloaded cash and lack of competition drive value
Waterfall chart building to cure price and value comparison bars
Hereditary angioedema case study: Gene-editing treatment at $3M (vs $11M value-based price) could save $52B for US HAE patients. Lifetime costs reduced from $12-22M to $4M per patient
Bar charts comparing lifetime costs and total savings
ASCVD gene-editing TAM analysis: Value-based price of $165K per patient × 17M US patients with uncontrolled lipids = $2.8T market, 12x Lipitor's 20-year cumulative sales ($225B)
Value buildup waterfall and market size comparison
Return analysis showing AI-accelerated cures achieving 40-50% ROIC vs traditional drug development's <10%. Phase 1 pipeline value increases from negative for traditional to $2B+ for AI-enabled cures
ROIC comparison bars and pipeline value progression chart
Section divider
Section header
Framework showing shift from preventing early deaths (1950-2023: life expectancy 46.5→73 years) to targeting biological aging processes. Evolution of aging measures from clinical markers to DNA methylation clocks to proteomic/digital measures
Death distribution chart and aging measurement timeline
Analysis showing US healthy life potential could double from 11.7B to 23.6B quality-adjusted life years (QALYs). At $100K per QALY, longevity gain of 11.9B QALYs = $1.2 quadrillion opportunity. Current biotech represents only ~0.1% of TAM
Waterfall chart building to total longevity potential
Chapter on unlocking space economy. Authors: Daniel Maguire and Sam Korus
Chapter divider
Charts showing: 1) Annual upmass to orbit reached 3,500+ metric tons in 2025 vs ~500 in 2022, 2) Active satellites surged to 14,000+ (SpaceX Starlink accounts for ~66%). Major inflection post-Starlink launch in 2019
Two time series charts showing dramatic post-2019 growth
Wright's Law analysis showing SpaceX reduced costs 95% from ~$15,600/kg (2008) to <$1,000/kg (2025). Starship forecast to reach <$100/kg at scale. 17% cost decline per cumulative doubling of upmass
Logarithmic scatter plot with historical data and forecast
Wright's Law showing 44% bandwidth cost decline per doubling. Evolution from ViaSat-1 (2011) to Starship V4 forecast (2035). Table shows mobile connectivity evolution: 2001 GPRS (~1% coverage) to 2030E (100% coverage, unlimited data)
Logarithmic cost curve and mobile evolution comparison table
Chart showing satellite connectivity revenue could reach $160B+ (~15% of global communications revenue forecast). Revenue scales with constellation bandwidth (Tbps). Two percentage charts show satellite growing from ~0.01% to ~1.2% of GDP
Scatter plot and percentage comparison charts
Chapter on leveraging human labor. Authors: Sam Korus and Akaash TK
Chapter divider
Charts showing: 1) Labor productivity and participation coexisted (1948-2000), then diverged due to aging/globalization not automation, 2) Average US labor hours declined from ~2,000 (1950) to ~1,750 (2024)
Two time series: productivity/participation and hours worked
Robot density comparison: Amazon (6,427 robots per 10K employees) far exceeds automotive manufacturing (1,500 in US) and general manufacturing (1,129 in US). Global automotive leaders: Korea (2,867), China (1,422)
Grouped bar chart comparing robot density across countries and sectors
Breakdown showing ~$13T household robotics opportunity (2.8B workforce × 2.3 hrs/day × $12/hr × 50% time value) + ~$13T manufacturing opportunity ($32T global manufacturing GDP × 100% productivity uplift × 35% take rate)
Two calculation frameworks and cumulative unit sales comparison
Logarithmic analysis showing humanoids ~200,000x more complex than robotaxis across: kinetic demand (13x-16x), mobility (10x-30x), perception (4x-5x), adaptability (4x), error tolerance (100x less tolerant)
Waterfall chart building complexity multipliers on log scale
Chart mapping compute capacity to performance: Tesla FSD scaling laws project Optimus reaching human-level proficiency around 2028 with 1,080MW AI compute (vs 91MW in Dec 2025)
Log-log scatter plot with performance milestones
Company categorization: Specialized robots (ABB, FANUC, KUKA, Intuitive Surgical, etc.) vs Generalizable robotics (Tesla Optimus, Figure F.03, Boston Dynamics Atlas, 1X NEO, etc.). Market shifting to generalizable platforms
Two-column company listing with categorization
Chapter on powering AI revolution. Authors: Daniel Maguire, Sam Korus, Akaash TK
Chapter divider
Charts showing: 1) Energy intensity (kWh per GDP dollar) declining globally especially in China, 2) Global power capacity additions surged post-ChatGPT (2022), led by solar PV, wind, and battery storage reaching 1,000GW in 2024
Energy intensity line chart and capacity additions bar chart
Wright's Law analysis showing: 1) Solar and nuclear following steep cost curves (nuclear disrupted by 1975 regulation), 2) Battery costs (LFP and Nickel cells) declining steeply with cumulative MWh
Two log-log scatter plots showing cost trajectories
Analysis showing US electricity prices fell 1893-1974, then stagnated. If nuclear costs hadn't been disrupted, electricity would be ~40% cheaper. New build LCOE comparison shows nuclear SMR, solar+storage, wind+storage all below retail prices
Historical log scale chart and LCOE comparison bars
Charts showing cumulative global power capital investment must scale ~2x to ~$10T by 2030 (data centers: 5% of total). Stationary energy storage deployments must scale 19x from ~100GWh to ~19,000GWh
Two bar charts: capital investment and energy storage deployment
Chapter on cars driving themselves and lowering costs. Authors: Tasha Keeney and Daniel Maguire
Chapter divider
Charts showing Waymo reached ~400K daily driverless miles, 6B cumulative autonomous miles. Waymo market share in San Francisco operating zone reached ~60% by August 2025 vs Uber ~25% and Lyft ~15%
Three charts: daily miles, cumulative miles, market share area chart
Cost analysis showing robotaxi incremental cost per mile declining from ~$1.20 (Waymo 5th Gen early) to ~$0.25 (Cybercab at scale). Price per mile forecast: Human ride-hail $2.80 → Robotaxis $0.25 (2035E)
Stacked cost breakdown bars and price evolution comparison
Analysis showing ~140K robotaxis could serve current US urban ride-hail demand. ~24M robotaxis (<10% of US vehicle fleet) could accommodate majority of urban miles. Tesla has production capacity for top ride-hail cities
Time-of-day demand chart with production capacity comparison
Forecast showing robotaxi ecosystem generating $200B revenue, $20B EBIT, $34.1T enterprise value by 2030. Breakdown: Autonomous technology providers ($1.9T EV at 19x EBIT), fleet owners ($200B), manufacturers ($400B)
Three-column comparison: revenue, EBIT, enterprise value with multiples
Partnership matrix showing autonomous technology platforms (Tesla, Waymo, Baidu, etc.) partnering with automakers and fleet operators. Value capture: Technology platforms get 98% of EV, 97% of EBIT, 76% of revenue
Partnership matrix table and value capture breakdown
Chapter on slashing costs and delivery times. Authors: Tasha Keeney and Daniel Maguire
Chapter divider
Cumulative delivery data: Drones (Zipline 2M+, Meituan 780K, Wing 750K), Robot deliveries (Starship 9M, Meituan 4.9M), Autonomous trucking miles (Inceptio 250M, Pony.ai 4.2M, Aurora 3.8M, Kodiak 3M, Gatik 2.1M)
Three bar charts showing delivery volumes by company
Cost comparisons: Last mile delivery falls ~90% from $15 (app delivery fees) to <$1 (drone/robot). Truckload delivery falls ~60% from $0.07 to $0.03 per ton-mile (human diesel truck to autonomous electric)
Two side-by-side cost comparison charts
Forecast showing autonomous delivery revenue reaching $480B globally by 2030, split between last mile drone/robot ($160B) and over-the-road trucking ($320B). Regulation and back-end automation are gating factors
Stacked bar chart with 2030E projection
Introduction page to works cited section
Simple section header
Alphabetical bibliography starting with '36Kr European Central Station 2025' through 'Artificial Analysis 2025b', covering sources on robotics, AI, costs, energy, and finance
Two-column bibliography with standard citation format
Bibliography continuing from 'Arute, F. et al. 2019' through 'Bryce. 2025', covering quantum computing, retail, blockchain, and space industry sources
Two-column bibliography continuation
Bibliography continuing from 'Bureau of Labor Statistics 2026' through 'Guardant Health 2025', covering government data, blockchain analytics, and healthcare sources
Two-column bibliography continuation
Bibliography continuing from 'Hedges & Company 2025' through 'Roland, A. et al. 2024', covering automotive, longevity, AI performance, and pharmaceutical R&D sources
Two-column bibliography continuation
Final bibliography entries from 'rwa.xyz 2025' through 'Winton, B. 2024', followed by comprehensive legal disclaimer covering cryptocurrency risks, forward-looking statements, and copyright notice
Citations at top, multi-paragraph disclaimer below
คำถามทั่วไปเกี่ยวกับสไลด์นี้และเนื้อหาการนำเสนอพื้นฐาน
ARK forecasts global real GDP growth will accelerate from the IMF's consensus 3.1% to 7.3% annually through 2030, driven by five major innovation platforms (AI, Public Blockchains, Robotics, Energy Storage, and Multiomics). Capital investment alone could add 1.9 percentage points to annual growth, with additional gains from increased returns on invested capital, transformation of non-market activity into GDP, and freed human potential for productive use.
ARK projects data center systems investment will reach approximately $1.4 trillion annually by 2030, growing at a 30% compound annual rate. This represents a dramatic acceleration from the 5% CAGR seen from 2012-2023 to 29% CAGR post-ChatGPT. The forecast includes a shift toward accelerated compute (GPUs and ASICs) taking increasing market share from traditional servers.
ARK forecasts the robotaxi ecosystem could generate $34 trillion in enterprise value by 2030, with $200 billion in revenue and $20 billion in EBIT. Autonomous technology platforms are expected to capture 98% of enterprise value, 97% of EBIT, and 76% of revenue. The analysis suggests autonomous ride-hail could drop prices from $2.80 per mile (human-driven) to $0.25 per mile by 2035.
ARK projects the digital asset market could reach $28 trillion by 2030, growing at ~61% CAGR. Bitcoin is expected to dominate with 70% share (~$16 trillion at 63% CAGR), while smart contract networks could reach ~$6 trillion (54% CAGR). The forecast is based on penetration rates across six use cases: institutional investment, digital gold, emerging market safe haven, nation-state treasury, corporate treasury, and on-chain financial services.
ARK identifies a $26 trillion revenue opportunity split between household robotics ($13T) and manufacturing automation ($13T). The household opportunity is calculated from 2.8 billion global workforce × 2.3 hours unpaid work per day × $12/hour average × 50% time value. Manufacturing opportunity comes from $32T global manufacturing GDP × 100% productivity uplift × 35% provider take rate. Humanoid robots reaching human-level proficiency around 2028 is key to unlocking this market.
ARK's analysis shows AI could reduce drug development costs from $2.4 billion (industry average) to $0.7 billion for future AI-designed drugs—a 4x reduction. Time-to-market could decrease from 13 years to 8 years, and human trial failures could drop from 7.6 to 1.9. AI-developed drugs could generate $4 billion in cumulative cashflow over 30 years versus $1 billion for traditional drugs. Gene-editing cures are valued at 20x typical drugs.
Stablecoin adjusted transaction volumes reached $3.5 trillion monthly (30-day average) in December 2025, already 2.3x larger than Visa + PayPal + Remittances combined. The tokenized assets market tripled to $19 billion in 2025 and could reach $11 trillion by 2030, representing ~1.38% of all financial assets. DeFi applications are achieving extraordinary revenue efficiency, with companies like Hyperliquid generating $60M+ revenue per employee.
ARK identifies a $1.2 quadrillion US longevity market opportunity based on doubling healthy life potential from 11.7 billion to 23.6 billion quality-adjusted life years (QALYs). At $100,000 per QALY, this 11.9 billion QALY gain represents massive value. The multiomics-AI flywheel is accelerating this: molecular test data volumes will increase 10x by 2030 (exceeding frontier LLM training data), AI-enabled diagnostics will reach ~30% of FDA approvals, and gene-editing cures for rare diseases could be worth $3.5 billion each—20x typical drugs.

Create Your Own Slides
Turn your ideas into professional presentations in seconds with 2slides AI.
อ้างอิงการออกแบบมืออาชีพ เลือกสไตล์ของคุณ และสร้างสไลด์ด้วยการแสดงผลข้อความที่สมบูรณ์แบบ ขับเคลื่อนโดย Nano Banana—เริ่มสร้างการนำเสนอของคุณตอนนี้
เอเจนต์ AI ของคุณสำหรับสไลด์ ประหยัดเวลา เปล่งประกายเร็วขึ้นด้วยการสร้างงานนำเสนออัจฉริยะ




© 2026 2slides สงวนลิขสิทธิ์