
อยู่ในคอลเลกชัน ตัวอย่างงานนำเสนอสำหรับนักลงทุน · ตัวอย่างพรีเซนเทชันนักลงทุนเซมิคอนดักเตอร์
Applied Materials Q4 FY26 Earnings Presentation — Applied Materials' November 12, 2026 deck reporting record fiscal 2026 results (revenue $34.4B, non-GAAP EPS $12.89), AI-driven semiconductor equipment demand, EPIC Center co-innovation, and a first-quarter fiscal 2027 outlook.
ใช้หน้าปกของงานนำเสนอนี้เป็นต้นแบบสไตล์สำหรับสไลด์ที่สร้างจากเนื้อหาของคุณเอง หรือเลือกหน้าใดก็ได้ด้านล่างเพื่อใช้เลย์เอาต์ของหน้านั้นเป็นต้นแบบ
การนำทางด่วน
แท็ก
แชร์สไลด์
Applied Materials Q4 FY26 Earnings Presentation — Applied Materials' November 12, 2026 deck reporting record fiscal 2026 results (revenue $34.4B, non-GAAP EPS $12.89), AI-driven semiconductor equipment demand, EPIC Center co-innovation, and a first-quarter fiscal 2027 outlook.
มุมมองรายละเอียดของแต่ละหน้าสไลด์ รวมถึงlayout เนื้อหาหลักและองค์ประกอบภาพ
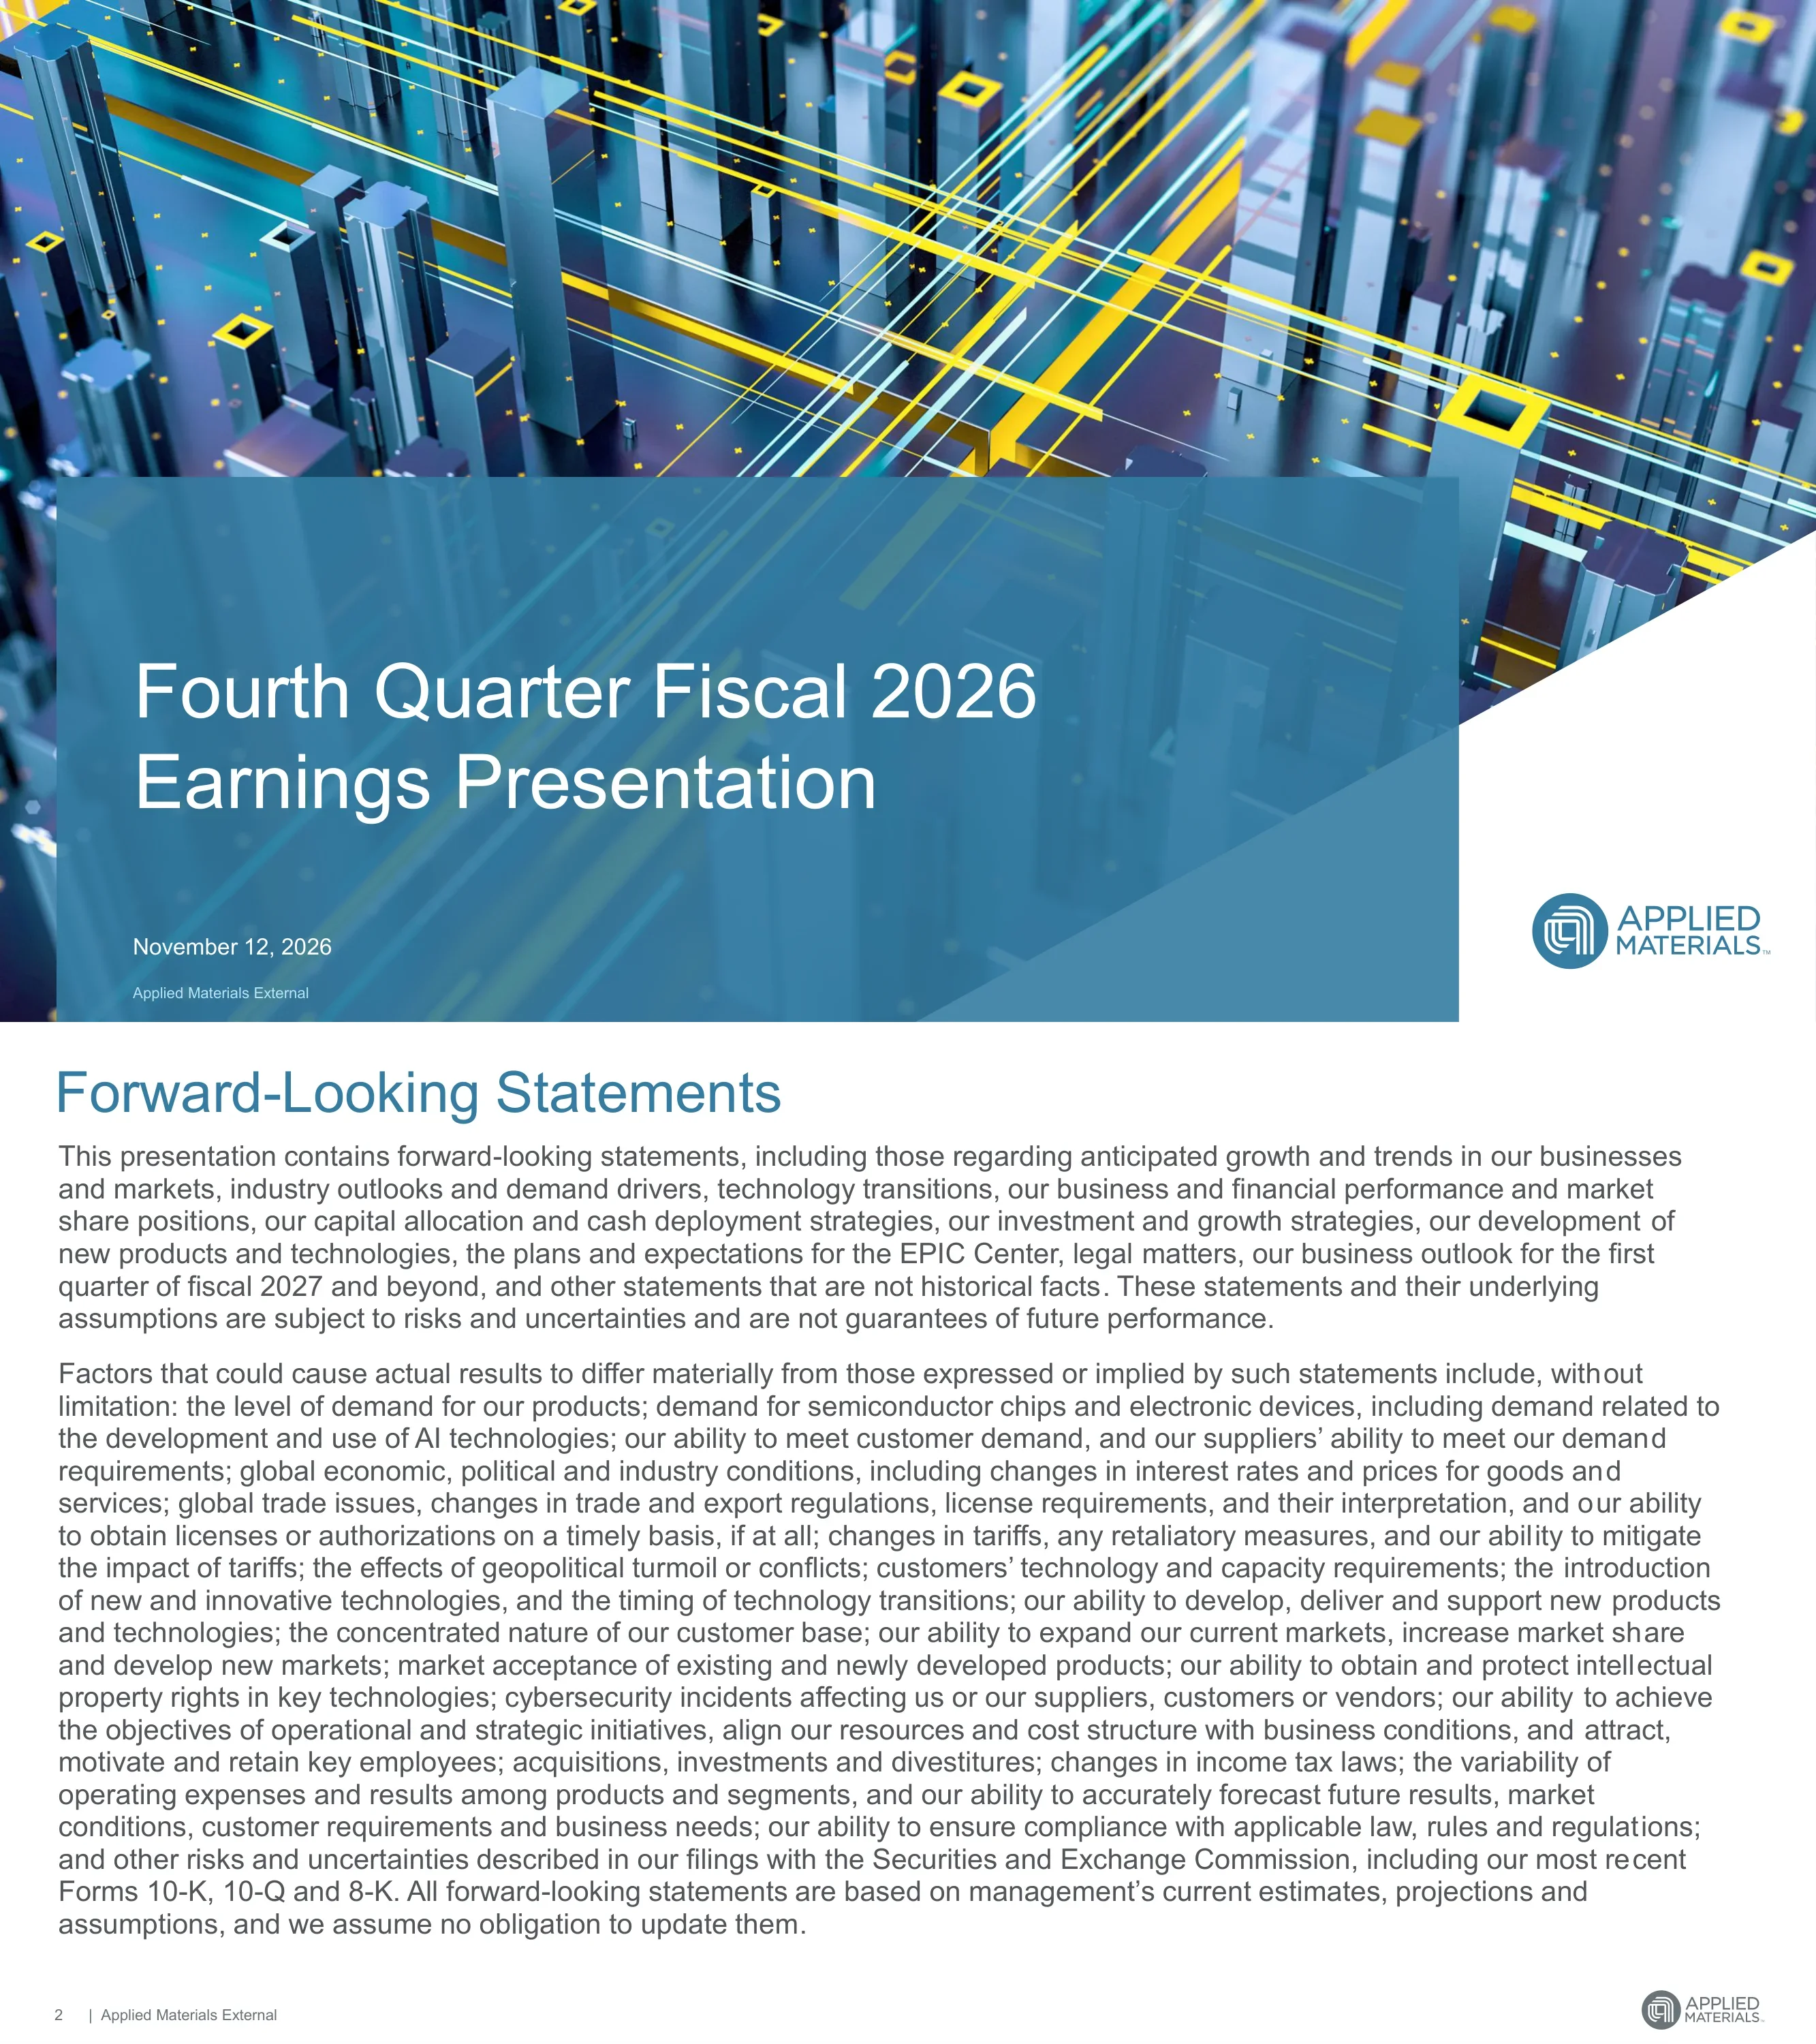
Title slide for Applied Materials' fourth quarter fiscal 2026 earnings presentation, dated November 12, 2026, marked 'Applied Materials External'.
Full-bleed 3D semiconductor-structure image with a translucent blue panel holding the title and date at lower left; logo at lower right.
Safe-harbor text stating the presentation contains forward-looking statements, including the business outlook for the first quarter of fiscal 2027. It lists risk factors such as demand levels, AI-related chip demand, trade and export regulations, tariffs, geopolitical conflict and customer concentration, and refers to SEC filings (Forms 10-K, 10-Q, 8-K).
Title at top followed by two dense full-width paragraphs of text.
Section divider introducing the CEO's portion of the presentation: Gary Dickerson, President and Chief Executive Officer.
Same background and blue panel as the title slide, with the speaker's name and title at left and a headshot photo at right.
Three headline cards: revenue $34.4B (+21% YoY, record), non-GAAP earnings per share $12.89 (+37% YoY, record), and non-GAAP gross margin 50.1% (+130 bps YoY). The slide notes this is the seventh consecutive year of growth.
Centered title, three equal blue stat cards in a row (two with 'RECORD' ribbons), tagline beneath, footnote at the bottom.
FY'26 revenue grew more than 21%, with earnings growing nearly twice as fast, which the slide cites as operating leverage. For CY'26 the company expects Semi Systems revenue up more than 40%, with advanced packaging expected to grow about 90% and inspection and metrology more than 50%. A footnote says CY'26 refers to FQ2'26 to FQ1'27 and that FQ1'27 will be a 14-week quarter.
Blue and yellow band with '2026 REVIEW' at left; white content box with bullets and sub-bullets at right.
Demand for advanced chips is described as much higher than supply, requiring multi-year investment in new fab capacity. The company expects WFE to grow more than 30% in 2027 and Applied to outperform the market again. It cites 8-quarter forecasts from its largest customers and alignment with 250+ supplier executives on capacity ramp plans.
Blue textured background with '2027 MARKET OUTLOOK' at left and a white bullet panel at right.
The key building blocks of AI hardware are leading-edge foundry-logic (transistors and on-chip wiring), high-speed memory (DRAM and HBM) and advanced packaging (chip-to-chip wiring). In an AI data center about 60% of capital cost is silicon, more than 85% of silicon content is in these areas, and they are expected to drive about 75% of WFE growth through 2030.
Dark teal slide with a server rack image at left, three stacked capability bands in the middle and a bullet panel at right.
Equation-style slide: AI opportunities (leading-edge foundry-logic, DRAM and advanced packaging, where Applied is #1 in process equipment) multiplied by Applied's advantages (materials, integration and yield innovation, accelerated by the EPIC co-innovation platform) equals value creation. For CY'25 to CY'30 it lists >2 ppts wafer fab equipment share, +20% service revenue per tool, +5 ppts gross margin and +10 ppts operating margin.
Three rounded column headers joined by 'x' and '=' symbols, each with text beneath; 'Investor Breakfast 2026' badge at upper left.
A tree diagram splits the race for AI computing leadership into a Technology Race (enabling tokens per second per watt; device/chip and system/packaging innovation) and a Capacity Race (data center and fab capacity; fab yield and output; new fab ramp velocity). Below, Applied's most enabling portfolio is shown as Materials Innovation + Integration Innovation + Yield Innovation, accelerated by EPIC high-velocity co-innovation.
Top-down flow diagram with dotted connectors in the upper half and a banner with three pill-shaped boxes feeding a looped EPIC box in the lower half.
Table of WFE market segments with share of total WFE and Applied's position: Deposition 23% (~2.5x nearest competitor), Etch 19% (leader in conductor etch for advanced foundry-logic and DRAM), Materials Modification and Treatments 15% (>2x nearest competitor), Metrology and Inspection 15% (~2x nearest competitor in eBeam) and Lithography 29%. Many technologies are marked #1 (CVD, epitaxy, PVD, CMP, implant, thermal, eBeam). Footnotes cite 2026 estimates and TechInsights WFE definitions.
Wide table with market, % of total WFE, technology list with Applied position marks, and a competitive-advantage column; closing banner below.
Industry-leading capabilities are grouped as materials innovation (concurrent co-development of deposition, etch, materials modification and metrology), integration innovation (device integration, simulation and modeling teams formed in 2017; labs connected through EPIC) and yield innovation (highest-resolution eBeam imaging, AI-enabled services). These lead to unique solutions: unit process, co-optimized, integrated (IMS) and IMS with partners.
Left panel of three text groups with an arrow pointing to a right panel of four equipment-flow illustrations.
Describes value to EPIC partners (first-to-market with next-generation technology, fastest ramp to high yield and output, earlier R&D access, faster learning cycles, co-location and concurrent development without serial hand-offs) and value to Applied (designed in earlier, visibility across several generations of customer roadmaps, increased R&D productivity and value sharing).
Large upward arrow at left labeled by three tiers, center column of bullet groups, and a dark rounded panel at right for value to Applied.
Lists 15 announced EPIC engagements. Founding partners: Micron, Samsung, SK hynix, TSMC and Intel (new this quarter). Innovation partners: Advantest, Broadcom, SCREEN, KIOXIA (new) and Besi (new). Research partners: ASU, RPI, Stanford, UC Berkeley and UCLA (new).
Photo of the EPIC Center building across the top, a banner headline, and three columns of partner tiles; new partners highlighted in yellow.
AI is driving multi-year expansion in chip demand and Applied is positioned to lead and outperform. FY'26 was a record year; in CY'26 Applied is on track to grow Semi Systems revenue more than 40%; in 2027 it expects another strong year for the industry and to outperform the market and make significant progress toward long-term targets.
'CEO SUMMARY' label at left with yellow and navy bands; white panel with bold headline and bullets at right.
Section divider introducing the CFO's portion: Brice Hill, SVP, Chief Financial Officer.
Same layout as the CEO divider: name and title at left, headshot at right over the 3D chip background.
Third consecutive quarter of double-digit QoQ and YoY growth in revenue, operating profit and non-GAAP EPS; 14 consecutive quarters of YoY gross margin expansion; and an expectation to outperform in CY'26 with strong growth in leading-edge foundry-logic, DRAM and advanced packaging.
Large 'CFO OVERVIEW' label in a white hexagon at left with a yellow diagonal band; white bullet panel at right.
Three columns. Demand: cloud capex expected to grow more than 50% in 2027 to well over $1 trillion, with AI token usage surging. Case study: more than 80% of Applied employees use AI tools, all software developers use AI with average productivity gain above 40%, and monthly token volume is up more than 50x this year. Silicon demand: leading-edge foundry-logic and DRAM fabs at full utilization, NAND not far behind, ICAPS now healthy.
Three equal columns with blue rounded headers and white bullet panels on a gray background.
Applied is expanding supply chain capacity and has raised demand forecasts to suppliers every quarter this year. It says cleanroom capacity remains the gating factor, is tracking more than 20 fab ramps and line expansions in 2027, and added more than 10 major fab projects to its tracker for a third quarter in a row. It is investing to double systems output from Q4'26 levels by FY'28 and more than double manufacturing and lab capacity by 2030.
Three horizontal color-coded bands (blue, yellow, green), each with chevron bullets.
FY'26 versus FY'25 in $M except EPS: revenue 34,446 vs 28,368 (+21%); gross margin 50.1% vs 48.8% (+130bps); operating expenses 5,840 vs 5,273 (+11%); operating margin 33.1% vs 30.2% (+290bps); OIE 158 vs 140; tax rate 11.0% vs 12.6%; net income 10,301 vs 7,607 (+35%); EPS $12.89 vs $9.42 (+37%).
Financial table with row labels at left and three color-coded columns (FY'25 gray, FY'26 green, YoY blue).
FQ4'26 revenue was $10,409M (+53% YoY, +14% QoQ) with gross margin 50.6%, operating expenses $1,587M, operating margin 35.3%, net income $3,321M and EPS $4.16 (+92% YoY, +19% QoQ). Highlights include record Semi Systems revenue (+64% YoY), AGS record revenue (+26% YoY), gross margin up 250bps on favorable mix and higher pricing, and opex at 15.2% of revenue (down 430bps YoY).
Table with FQ4'25, FQ3'26, FQ4'26, YoY and QoQ columns at left and a highlights bullet list at right; recast footnote at the bottom.
Semiconductor Systems revenue rose from $4,879M (FQ4'25) to $5,141M, $5,965M, $7,040M and $7,996M (FQ4'26), with non-GAAP operating margin of 29.6%, 32.9%, 35.2%, 38.0% and 39.0%. Applied Global Services revenue was $1,506M, $1,559M, $1,665M, $1,781M and $1,896M, with margins of 28.8%, 28.1%, 29.2%, 30.1% and 30.5%.
Two side-by-side panels, each a five-bar column chart with a green margin line overlay.
FY'26 operating cash flow was $8,868M and free cash flow $6,196M. FQ4'26 operating cash flow was $3,300M and free cash flow $2,616M. FY'26 shareholder distributions totaled $4,748M (repurchases $3,177M, dividends $1,571M); FQ4'26 repurchases were $2,000M. The slide states a commitment to distribute 80-100% of FCF over time and $10.8B remaining on the repurchase authorization.
Two stacked tables (cash flows, shareholder distributions) with five quarterly columns and an FY'26 column, plus a centered commitment statement.
Q1 FY27 outlook: total revenue ~$11.1B +/- $500M and non-GAAP EPS ~$4.35 +/- $0.20. Revenue by segment is Semiconductor Systems ~$8.7B, Applied Global Services ~$2.0B and Other ~$400M. Other items: non-GAAP gross margin ~50.8%, operating expenses ~$1.7B and tax rate ~13%. FQ1'27 is a 14-week quarter.
Blue label panel at left and a grouped white table at right with Outlook, Revenue and Other sections.
AI is adding a fast-growing incremental layer of demand. Applied's portfolio drives revenue growth and gross margin expansion, it is delivering operating leverage, cash flow and the largest quarterly buyback in over 8 years, and customers are providing longer visibility with a strong, record year expected in 2027. It is investing to ramp beyond next year and has high confidence in progress toward CY30 targets.
Same format as the CFO Overview: label at left, white panel with six bullets at right.
Question-and-answer divider slide.
Solid blue background with large white 'Q&A' text centered.
Recast versus previously reported segment data for FY24 and FQ1'25 to FQ4'25. For example, recast Semiconductor Systems FY24 revenue is $21,014M versus $19,911M previously, and recast AGS FY24 revenue is $5,122M versus $6,225M. Tables also show revenue mix (foundry/logic, DRAM, flash), operating income and margins. A footnote explains the move of the 200-millimeter business to Semiconductor Systems and full allocation of corporate support costs.
Two side-by-side dense tables (Recast and Previously Reported) with Semiconductor Systems, AGS and Other/Corporate sections.
Strategy: 1) invest in R&D and infrastructure; 2) grow dividend per share and use buybacks to distribute excess FCF. Over the past 10 fiscal years through FY26 Applied reinvested more than $27B in R&D and more than $10B in capital additions, distributed 87% of FCF, grew dividend per share at an 18% CAGR and reduced shares outstanding by about 27%. Quarterly dividend per share reached $0.53 in FY26 (from $0.26 in FY22).
Gray top banner with two priorities and a ten-year summary; two bar charts below (quarterly dividend per share FY05-FY26, shares outstanding FY16-FY26) and a commitment line.
At FQ4'26 cash and cash equivalents were $7,239M, short-term investments $2,100M and long-term investments $4,756M, for total cash and investments of $14,095M. Debt was short-term $1,299M and long-term $5,233M, totaling $6,532M. Ratings shown are P-1 / A-1 short-term and A2 / A long-term (Moody's / S&P).
Table with five quarterly columns (FQ4'25 to FQ4'26, latest highlighted) in cash and investments and debt sections.
Presents the Net Zero 2040 Playbook with a link to the 2025 Impact Report and latest third-party ESG ratings: CDP Climate B, CDP Water A-, MSCI AAA, Sustainalytics Risk Rating Low, and ISS (E/S/G) 1/3/1.
Full-bleed wind-turbine landscape photo with Net Zero logo at left and a translucent ratings table at right.
Resource list with links: Investor Relations Home Page, Newsroom, 2026 Investor Breakfast Presentation, 2026 DRAM and Advanced Packaging Master Class, and 2026 Logic Master Class.
Photo of a laptop and coffee cup on a light blue background with a white list panel of labels and LINK hyperlinks.
Section divider introducing the appendix of GAAP to non-GAAP reconciliations.
Solid blue background with the title text at lower left.
Explains that non-GAAP measures adjust for items such as M&A-related items, restructuring and severance, legal settlements, impairments and strategic investment gains and losses. Management uses them to evaluate performance and in its executive compensation program, and the slide states their limitations and that they are not a substitute for GAAP measures.
Title with two long paragraphs of text.
Quarterly FQ4'25 to FQ4'26 reconciliation. FQ4'26: GAAP gross profit $5,251M to non-GAAP $5,263M (50.6%); GAAP operating income $3,658M to non-GAAP $3,676M (35.3%); GAAP net income $2,718M to non-GAAP $3,321M. FQ1'26 includes a $253M legal settlement with the U.S. Commerce Department Bureau of Industry and Security. Footnotes explain acquisition, restructuring and tax items.
Large reconciliation table with five quarterly columns and a footnotes column at right.
Quarterly EPS reconciliation. FQ4'26 GAAP diluted EPS is $3.40 and non-GAAP EPS is $4.16 (798M weighted diluted shares); FQ3'26 non-GAAP EPS is $3.50, FQ2'26 $2.86, FQ1'26 $2.38 and FQ4'25 $2.17. Adjustments include unrealized gains or losses on strategic investments and a $0.32 legal settlement item in FQ1'26.
Single table of per-share adjustments across five quarters, with empty space below.
Segment reconciliation by quarter. FQ4'26 Semiconductor Systems non-GAAP gross profit is $4,412M (55.2%) and non-GAAP operating income $3,115M (39.0%); AGS non-GAAP gross profit is $665M (35.1%) and non-GAAP operating income $578M (30.5%). Footnotes cover acquisition items and the $253M settlement.
Table with four blocks (segment gross profit and operating income) and footnotes beneath.
FQ4'26 GAAP operating expenses of $1,593M reconcile to non-GAAP operating expenses of $1,587M after adjustments for acquisition items (2) and integration costs (8) and a restructuring credit of 4. Earlier quarters: $1,553M GAAP and $1,325M non-GAAP in FQ4'25, with a $253M legal settlement removed in FQ1'26.
Compact table at top with footnotes below; lower half empty.
Reconciles GAAP interest expense and interest and other income (expense), net to non-GAAP OIE. FQ4'26 GAAP is (581) with adjustments of (18) and 653, giving non-GAAP OIE of $54M; other quarters are $33M, $27M, $32M and $45M (FQ4'25 to FQ3'26).
Short table at top of slide, remainder empty.
FQ4'26 GAAP provision for income taxes is $359M with a GAAP effective rate of 11.7%; non-GAAP provision is $409M on non-GAAP pre-tax income of $3,730M, giving 11.0%. Non-GAAP rate was 12.5% in FQ4'25 and 11.0% in each of the following four quarters shown.
Two stacked reconciliation blocks (tax provision and pre-tax income) with rate rows at the bottom.
Free cash flow is operating cash flow less capital expenditures. FQ4'26: $3,300M less $684M gives $2,616M. Other quarters: FQ4'25 $2,043M, FQ1'26 $1,040M, FQ2'26 $210M, FQ3'26 $2,330M.
Small three-row table with a footnote defining free cash flow.
FY2026 versus FY2025: GAAP gross profit $17,219M vs $13,808M (non-GAAP $17,255M, 50.1%, vs $13,835M, 48.8%); GAAP operating income $11,087M vs $8,289M (non-GAAP $11,415M, 33.1%, vs $8,562M, 30.2%); GAAP net income $10,088M vs $6,998M (non-GAAP $10,301M vs $7,607M). Footnotes describe FY25 Singapore tax items and the FY26 $253M settlement.
Long reconciliation table with two year columns and numbered footnotes at right.
FY2026 GAAP EPS of $12.62 reconciles to non-GAAP EPS of $12.89 (799M diluted shares); FY2025 GAAP EPS of $8.66 reconciles to $9.42 (808M shares). Footnotes explain FY25 tax-related per-share impacts.
Per-share adjustment table with two year columns and two footnotes.
FY2026 Semiconductor Systems non-GAAP gross profit is $14,386M (55.0%) and non-GAAP operating income $9,581M (36.6%); AGS non-GAAP gross profit is $2,413M (35.0%) and non-GAAP operating income $2,039M (29.5%). FY2025 comparisons were 53.4% and 32.5% for Semiconductor Systems and 33.5% and 27.0% for AGS.
Segment table with FY2025 and FY2026 columns and footnote and note boxes at the bottom.
FY2026 GAAP operating expenses of $6,132M reconcile to non-GAAP operating expenses of $5,840M after removing acquisition items (15), integration costs (16), the legal settlement (253) and restructuring (8). FY2025 went from $5,519M to $5,273M.
Compact table with footnotes beneath.
FY2026 GAAP interest and other items of $450M reconcile to non-GAAP OIE of $158M (FY2025: $982M to $140M), adjusting for strategic investment gains and losses.
Short table at top of slide, remainder empty.
FY2026 GAAP provision for income taxes is $1,449M (GAAP effective rate 12.6%) and non-GAAP provision is $1,272M on non-GAAP pre-tax income of $11,573M, a non-GAAP effective rate of 11.0%. FY2025 was 24.5% GAAP and 12.6% non-GAAP.
Two stacked reconciliation blocks with GAAP and non-GAAP rate rows at the bottom.
Ten years of free cash flow (operating cash flow less capex): FY2017 $3,444M, FY2018 $3,165M, FY2019 $2,806M, FY2020 $3,382M, FY2021 $4,774M, FY2022 $4,612M, FY2023 $7,594M, FY2024 $7,487M, FY2025 $5,698M and FY2026 $6,196M. FY2026 operating cash flow was $8,868M and capex $2,672M.
Two stacked tables covering FY2017-FY2021 and FY2022-FY2026, with a definition footnote.
States that the non-GAAP outlook for Q1 fiscal 2027 excludes known acquisition-related charges of about $11 million and includes a net income tax benefit of about $28 million related to intra-entity intangible asset transfers, and does not reflect unknown items.
Title with a single white text box and a large empty area below.
Closing brand slide with the Applied Materials logo and the tagline 'Material Innovation'.
Solid blue background with the centered logo and tagline.
คำถามทั่วไปเกี่ยวกับสไลด์นี้และเนื้อหาการนำเสนอพื้นฐาน
It covers the fourth quarter and full year of fiscal 2026, with the deck dated November 12, 2026. It compares FQ4'26 with FQ3'26 and FQ4'25, and FY'26 with FY'25.
Fiscal 2026 revenue was $34.4B (+21% YoY, a record), non-GAAP EPS was $12.89 (+37%, a record) and non-GAAP gross margin was 50.1% (+130 bps). The deck calls it the seventh consecutive year of growth.
FQ4'26 revenue was $10,409M (+53% YoY, +14% QoQ), non-GAAP gross margin 50.6%, non-GAAP operating margin 35.3%, non-GAAP net income $3,321M and non-GAAP EPS $4.16. Semiconductor Systems revenue was $7,996M and Applied Global Services revenue was $1,896M.
The deck guides to total revenue of ~$11.1B +/- $500M and non-GAAP EPS of ~$4.35 +/- $0.20, with Semiconductor Systems ~$8.7B, Applied Global Services ~$2.0B, non-GAAP gross margin ~50.8%, operating expenses ~$1.7B and a tax rate of ~13%. FQ1'27 will be a 14-week quarter.
It opens with forward-looking statements, then a CEO section (fiscal year highlights, 2026 review, 2027 outlook, AI portfolio, Investor Breakfast 2026 slides, EPIC Center and summary), followed by a CFO section (financial results, segment results, cash flows, outlook and summary). It ends with Q&A, a segment table, capital allocation, balance sheet, ESG ratings, resources and a GAAP to non-GAAP reconciliation appendix.
It describes EPIC as a high-velocity co-innovation platform and shows 15 announced engagements across founding, innovation and research partners. Intel, KIOXIA, Besi and UCLA are marked as new this quarter.
It was published on Applied Materials' investor relations site at ir.appliedmaterials.com, which the slides also reference for the non-GAAP reconciliation.
Yes. The appendix has quarterly and full-year reconciliations for gross profit, operating income, net income, EPS, segment results, operating expenses, other income/expense, effective tax rate and free cash flow, including ten years of free cash flow.

Create Your Own Slides
Turn your ideas into professional presentations in seconds with 2slides AI.
อ้างอิงการออกแบบมืออาชีพ เลือกสไตล์ของคุณ และสร้างสไลด์ด้วยการแสดงผลข้อความที่สมบูรณ์แบบ ขับเคลื่อนโดย Nano Banana—เริ่มสร้างการนำเสนอของคุณตอนนี้
เอเจนต์ AI ของคุณสำหรับสไลด์ ประหยัดเวลา เปล่งประกายเร็วขึ้นด้วยการสร้างงานนำเสนออัจฉริยะ


© 2026 2slides สงวนลิขสิทธิ์