
Входит в коллекцию Примеры презентаций для инвесторов · Примеры презентаций для e-commerce · Примеры презентаций для инвесторов из Японии
ZOZO H1 FY2026 Earnings Presentation (first half of the year ending March 2027) — results for Japan's largest online fashion marketplace ZOZOTOWN, translated from the Japanese 決算説明会資料 filed on TDnet
Использует обложку этой презентации как образец стиля для слайдов с вашим содержанием. Или выберите любую страницу ниже, чтобы взять за образец её макет.
Быстрая навигация
Теги
Поделиться слайдами
ZOZO H1 FY2026 Earnings Presentation (first half of the year ending March 2027) — results for Japan's largest online fashion marketplace ZOZOTOWN, translated from the Japanese 決算説明会資料 filed on TDnet
Подробный просмотр каждой страницы слайда, включая макет, ключевой контент и визуальные элементы.
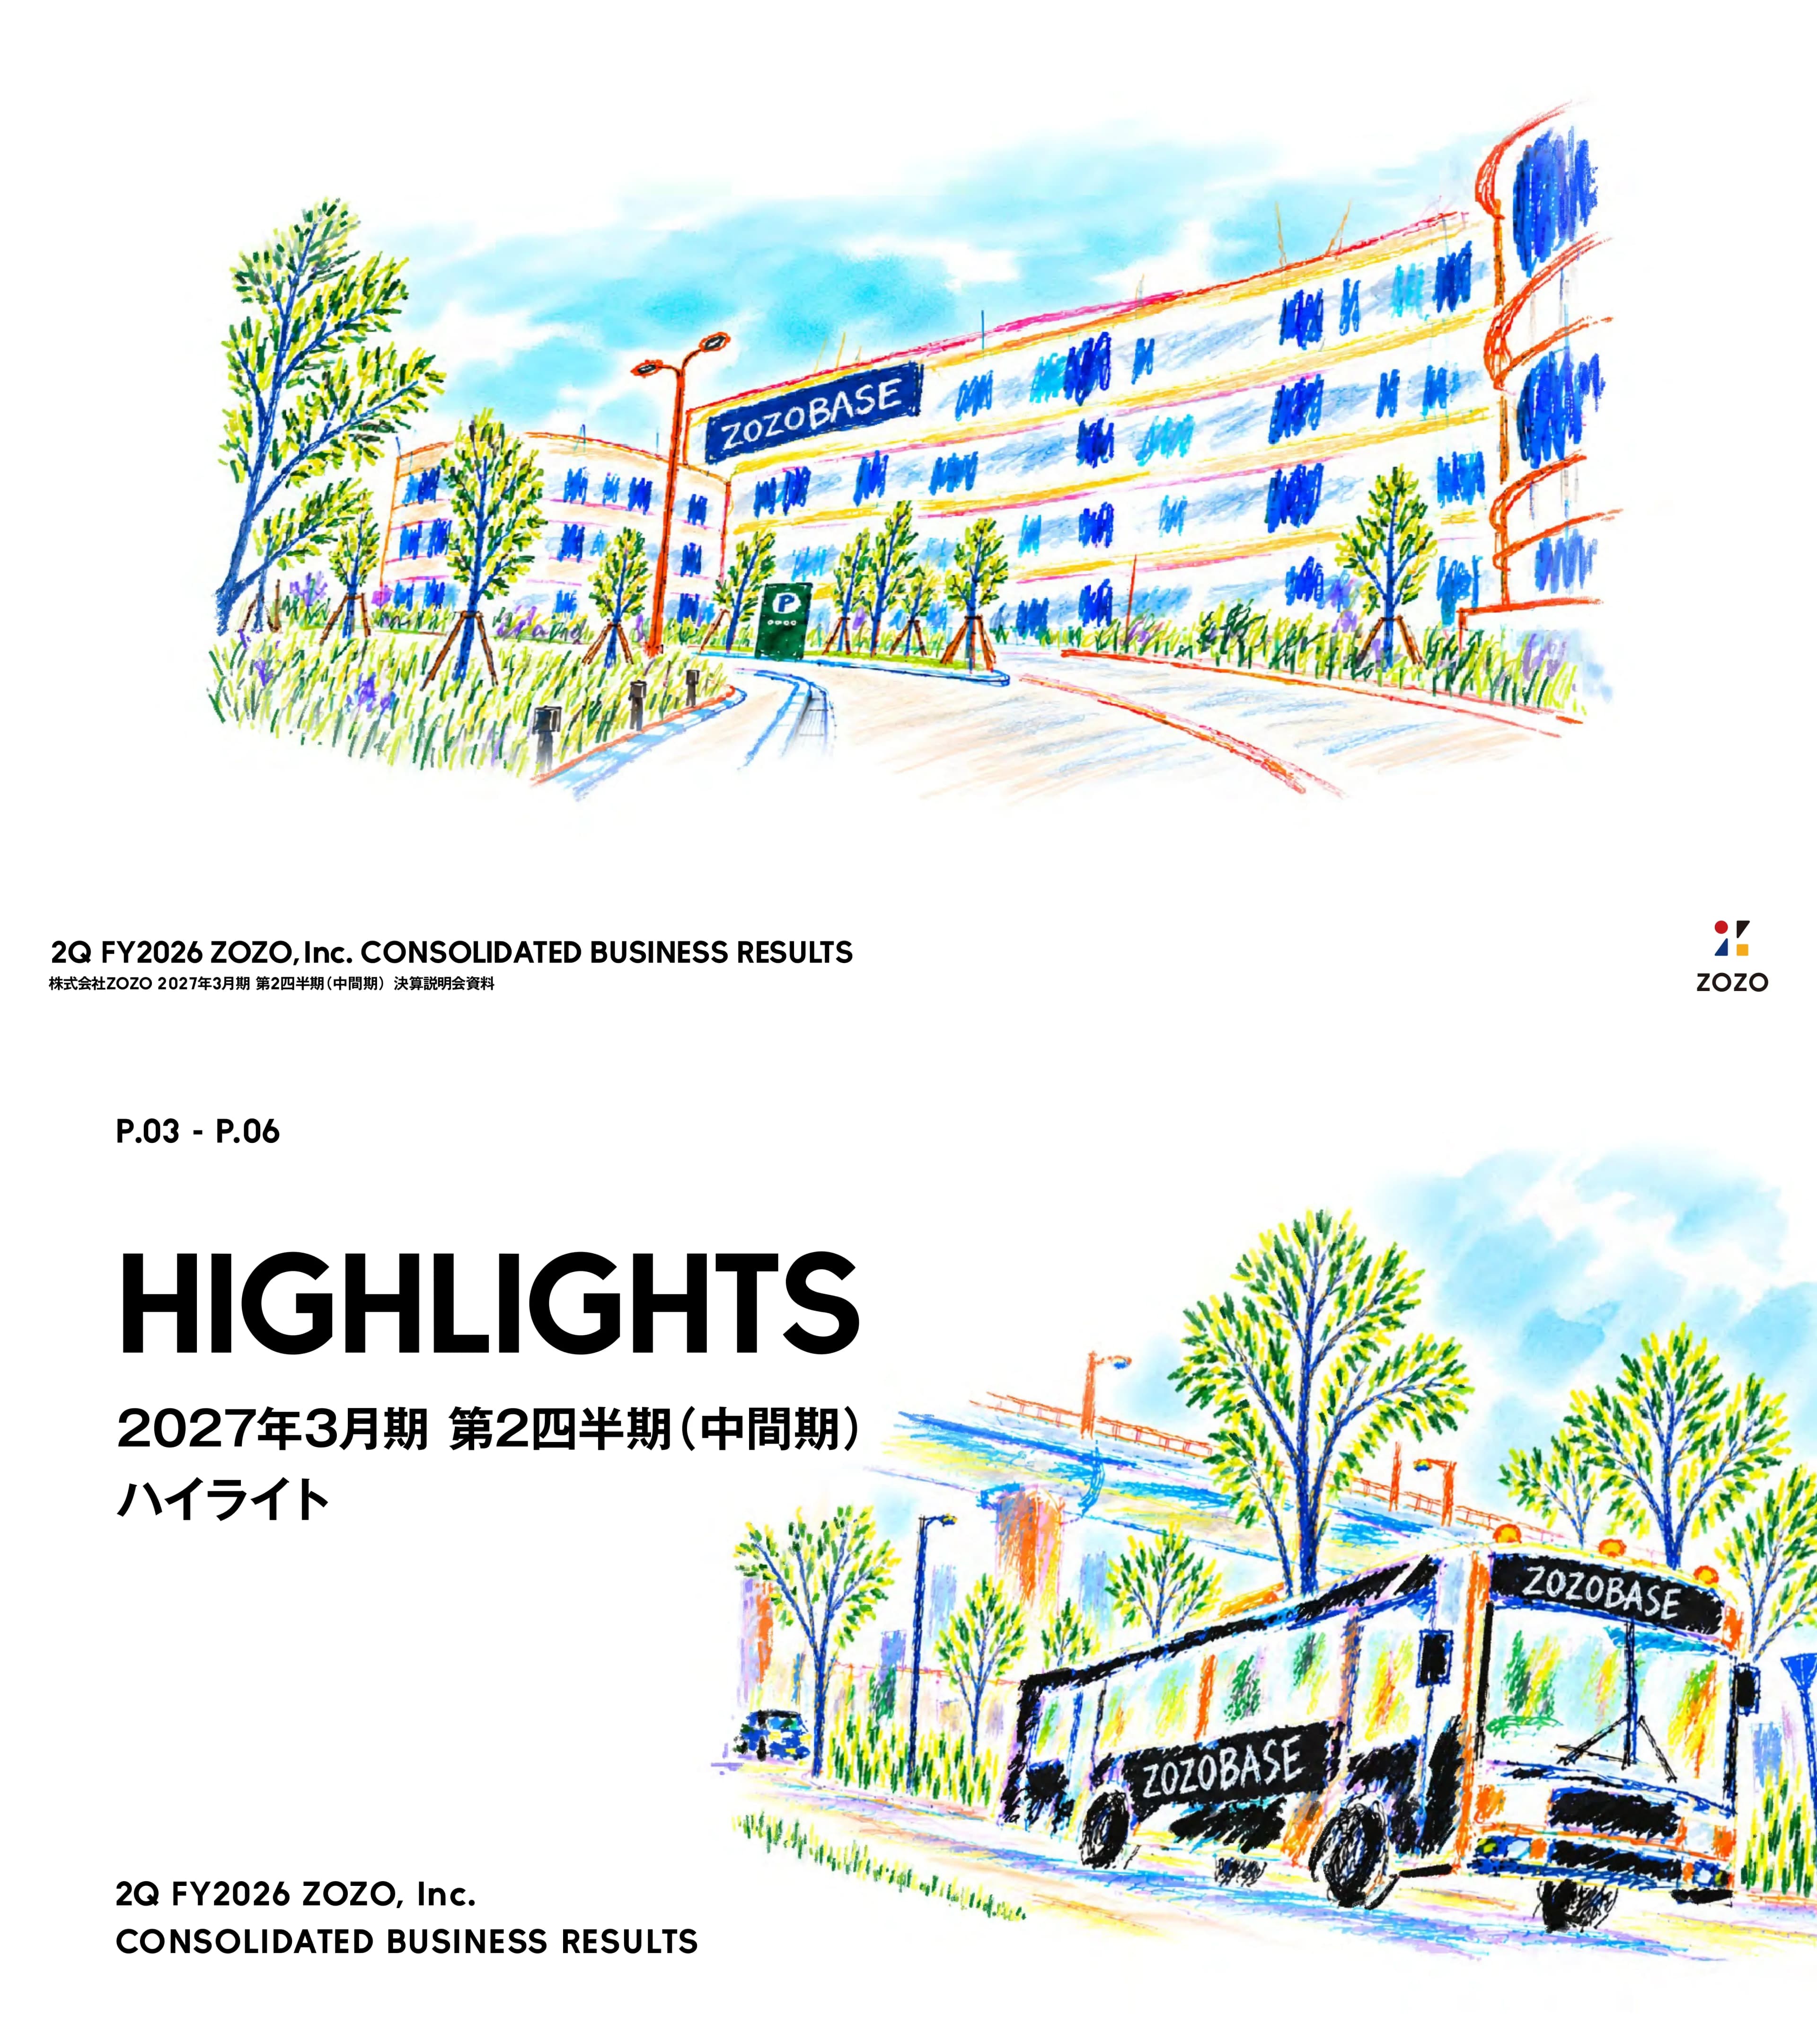
Cover of ZOZO's first-half (interim) results briefing for the fiscal year ending March 2027 (FY2026), with the English title over the Japanese subtitle 株式会社ZOZO 2027年3月期 第2四半期(中間期)決算説明会資料.
Full-bleed hand-drawn crayon illustration of the ZOZOBASE logistics centre with tree-lined approach road; title block bottom-left, ZOZO logo bottom-right.
Opens the highlights section for the 2Q (interim) period of the fiscal year ending March 2027.
Large bold 'HIGHLIGHTS' headline left with page range and Japanese subtitle; crayon illustration of a ZOZOBASE shuttle bus on the right.
Gross merchandise value (GMV) excluding other GMV reached a record interim ¥309.29 billion (3,092.9億円, +5.7% YoY), total GMV ¥309.43 billion (-1.0%); adjusted EBITA rose 5.1% to ¥34.61 billion, slightly ahead of plan on logistics cost control and deferred promotion spending. By segment: ZOZOTOWN GMV ¥245.88 billion (+4.4%; consignment ¥234.50 billion, purchased/manufactured ¥1.52 billion, USED ¥9.85 billion), LINE Yahoo Commerce ¥38.46 billion (+11.7%), cosmetics ¥9.37 billion (+18.7%), LYST ¥21.61 billion (+16.0%), BtoB ¥3.31 billion (-16.9%); average order value ¥8,388 (+2.5%), average item price ¥3,640 (+1.6%), advertising revenue ¥5.78 billion (+5.8%). A cooler-than-usual summer weighed on ZOZOTOWN slightly versus plan.
Text-heavy bullet page: headline statement, 'results overview' block with two KPI bullets and commentary, then 'by business' list of seven segment bullets; dense footnotes defining LINE Yahoo Commerce and 'other GMV'.
Adjusted EBITA margin on GMV held at 11.2% (same as prior year): improvements from better delivery-partner terms (from Oct 2025), lower shipping cost ratio and warehouse efficiency were offset by an extra month of LYST consolidation, a higher effective promotion-cost ratio and new depreciation on outbound material-handling equipment. Topics list 12 items from Aug-Oct 2026: disaster-relief donations, Integrated Report Portal FY2025, a ZOZOMO OMO stock-check option for brand sites, a Red Dot design award for the ZOZOTOWN 20th-anniversary fashion white paper, a UNHCR partnership, the AI 'what suits you' styling feature 似合うルーム by ZOZO on WEAR, a Pokemon 30th-anniversary T-shirt collection, a ZOZOTOWN pop-up in MUSINSA Seoul, a ZOZO NEXT x AVITA MOU on humanoid-robot clothing, ZOZOFIT Pro launch in the US, a ZOZO NEXT x DFKI AI research collaboration, and the decision to end the ZOZOMETRY body-measurement service.
Two text blocks: profitability bullets with improvement/deterioration factors, then a long dated list of corporate topics with circle bullets.
Medium-term plan targets adjusted EBITA of ¥90 billion (900億円) for the fiscal year ending March 2030, split into More Fashion (ZOZOTOWN) ¥80 billion, Near Fashion ¥5 billion and Global ¥5 billion. 2Q topics: Pokemon T-shirt collection and the WEAR AI 'fashion core diagnosis' with 28 types and virtual try-on (More Fashion); sending ZOZOTOWN users to High Link's fragrance platform 'Kalaria' and opening a High Link shop on ZOZOTOWN (Near Fashion); expanding LYST checkout partners and launching ZOZOFIT Pro for trainers and clinics (Global).
Headline with plan target, then three colour-coded columns (black, red, navy) each with a large EBITA target figure on top and a grey topic box below.
Purpose: stronger shareholder returns and higher ROE. Policy targets a 5-year average total payout ratio above 80% from FY ending March 2024, with a 70% dividend payout base plus flexible buybacks. Buyback cap ¥30 billion or 43 million shares (market purchase) from June 17 to Dec 30, 2026; all repurchased shares to be cancelled on Jan 29, 2027; FY ROE expected above 50% (vs 46.6% prior year). As of Sept 30, 2026, 16,911,800 shares had been bought for ¥19.165 billion.
Four-row two-column table (grey label column, white detail column) under a title and purpose line; progress note at bottom.
Opens the business results section for the interim period.
Bold 'BUSINESS RESULTS' headline at left with Japanese subtitle; crayon drawing of a black ZOZOTOWN delivery box at right.
Interim results in ¥ million vs prior year and full-year plan: GMV 309,433 (-1.0%; 45.5% of plan), GMV ex-other 309,290 (+5.7%), net sales 110,642 (+5.1%; 45.7% of plan), gross profit 102,756 (33.2% of GMV), SG&A 69,930 (22.6%), operating profit 32,825 (+5.6%; 10.6% margin; 44.1% of plan), adjusted EBITA 34,614 (+5.1%; 11.2%), ordinary profit 32,871 (+6.6%) and profit attributable to owners 21,751 (+3.5%; 43.8% of the ¥49.7 billion plan).
Full-width financial table with six columns: prior-year 2Q, current 2Q, YoY, initial plan, achievement rate; dotted rows for ratio-to-GMV lines.
Quarterly table for FY2025 Q1-Q4 and FY2026 Q1-Q2 (¥ million): 2Q GMV ex-other 152,595 (+6.3% YoY), net sales 54,510, SG&A 35,342 (23.2% of GMV), operating profit 14,941 (+5.6%; 9.8%), adjusted EBITA 15,867 (+7.0%; 10.4%). Q1 was GMV ex-other 156,694 (+5.1%) and adjusted EBITA 18,746.
Wide quarterly table with two fiscal-year header groups and six quarter columns; rows for GMV, sales, SG&A, operating profit and EBITA with YoY and ratio sub-rows.
Waterfall from ¥32.92 billion to ¥34.61 billion adjusted EBITA: ZOZOTOWN + LINE Yahoo Commerce gross profit +¥3.75 billion, advertising sales +¥0.31 billion, other gross profit +¥0.97 billion (LYST and High Link consolidation), fixed costs -¥1.41 billion, variable costs +¥0.53 billion (better delivery terms, logistics efficiency), effective PR costs -¥1.58 billion, other costs -¥0.88 billion.
Horizontal waterfall chart with black start/end bars and dashed floating boxes, split under arrows labelled 'non-cost changes' and 'cost changes'; footnotes define each cost bucket.
As of Sept 30, 2026 vs Mar 31, 2026 (¥ million): total assets 174,892 (from 198,260), cash 33,291 (from 69,416), inventory 4,197, intangible assets 31,967; total liabilities 82,780 with short-term borrowings 20,001; shareholders' equity 88,785 with treasury stock -28,480; net assets 92,112. A speech-bubble note from an executive explains cash fell on buyback deposits, dividends and tax payments, with about ¥19.1 billion of the ¥30 billion buyback completed.
Side-by-side assets and liabilities/equity table with two period columns each; vertical Japanese speech bubble with 'POINT 01' badge and crayon portrait at right.
Operating cash flow ¥21.50 billion (+¥4.26 billion on higher pre-tax profit), investing -¥9.64 billion (High Link acquisition this year vs LYST acquisition last year), financing -¥47.95 billion (share buybacks), leaving interim-end cash of ¥33.31 billion (-¥20.63 billion YoY).
Four-row table with prior and current interim columns, YoY change and a narrow 'drivers' commentary column.
Capex, depreciation and goodwill amortisation FY2021-FY2026 plan (¥ million): capex 1,336 / 9,271 / 8,173 / 4,825 / 4,944 and a planned 11,500 for the current year; depreciation rises to a planned 6,740 and goodwill amortisation to 3,130. Capex excludes internal software labour costs.
Paired black bar chart by fiscal year, capex bar beside stacked depreciation/goodwill bar with circled-number labels.
Annual operating cash flow FY2020-FY2025 (44,790 to 52,531 ¥ million) with investing and financing outflows below the axis and an orange line for effective free cash flow (operating + investing - dividends), which fell from 30,068 to -9,199 in FY2025 amid the LYST acquisition; buyback outflows annotated (e.g. ¥10.0 billion in FY2025).
Bidirectional bar chart above and below a zero line with an overlaid orange line and dot markers; legend top-right.
ROE trend 62.5% (FY2021), 60.1%, 55.0%, 49.4%, 46.6% and an expected 50.0% for the current year; net margin on GMV 7.5% to 8.3% peak, now 7.3% expected. A POINT 02 executive note says the buyback is progressing (about ¥19.1 billion of ¥30 billion) and ROE is expected to exceed 50%.
Dual-axis line chart (orange ROE, black net margin) with labelled points; POINT 02 speech bubble and crayon portrait at right.
DPS rose from ¥19.3 (FY2021) to ¥21.6, ¥34.6, ¥35.6, ¥39.0 and a planned ¥40.0 for the current year; payout ratio steps up from about 50% to 70%+ (72.1% last year, 71.2% planned).
Black bar chart for DPS with an orange payout-ratio line on a secondary axis.
Annual GMV in ¥100 million: 5,088.7 (FY2021), 5,443.1, 5,743.7, 6,143.6, 6,660.3 and 3,094.3 for the first half of FY2026, with a dashed outline showing the full-year target; mix by consignment (75.8% in H1), purchased, USED, LINE Yahoo Commerce (12.4%), LYST (7.0%), BtoB and other. New shops added this year contributed ¥0.78 billion (0.3% of GMV).
Stacked black bar chart with thin white separators and circled-number percentage labels beside each bar; dashed target box for the current year.
Quarterly GMV FY2024 Q1 to FY2026 Q2 in ¥100 million, peaking at 1,904.9 in FY2025 Q3; FY2026 2Q was 1,526.8, +6.3% YoY excluding other GMV, with consignment 74.7%, LINE Yahoo Commerce 12.8% and LYST 7.6% of the mix.
Ten stacked quarterly bars with mix labels and a green speech-badge highlighting +6.3% YoY on the latest quarter.
Net sales in ¥ million: 166,199 (FY2021), 183,423, 197,016, 213,131, 228,373 and 110,642 for the first half; H1 breakdown consignment 64,580, purchased 1,467, USED 9,523, LINE Yahoo Commerce 11,932, LYST 2,980, BtoB 576, advertising 5,781, other 13,800.
Stacked bar chart by fiscal year with eight-item circled-number breakdowns; dashed outline for the current year.
Quarterly net sales FY2024 Q1 to FY2026 Q2; latest quarter ¥54.51 billion, +6.4% YoY, with consignment 31,354, LINE Yahoo Commerce 6,054, advertising 2,804 and LYST 1,592 (¥ million). Peak quarter was FY2025 Q3 at 66,556.
Ten stacked quarterly bars with segment value labels and a green YoY badge on the latest bar.
Adjusted EBITA rose from ¥50.06 billion (FY2021) to 56,881, 60,432, 65,398 and 72,697 (¥ million), with H1 FY2026 at 34,614; margin on GMV steady at 10.8%-11.4%, 11.2% in H1.
Black bars with orange margin line on a secondary axis; dashed outline for the in-progress year.
Quarterly adjusted EBITA FY2024 Q1 to FY2026 Q2 (¥ million) with seasonal Q3 peaks (24,543 in FY2025 Q3); latest quarter 15,867, +7.0% YoY, margin 10.4%.
Ten quarterly black bars with orange zig-zag margin line and green YoY badge.
H1 SG&A ¥69.93 billion, 22.6% of GMV (-0.4pt): personnel 17,003 (5.5%), of which staff 9,021 and logistics labour 7,981 (2.6%, -0.2pt); outsourcing 4,189; shipping 17,790 (5.8%, -0.5pt on delivery-partner terms and more small-parcel shipments); payment collection 6,411; advertising 7,951 (2.6%, +0.2pt); rent 4,342; depreciation 3,169; goodwill 1,576; other 7,366. Headcount 1,929 vs 1,915 a year earlier.
Detailed cost table with amount and ratio-to-GMV for both periods, YoY ratio change and a wide commentary column.
Quarterly SG&A from ¥31.06 billion (FY2024 Q1) to ¥35.34 billion (FY2026 Q2); SG&A ratio to GMV ranges 20.0%-24.7%, 23.2% in the latest quarter.
Ten black quarterly bars with an orange ratio line on the secondary axis.
Quarter-by-quarter SG&A line items for FY2025 Q1-Q4 and FY2026 Q1-Q2 with amounts and ratios; 2Q shows personnel 8,515 (5.6%), shipping 8,813 (5.8%), advertising 4,162 (2.7%), depreciation 1,648 (1.1%) and total SG&A 35,342 (23.2%).
Very wide 12-column table grouped by fiscal year and quarter, each with amount and ratio sub-columns.
Effective promotion cost (advertising + point costs) by quarter: 2Q ¥7.59 billion (advertising 4,162, points 3,430), 5.0% of GMV, broadly on plan. A POINT 03 note attributes the YoY rise to LYST advertising, High Link ads and more free-shipping and personalised-coupon campaigns, and says the full-year plan is 4.8% of GMV, the same as last year.
Stacked black/grey quarterly bars with an orange ratio line; POINT 03 speech bubble with crayon portrait at right.
Annual buyers (active members + guest buyers over the trailing 12 months) grew to 13,555,784 in FY2026 2Q, of which 12,841,096 active members and 714,688 guests. POINT 04: new member acquisition stayed solid with ZOZOWEEK in September, but quarter-on-quarter growth slowed versus last year's web-ad push and referral campaigns.
Ten stacked black/grey bars with exact counts; definitions at top; POINT 04 speech bubble with portrait at right.
ZOZOTOWN active members are 72% female and 28% male; regional split Kanto 40.5% (Tokyo 15.6%), Kinki/Tokai 27.8%, Kyushu/Okinawa 9.8%, Chugoku/Shikoku 7.2%, Hokuriku/Koshinetsu 5.6%, Tohoku 5.5%, Hokkaido 3.6%; average age 34.9 (men 33.1, women 35.6).
Three panels: gender pie, regional pie with callouts, and an age-distribution area chart with large average-age figure.
Annual spend per active member drifted from ¥42,947 (FY2024 Q1) to ¥40,951 (FY2026 Q2), roughly flat versus ¥40,900 last quarter; annual items purchased per member fell from 10.9 to 10.5.
Two line series (orange spend, black items) on dual axes across ten quarters with labelled points.
Shops on ZOZOTOWN rose from 1,605 (FY2024 Q1) to 1,726 at FY2026 2Q, comprising 1,709 consignment shops and 17 purchased/manufactured shops.
Ten stacked quarterly bars with consignment and purchase splits labelled.
ZOZOTOWN shipments per quarter: 14,291,323 in FY2026 2Q, +2.6% YoY, after 14,814,900 (+4.0%) in Q1; FY2025 Q3 peak 16,230,382.
Black quarterly bars with orange YoY growth line on secondary axis.
Average item price (ZOZOTOWN GMV / units shipped) was ¥3,640 in 2Q, +1.6% YoY. POINT 05: autumn/winter new-season list prices rose slightly while overall new-item pricing held flat; ZOZOWEEK lifted the sale mix slightly but a lower average discount rate raised the average price.
Quarterly bar chart with orange YoY line; POINT 05 speech bubble with portrait at right.
Average order value (ZOZOTOWN GMV / shipments) was ¥8,388 in 2Q, +2.5% YoY. POINT 06: more frequent free-shipping campaigns raised items per order, so order value grew faster than item price.
Quarterly bar chart with orange YoY line; POINT 06 speech bubble with portrait at right.
Opens the company plan section for the fiscal year ending March 2027.
Bold 'BUSINESS PLAN FOR FY2026' headline at left; crayon illustration of warehouse shelving racks at right.
ZOZO explains why it replaced EBITDA with adjusted EBITA: continuous investment in logistics sites and in-house software makes depreciation a real operating cost, so only M&A-related goodwill and intangible amortisation and acquisition costs are now adjusted out.
Text-only page with a single explanatory paragraph under the title.
Plan for the year to March 2027: GMV ¥679.6 billion (6,796億円, +2.0%), GMV ex-other ¥678.6 billion (+5.0%), net sales ¥241.9 billion (+5.9%), operating profit ¥74.4 billion (+7.3%; 11.0% margin), adjusted EBITA ¥77.9 billion (+7.2%; 11.5% margin), ordinary profit ¥74.4 billion, net profit ¥49.7 billion (+3.7%), EPS ¥56.20 and DPS ¥40. High Link has been consolidated since May 2026 and is booked under 'other'; the GMV ex-other metric will be dropped from the next fiscal year.
Bullet notes at top, then a two-column forecast table with plan values and YoY change.
GMV targets: ZOZOTOWN ¥538.4 billion (+4.2%; consignment 5,127億円, purchased 32億円, USED 225億円), LINE Yahoo Commerce ¥86.6 billion (+9.7%), LYST ¥46.5 billion (+10.1%), BtoB ¥7.1 billion (-15.3%), other ¥1.0 billion (-95.0%); advertising revenue target ¥11.9 billion (+0.1%).
Two tables: a segment GMV target table with indented sub-rows and a single-row advertising revenue table.
GMV in ¥100 million grows from 5,088 (FY2021) to 6,660 (FY2025) and a planned 6,796, with adjusted EBITA margin between 10.8% and 11.4%, rising to a planned 11.5%.
Black annual bars with orange margin line and labelled points.
Opens the reference-data appendix for the interim period.
Bold 'REFERENCE DATA' headline at left; crayon drawing of a conveyor-filled fulfilment centre with ZOZOTOWN boxes at right.
Key facts: 1,929 staff (average age 34.9), 20,083 shareholders, 11,599 brands on ZOZOTOWN and 13.55 million annual ZOZOTOWN buyers.
Four infographic tiles in a 2x2 grid, each with a coloured pill label and an oversized number.
ZOZOTOWN, one of Japan's largest fashion e-commerce sites: 1,726 shops, 11,599 brands, over 1.38 million items listed and 3,100+ new items daily, in-house systems, design and logistics, same-day delivery, gift wrapping and pay-later, plus a store on Yahoo! Shopping and ZOZOUSED on Yahoo! Auctions. WEAR by ZOZO is a coordinate app with AI 'suits you' diagnosis, WEARISTA influencers and over 21 million downloads.
Two stacked sections, each with heading, circle bullets on the left and a laptop + phone product mock-up on the right.
Comparison table: the main store has 1,726 shops, full lineup, ZOZOCARD 5% points, payment by card/COD/convenience store/pay-later/PayPay and bears collection, acquisition and point costs; the Yahoo! Shopping store has 1,610 shops, shop-selected items, PayPay points, same commission and ¥330 shipping fee, but pays a store fee and bears no acquisition or point costs.
Three-column comparison table with grey row labels, grouped revenue and cost rows separated by dotted lines.
Revenue recognition by business: purchased/manufactured (17 shops, sales = GMV), consignment (1,709 shops, sales = GMV x commission rate), USED (sales = GMV), LINE Yahoo Commerce, LYST (affiliate commission on GMV via Lyst), BtoB (28 brand e-commerce sites run for clients), advertising (ad revenue on ZOZOTOWN and WEAR) and other (incl. High Link and its 'Kalaria' fragrance platform).
Two-column text layout with bold business headings and short definitions plus sales formulas.
Gantt-style timeline of ZOZOBASE sites in Chiba and Ibaraki with floor area: Narashino 1 (91,500 m2), Tsukuba 1-A/1-B (65,000 each), Narashino 2 (72,000, lease ends March 2028), Tsukuba 2 (98,500), Tsukuba 3 (137,000), DPL Tsukuba Chuo (79,500, expanded from May 2026) and the new ZOZOBASE Narashino 3 (114,000 m2), leased from March 2027 and operating from August 2027.
Table of site attributes on the left with horizontal navy/orange arrow bars across a 2024-2028 timeline.
Points readers to ZOZO's corporate site: IR news, the Integrated Report Portal, ESG/CSR data and external ratings, plus IR email alert registration.
Underlined link headings with descriptions on the left and a laptop/phone mock-up of the corporate site on the right.
Standard notice that the material is for understanding the company, not an investment solicitation, and that forecasts are based on currently available information and subject to uncertainty.
Centered Japanese disclaimer text on a white page.
Full-page crayon artwork of a handwritten letter on a desk surrounded by crayons and a ZOZOTOWN box, a signed note to customers about the people and technology behind ZOZOBASE logistics.
Full-bleed illustration with a centered paper letter.
Final page with the ZOZO logo.
Centered logo on white.
Распространенные вопросы об этом слайде и основном содержании презентации.
It is ZOZO, Inc.'s 48-page results briefing for the first half (April-September 2026) of the fiscal year ending March 2027. It covers highlights, the consolidated P&L, balance sheet and cash flow, GMV and sales by business, SG&A detail, ZOZOTOWN KPIs, the full-year plan and reference data on services, business model and logistics sites.
Yes. The original is a Japanese-language deck titled 2027年3月期 第2四半期(中間期)決算説明会資料 (with an English cover line), published on TDnet, the Tokyo Stock Exchange's timely disclosure system, under ZOZO's securities code 3092. The page-by-page notes here are English translations of slide titles and key figures.
ZOZO's fiscal year runs from April to March. The year ending March 2027 (2027年3月期) mostly falls in 2026, and ZOZO's own cover labels it '2Q FY2026', so this page uses H1 FY2026 for the April-September 2026 half.
GMV excluding other GMV was ¥309.29 billion (+5.7%), net sales ¥110.64 billion (+5.1%), operating profit ¥32.83 billion (+5.6%), adjusted EBITA ¥34.61 billion (+5.1%) with an 11.2% margin, and profit attributable to owners ¥21.75 billion (+3.5%). All are in line with about 44-46% of the full-year plan.
The plan for the year to March 2027 is GMV of ¥679.6 billion (+2.0%), net sales ¥241.9 billion, operating profit ¥74.4 billion, adjusted EBITA ¥77.9 billion (11.5% margin), net profit ¥49.7 billion and a dividend of ¥40 per share. The medium-term plan targets ¥90 billion adjusted EBITA by March 2030.
Adjusted EBITA is operating profit plus amortisation of goodwill and acquired intangibles plus M&A-related costs. ZOZO replaced EBITDA because depreciation from its logistics centres and in-house software is treated as a real recurring cost.
Yes. The deck is available as the original PDF and as an editable PPTX converted from it, so you can reuse its chart layouts, KPI pages and executive call-out design for your own earnings or business review presentation.
The highlights pages (3-6), the EBITA bridge waterfall (10), the stacked GMV and sales charts (17-20), the KPI charts with executive POINT speech bubbles (26-33) and the logistics Gantt timeline (44) are strong templates for financial storytelling.
Original Japanese-language disclosure filed by ZOZO, Inc. (3092)

Create Your Own Slides
Turn your ideas into professional presentations in seconds with 2slides AI.
Используйте профессиональные дизайны, выберите свой стиль и генерируйте слайды с идеальной отрисовкой текста. На базе Nano Banana—начните создавать свою презентацию прямо сейчас.
Ваш AI-агент для слайдов. Экономьте время, сияйте быстрее с интеллектуальным созданием презентаций.


© 2026 2slides. Все права защищены.