
Входит в коллекцию Примеры презентаций для инвесторов
U.S. Bancorp (NYSE: USB) investor presentation from the BancAnalysts Association of Boston Conference 2026, dated November 6, 2026 and filed with the SEC as Exhibit 99.1 to a Form 8-K. Presented by John Stern (Vice Chair and CFO) and Stephen Philipson (Vice Chair, Wealth, Corporate, Commercial, and Institutional Banking), the 20-slide deck reviews U.S. Bancorp's franchise and medium-term financial targets, then focuses on Global Capital Markets: the BTIG acquisition, market-share gains, cross-referral synergies between the bank and BTIG, and a path to lift Capital Markets fee revenue from 8% to 10%+ of total net revenue in 3 to 5 years. All amounts are in US dollars. The slides were rasterized as images in the SEC filing; some appendix footnotes are not legible at this resolution.
Использует обложку этой презентации как образец стиля для слайдов с вашим содержанием. Или выберите любую страницу ниже, чтобы взять за образец её макет.
Быстрая навигация
Теги
Поделиться слайдами
U.S. Bancorp (NYSE: USB) investor presentation from the BancAnalysts Association of Boston Conference 2026, dated November 6, 2026 and filed with the SEC as Exhibit 99.1 to a Form 8-K. Presented by John Stern (Vice Chair and CFO) and Stephen Philipson (Vice Chair, Wealth, Corporate, Commercial, and Institutional Banking), the 20-slide deck reviews U.S. Bancorp's franchise and medium-term financial targets, then focuses on Global Capital Markets: the BTIG acquisition, market-share gains, cross-referral synergies between the bank and BTIG, and a path to lift Capital Markets fee revenue from 8% to 10%+ of total net revenue in 3 to 5 years. All amounts are in US dollars. The slides were rasterized as images in the SEC filing; some appendix footnotes are not legible at this resolution.
Подробный просмотр каждой страницы слайда, включая макет, ключевой контент и визуальные элементы.
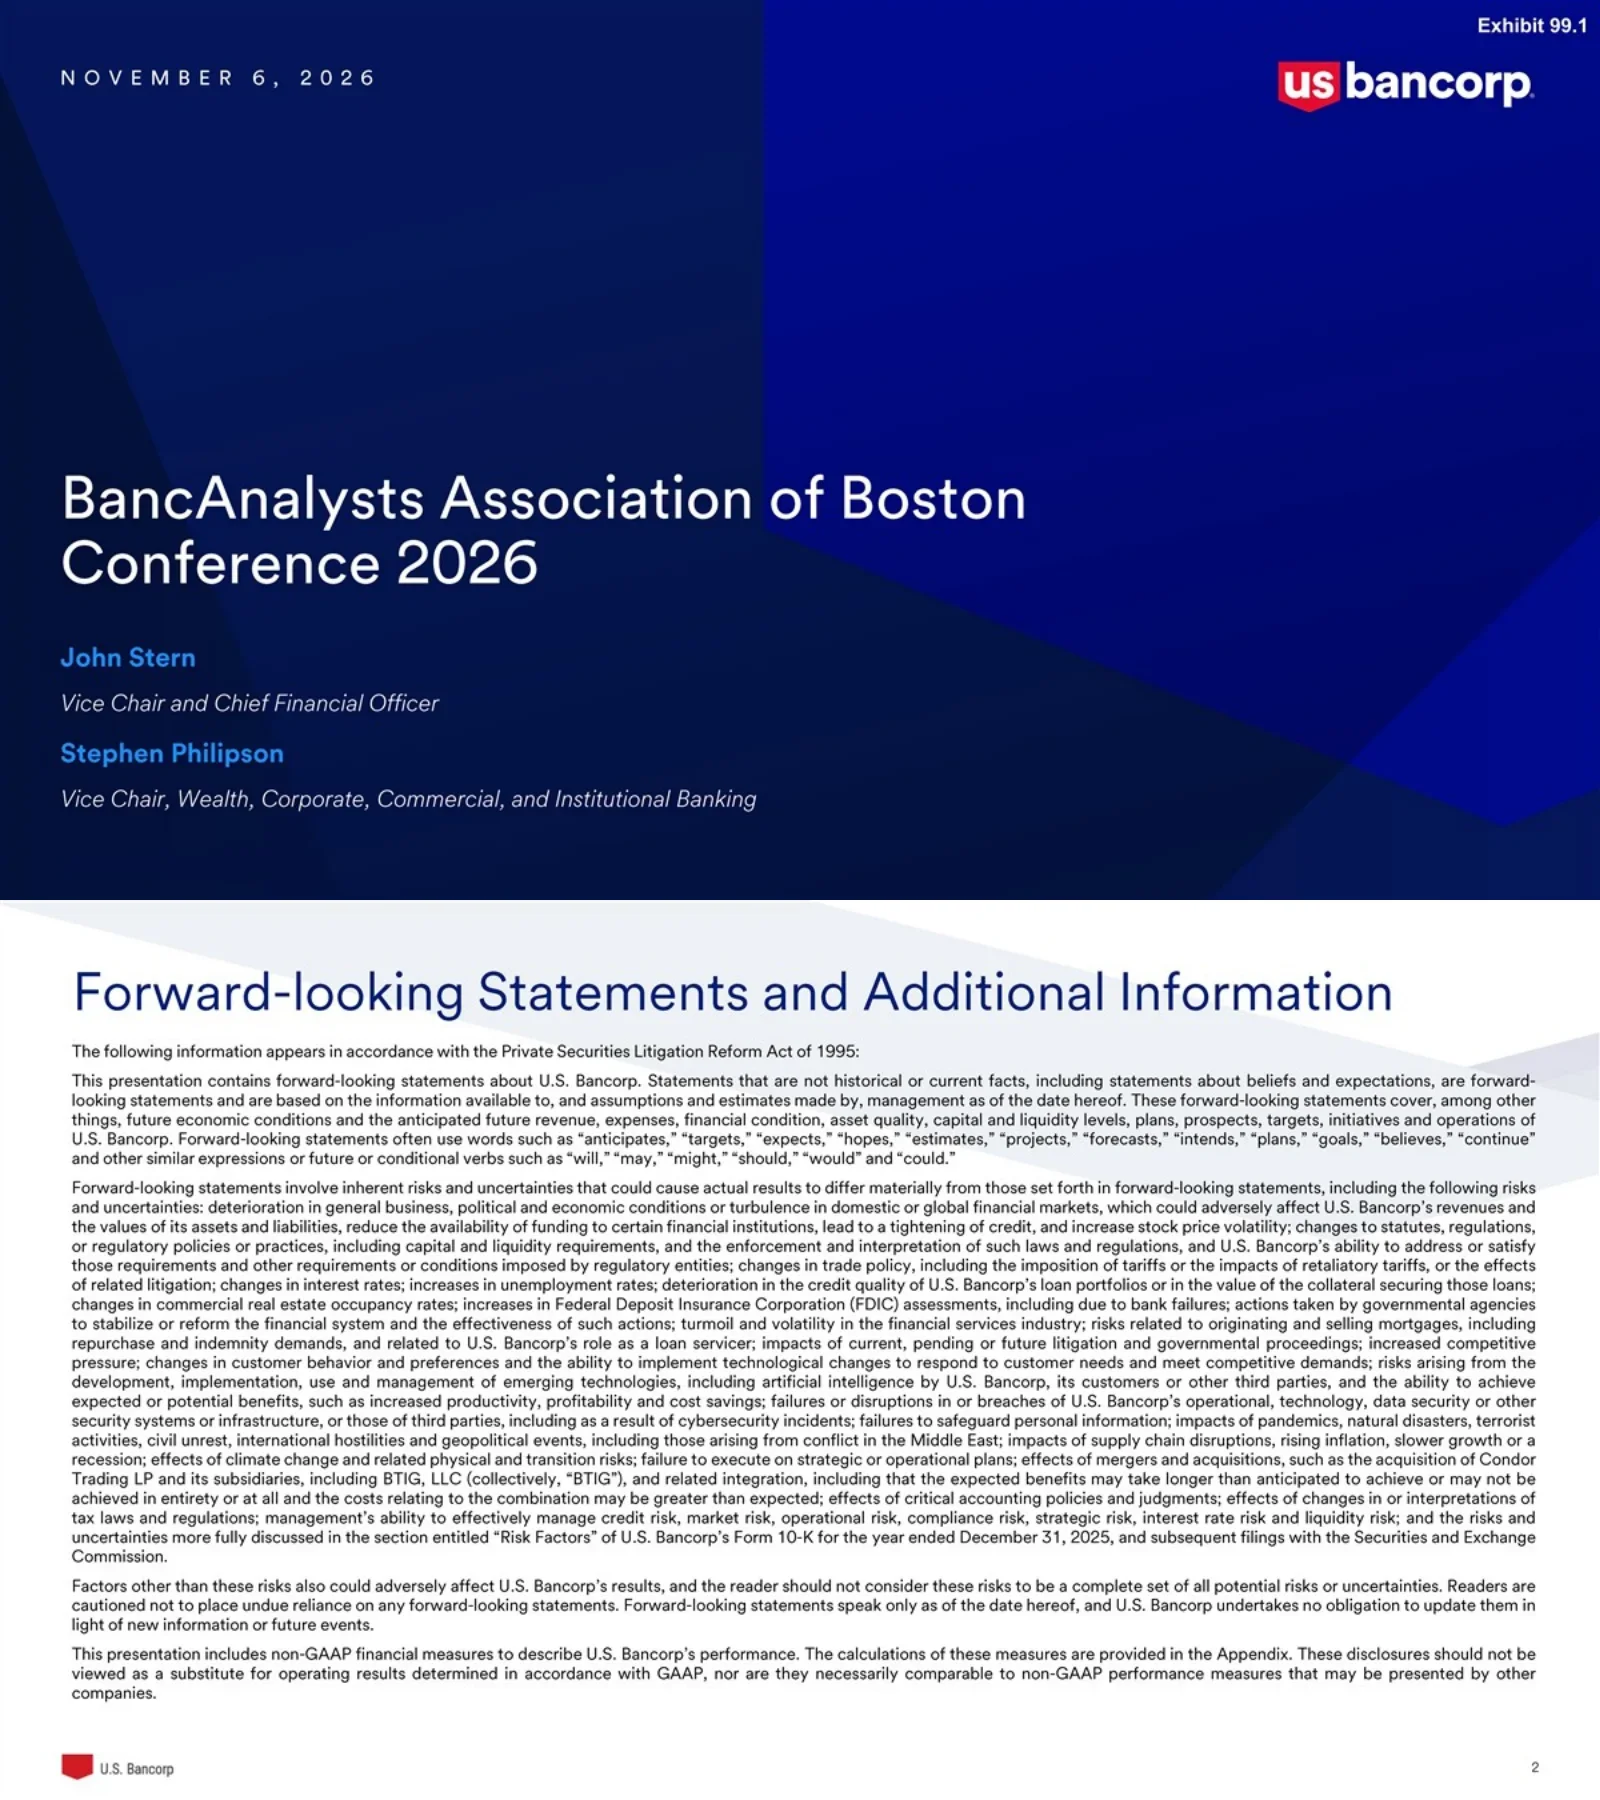
Title slide dated November 6, 2026, marked Exhibit 99.1. Presenters are John Stern, Vice Chair and Chief Financial Officer, and Stephen Philipson, Vice Chair, Wealth, Corporate, Commercial, and Institutional Banking.
Full-bleed dark blue gradient background with angular geometric shapes; date in spaced capitals at top left, U.S. Bancorp logo top right, large conference title and presenter names in the lower left.
Safe-harbor disclaimer under the Private Securities Litigation Reform Act of 1995. Lists risks including economic and market conditions, regulation and capital requirements, trade policy and tariffs, interest rates, credit quality, commercial real estate occupancy, FDIC assessments, AI adoption, cybersecurity, geopolitical events including conflict in the Middle East, and the acquisition of Condor Trading LP and its subsidiaries including BTIG, LLC. Refers to Risk Factors in the Form 10-K for the year ended December 31, 2025 and notes that non-GAAP measures are reconciled in the Appendix.
Text-only legal page with a title and dense justified paragraphs across the full slide width.
Fee income represents ~44% of total net revenue (3Q 2026, taxable-equivalent basis). Revenue mix by business line (non-GAAP, excluding Treasury and Corporate Support): Wealth, Corporate, Commercial & Institutional Banking 48%, Consumer & Business Banking 29%, Payment Services 23%. Average balance sheet: $697B assets, $631B earning assets, $527B deposits, $410B loans. Clients: ~14M consumers, ~1.4M businesses, ~495K wealth clients, ~47K corporate and institutional. Key statistics: $977B total purchase volume (trailing 12 months), $573B assets under management, ~$13T assets under custody and administration, and #110 in the Fortune Global 500 by revenue (2026). A U.S. map plots branch network and client centers (European locations not shown).
Four-quadrant dashboard: pie chart with headline fee stat (top left), balance-sheet and client KPI columns (top right), dark navy key-statistics panel (bottom left), and U.S. footprint dot map (bottom right); footnotes along the bottom.
Three strategic priorities: Organic Growth (deepening relationships, interconnected product set, broader reach), Expense Management (positive operating leverage to fund growth), and Payments Transformation (embedded money movement). Table comparing 3Q 2025 / 2Q 2026 / 3Q 2026 / medium-term target: return on average assets 1.17% / 1.26% / 1.25% vs 1.15% to 1.35%; return on tangible common equity 18.6% / 18.7% / 18.5% vs high teens; fee revenue growth YoY 9.5% / 13.2% / 14.9% vs mid-single digits; efficiency ratio 57.2% / 57.1% / 55.9% vs mid-to-high 50s; operating leverage 530 bps / 400 bps / 240 bps vs committed to positive operating leverage; CET1 (Cat III) 10.8% in 3Q 2026 and CET1 with AOCI 9.1%, against a ~10% Category II pro forma target. Medium-term means 2026 and 2027.
Left panel with three numbered priorities; right side is a metrics table with quarter columns and a highlighted target column; full-width navy banner at bottom reading 'Strong foundation built on financial and risk management discipline'.
Of $8B total 3Q 2026 net revenue, 44% is fee revenue. Fee mix: Capital Markets (FICC, BTIG, Impact Finance) 18%, flagged as 'Today's focus'; Payments (credit cards, merchant payment services, corporate payments, treasury management) 38%; Trust and Investments (global corporate trust, wealth management, global fund services, institutional trust and custody, asset management) 26%; Consumer and Other (consumer and business banking) 18%.
Donut chart on the left splitting fee revenue and net interest income, connected by an arrow to a breakdown table on the right with the Capital Markets row highlighted in navy with a green 'Today's focus' tag.
Global Capital Markets revenue ($ billions, fee only): $0.5 (2018), $0.6 (2019), $0.8 (2020), $0.7 (2021), $0.8 (2022), $1.0 (2023), $1.1 (2024), $1.3 (2025), a 13% seven-year CAGR, rising to $2.5 annualized 3Q 2026 ($1.6 FICC and other plus $0.9 BTIG). Total Capital Markets fee revenue was $640 million in 3Q 2026. A timeline lists capability additions: investment-grade and high-yield bonds, derivatives and a BTIG referral program (pre-2017); FX re-platforming and asset-backed lending; CLOs and subscription finance; commodities, expanded FX, Union Bank growth, ABS, structured credit, defeasance, market funding; brokered CDs; and most recently the BTIG acquisition, physical precious metals, muni prepaids and macro.
Stacked bar chart across the top with a CAGR bracket, a full-width navy double-headed arrow timeline below, and bulleted capability lists hanging from timeline markers.
Three market-share comparisons: Investment Grade Loan Bookrunner, U.S. Bancorp share rose from 0.9% (#13, 2009) to 3.7% (#7, 2025), per Loan Pricing Corporation; Investment Grade Domestic Bonds rose from 0.1% (#24, 2009) to 2.5% (#14, 2025), per Bloomberg; Equity Capital Markets, BTIG share rose from 0.1% (#41, 2015) to 1.8% (#15, YTD 2026 through September 30), per Bloomberg bookrunner data.
Three equal panels side by side, each with a light-blue header, a two-bar before/after chart and an upward arrow showing league-table rank improvement.
Capital Markets fee revenue as a share of U.S. Bancorp total net revenue: 4% in 3Q23 and 8% in 3Q26 (FICC and other capital markets, BTIG Markets, BTIG Investment Banking). Expected strategic growth bridges add +70-80 bps from core growth, +30-40 bps from deepening the shared client base and +90-100 bps from additional capabilities, reaching 10%+ in 3 to 5 years. Strategy pillars: Core Growth (FICC and BTIG growing at a high single digit annual pace); Deepening Shared Client Base (BTIG to USB clients, USB to BTIG clients, BTIG beyond capital markets such as investor services and wealth); Additional Capabilities (IB verticals, equity swaps, institutional rates and FX, cash macro, structured products, commodities).
Waterfall-style bridge chart at top with stacked starting bars, teal increment markers and a bright blue target bar; legend underneath; three-column 'Our Strategy' band at the bottom.
U.S. Bancorp to BTIG: ~47K corporate and institutional U.S. Bancorp clients offer referral opportunities in outsourced trading, ETF execution, equity capital markets, capital introductions, derivatives, M&A advisory, corporate access and share buybacks; 220+ referrals sent to BTIG. BTIG to U.S. Bancorp: ~4K+ BTIG clients for U.S. Bancorp FICC expansion in debt capital markets, interest rate derivatives, commodities, foreign exchange, syndications and structured credit; 130+ referrals sent to U.S. Bancorp. Referrals counted from June 1, 2026 through September 30, 2026.
Two mirrored halves divided by a dashed vertical line, each with logo-to-logo arrow header, big client count, two-column product list and an outlined referral-count box at the bottom.
BTIG referral opportunities (equity sales/trading, ETF execution, outsourced trading, capital introductions, M&A, derivatives, prime brokerage) are linked by a two-way arrow to U.S. Bancorp complementary products: Investment Services (corporate trust, custody, escrow, fund administration, asset management) and Wealth (private banking, family office).
Left box with BTIG logo and a grid of product tiles; large navy double-headed arrow in the center; right box with U.S. Bancorp logo and tiered product tiles in light blue (Investment Services) and navy (Wealth).
A technology, media and telecom client that was BTIG-only (investment banking) generated ~$4 million in annual revenue (twelve months ended December 31, 2025). With U.S. Bancorp the relationship is expected to generate ~4-5X annual revenue: Banking (new joint lead arranger credit commitment), FICC (lead left arranger on acquisition financing in 2026, derivatives and FX in the near future, working capital engagement) and Deposits (~$50 million of new deposits and treasury management services).
Left 'How it started' panel with a rounded badge for the BTIG-only client; right 'Where the relationship is going' panel with three colored category tiles paired with outlined description boxes.
A tech company client whose pre-acquisition U.S. Bancorp relationship (FICC to debt capital markets, corporate trust to trustee, banking to multiple credit facilities) produced ~$9 million in annual revenue (last twelve months as of June 30, 2026). Adding BTIG equity capital markets and additional debt capital markets positions it for up-tiering, and the combined relationship is expected to generate ~2-3X in annual revenue.
Two-column before/after layout separated by a large blue chevron; navy header bars, white description boxes and solid navy and bright blue result blocks.
A private capital manager using U.S. Bancorp (committed credit, custody, escrow, deposits) plus BTIG (equity trading, equity capital markets) is a shared relationship worth ~$4 million combined annual revenue (twelve months ended December 31, 2025). Going forward it is expected to generate ~1-2x revenue in the first 6 months post close through Banking (several new joint lead arranger credit commitments across portfolio companies and new leveraged buyout transactions), FICC (joint lead arranger and passive joint bookrunner roles on acquisition and best-effort refinancing transactions in 2026 and 2027), Deposits (new deposits and payments opportunities at portfolio companies) and Corporate Trust (new custody and escrow opportunities across credit funds and portfolio companies).
Top row of two product boxes joined by a plus sign, an arrow and a navy result card; below, a bright blue banner with the expected multiple and four equal outlined columns describing each opportunity.
Macro sales and trading launched June 2026: market share of 1% in 2025 (as of 12/31/2025, estimated through a third-party aggregator) with a near-term target of 2%. Further developments underway: structured credit, investment banking vertical expansion, fixed income market funding, equity swap dealing, repo expansion, liquid cash products, commodities, mortgage capital markets, institutional FX, institutional rates and global distribution. The footnote says the market share target is forward-looking and product expansion reflects planned capabilities.
Left half with a two-bar chart (navy 2025, green target); right half with a two-column cluster of colored oval capability pills.
Three takeaways: a successful track record of growing share in markets businesses; the addition of BTIG and continued execution of the FICC roadmap provide scale and runway for meaningful growth; and an opportunity to double share of wallet in markets businesses by deepening relationships, expanding capabilities and leveraging the interconnected WCIB platform.
Title and italic subtitle on a white header, followed by a full-width navy band with three large white bullet points.
Section divider introducing the appendix.
Full-bleed two-tone navy background with an angled chevron split, a small red chevron accent and the word 'Appendix' in light blue.
Medium-term targets: return on average assets 1.15% to 1.35%; return on tangible common equity high teens; fee income growth (YoY) mid-single digits; efficiency ratio mid-to-high 50s. Key assumptions (as of September 12, 2024, presented at Investor Day): modest GDP growth, stable unemployment rate, moderating inflation, current tax policy, Fed Funds rate path consistent with market implied, upward sloping yield curve driven by rate cuts and stable credit quality. The footnote defining medium-term appears truncated on the slide ('2026 and 202.'); page 4 defines it as 2026 and 2027.
Left column of navy arrow-shaped labels paired with blue target values; a large bracket points to a right column of alternating shaded assumption rows.
Net revenue for the three months ended September 30, 2026 ($ in millions): Wealth, Corporate, Commercial and Institutional Banking $3,997; Consumer and Business Banking $2,404; Payment Services $1,868; Treasury and Corporate Support $(299); total company $7,970, or $8,269 excluding Treasury and Corporate Support. Share of total company: 50% / 30% / 23% / (3)%. Excluding Treasury and Corporate Support: 48% / 29% / 23%.
Single centered financial reconciliation table with three sections separated by bold subheaders and rule lines.
For 3Q 2026 / 2Q 2026 / 3Q 2025 ($ millions, unaudited): net income applicable to common shareholders $2,095 / $2,098 / $1,893; excluding intangibles amortization $2,195 / $2,188 / $1,992; average tangible common equity $47,062 / $46,852 / $42,567; return on average common equity 13.6% / 14.0% / 13.5%; return on tangible common equity 18.5% / 18.7% / 18.6%. Capital: CET1 capital $55,023 / $53,575 / $50,587; AOCI-related adjustments $(8,853) / $(6,790) / $(7,638); CET1 including AOCI $46,170 / $46,785 / $42,949; risk-weighted assets $508,174 / $496,488 / $465,092; CET1 ratio 10.8% / 10.8% / 10.9%; CET1 ratio including AOCI 9.1 / 9.4 / 9.2. Footnotes refer to a 'last page in appendix' that is not included in the filed deck.
Two stacked financial tables: a wide three-period return reconciliation on top and a narrower capital-ratio table below.
Three-month comparisons ($ millions, unaudited) for 3Q 2026 vs 3Q 2025, 2Q 2026 vs 2Q 2025 and 3Q 2025 vs 3Q 2024. Net interest income $4,468 / $4,222 / $4,361 / $4,051 / $4,222 / $4,135; taxable-equivalent NII $4,490 / $4,251 / $4,387 / $4,080 / $4,251 / $4,166; noninterest income $3,480 / $3,078 / $3,325 / $2,924 / $3,078 / $2,698; total net revenue $7,970 / $7,329 / $7,712 / $7,004 / $7,329 / $6,864; revenue excluding securities gains (losses) $8,035 / $7,336 / $7,761 / $7,061 / $7,336 / $6,983 (growth 9.5%, 9.9%, 5.1%). Noninterest expense $4,493 / $4,197 / $4,428 / $4,181 / $4,197 / $4,204; BTIG noninterest expense $213 in 3Q 2026 and $84 in 2Q 2026; expense excluding notable items $4,280 / $4,344. Operating leverage 2.4%, 4.0% and 5.3%; efficiency ratio 55.9%, 57.1% and 57.2%.
Wide six-column financial table grouped into three year-over-year period pairs with vertical dividers.
Распространенные вопросы об этом слайде и основном содержании презентации.
It is the 20-slide deck U.S. Bancorp presented at the BancAnalysts Association of Boston Conference on November 6, 2026. It was filed with the SEC as Exhibit 99.1 to a Form 8-K and covers the bank's franchise, medium-term financial targets and a deep dive on its Global Capital Markets business and the BTIG acquisition.
John Stern, Vice Chair and Chief Financial Officer, and Stephen Philipson, Vice Chair, Wealth, Corporate, Commercial, and Institutional Banking.
Return on average assets 1.25%, return on tangible common equity 18.5% (non-GAAP), fee revenue growth of 14.9% year over year, efficiency ratio 55.9%, operating leverage of 240 bps, CET1 ratio 10.8% and CET1 including AOCI 9.1%. Total net revenue was $7,970 million.
Global Capital Markets fee revenue was $640 million in 3Q 2026, or $2.5 billion annualized ($1.6 billion FICC and other plus $0.9 billion BTIG), up from $1.3 billion in 2025. Capital Markets is 18% of fee revenue and about 8% of total net revenue, and the company targets 10%+ within 3 to 5 years.
From June 1 to September 30, 2026 there were 220+ referrals from U.S. Bancorp to BTIG and 130+ from BTIG to U.S. Bancorp. Three client examples are expected to grow relationship revenue by ~4-5X, ~2-3X and ~1-2X respectively.
For 2026 and 2027: return on average assets of 1.15% to 1.35%, return on tangible common equity in the high teens, mid-single-digit fee income growth, an efficiency ratio in the mid-to-high 50s, positive operating leverage and a CET1 ratio of about 10% on a Category II pro forma basis.
The deck was filed with the SEC on EDGAR as an exhibit to Form 8-K, and the slides are rasterized images from that filing. The page-by-page analysis uses only figures legible on the slides. Some footnotes refer to an appendix notes page that is not included in the filed deck.
Yes. The gallery page provides the PDF and an editable PPTX converted from it. Its dashboard, waterfall bridge and before-and-after case-study layouts are useful references for building bank or financial-services investor presentations.
Original presentation filed by U.S. Bancorp with the SEC as an exhibit to Form 8-K, November 2026.

Create Your Own Slides
Turn your ideas into professional presentations in seconds with 2slides AI.
Используйте профессиональные дизайны, выберите свой стиль и генерируйте слайды с идеальной отрисовкой текста. На базе Nano Banana—начните создавать свою презентацию прямо сейчас.
Ваш AI-агент для слайдов. Экономьте время, сияйте быстрее с интеллектуальным созданием презентаций.


© 2026 2slides. Все права защищены.