
Snowflake's Q2 fiscal 2027 investor presentation — a 37-slide deck that opens with the 'era of the agentic enterprise' product story (AI Data Cloud, Agentic Control Plane, partner and customer logo walls), then turns to the financials: product revenue of $1.49 billion up 37% year over year, a 126% net revenue retention rate, 14,554 total customers and 828 customers over $1 million of trailing product revenue, remaining performance obligations of $9.0 billion, a $225 billion TAM expected to roughly double to $460 billion by FY31, full-year FY27 guidance of $6.07 billion product revenue at a 14.5% non-GAAP operating margin, and a twelve-page appendix of GAAP-to-non-GAAP reconciliations.
Быстрая навигация
Теги
Поделиться слайдами
Snowflake's Q2 fiscal 2027 investor presentation — a 37-slide deck that opens with the 'era of the agentic enterprise' product story (AI Data Cloud, Agentic Control Plane, partner and customer logo walls), then turns to the financials: product revenue of $1.49 billion up 37% year over year, a 126% net revenue retention rate, 14,554 total customers and 828 customers over $1 million of trailing product revenue, remaining performance obligations of $9.0 billion, a $225 billion TAM expected to roughly double to $460 billion by FY31, full-year FY27 guidance of $6.07 billion product revenue at a 14.5% non-GAAP operating margin, and a twelve-page appendix of GAAP-to-non-GAAP reconciliations.
Подробный просмотр каждой страницы слайда, включая макет, ключевой контент и визуальные элементы.
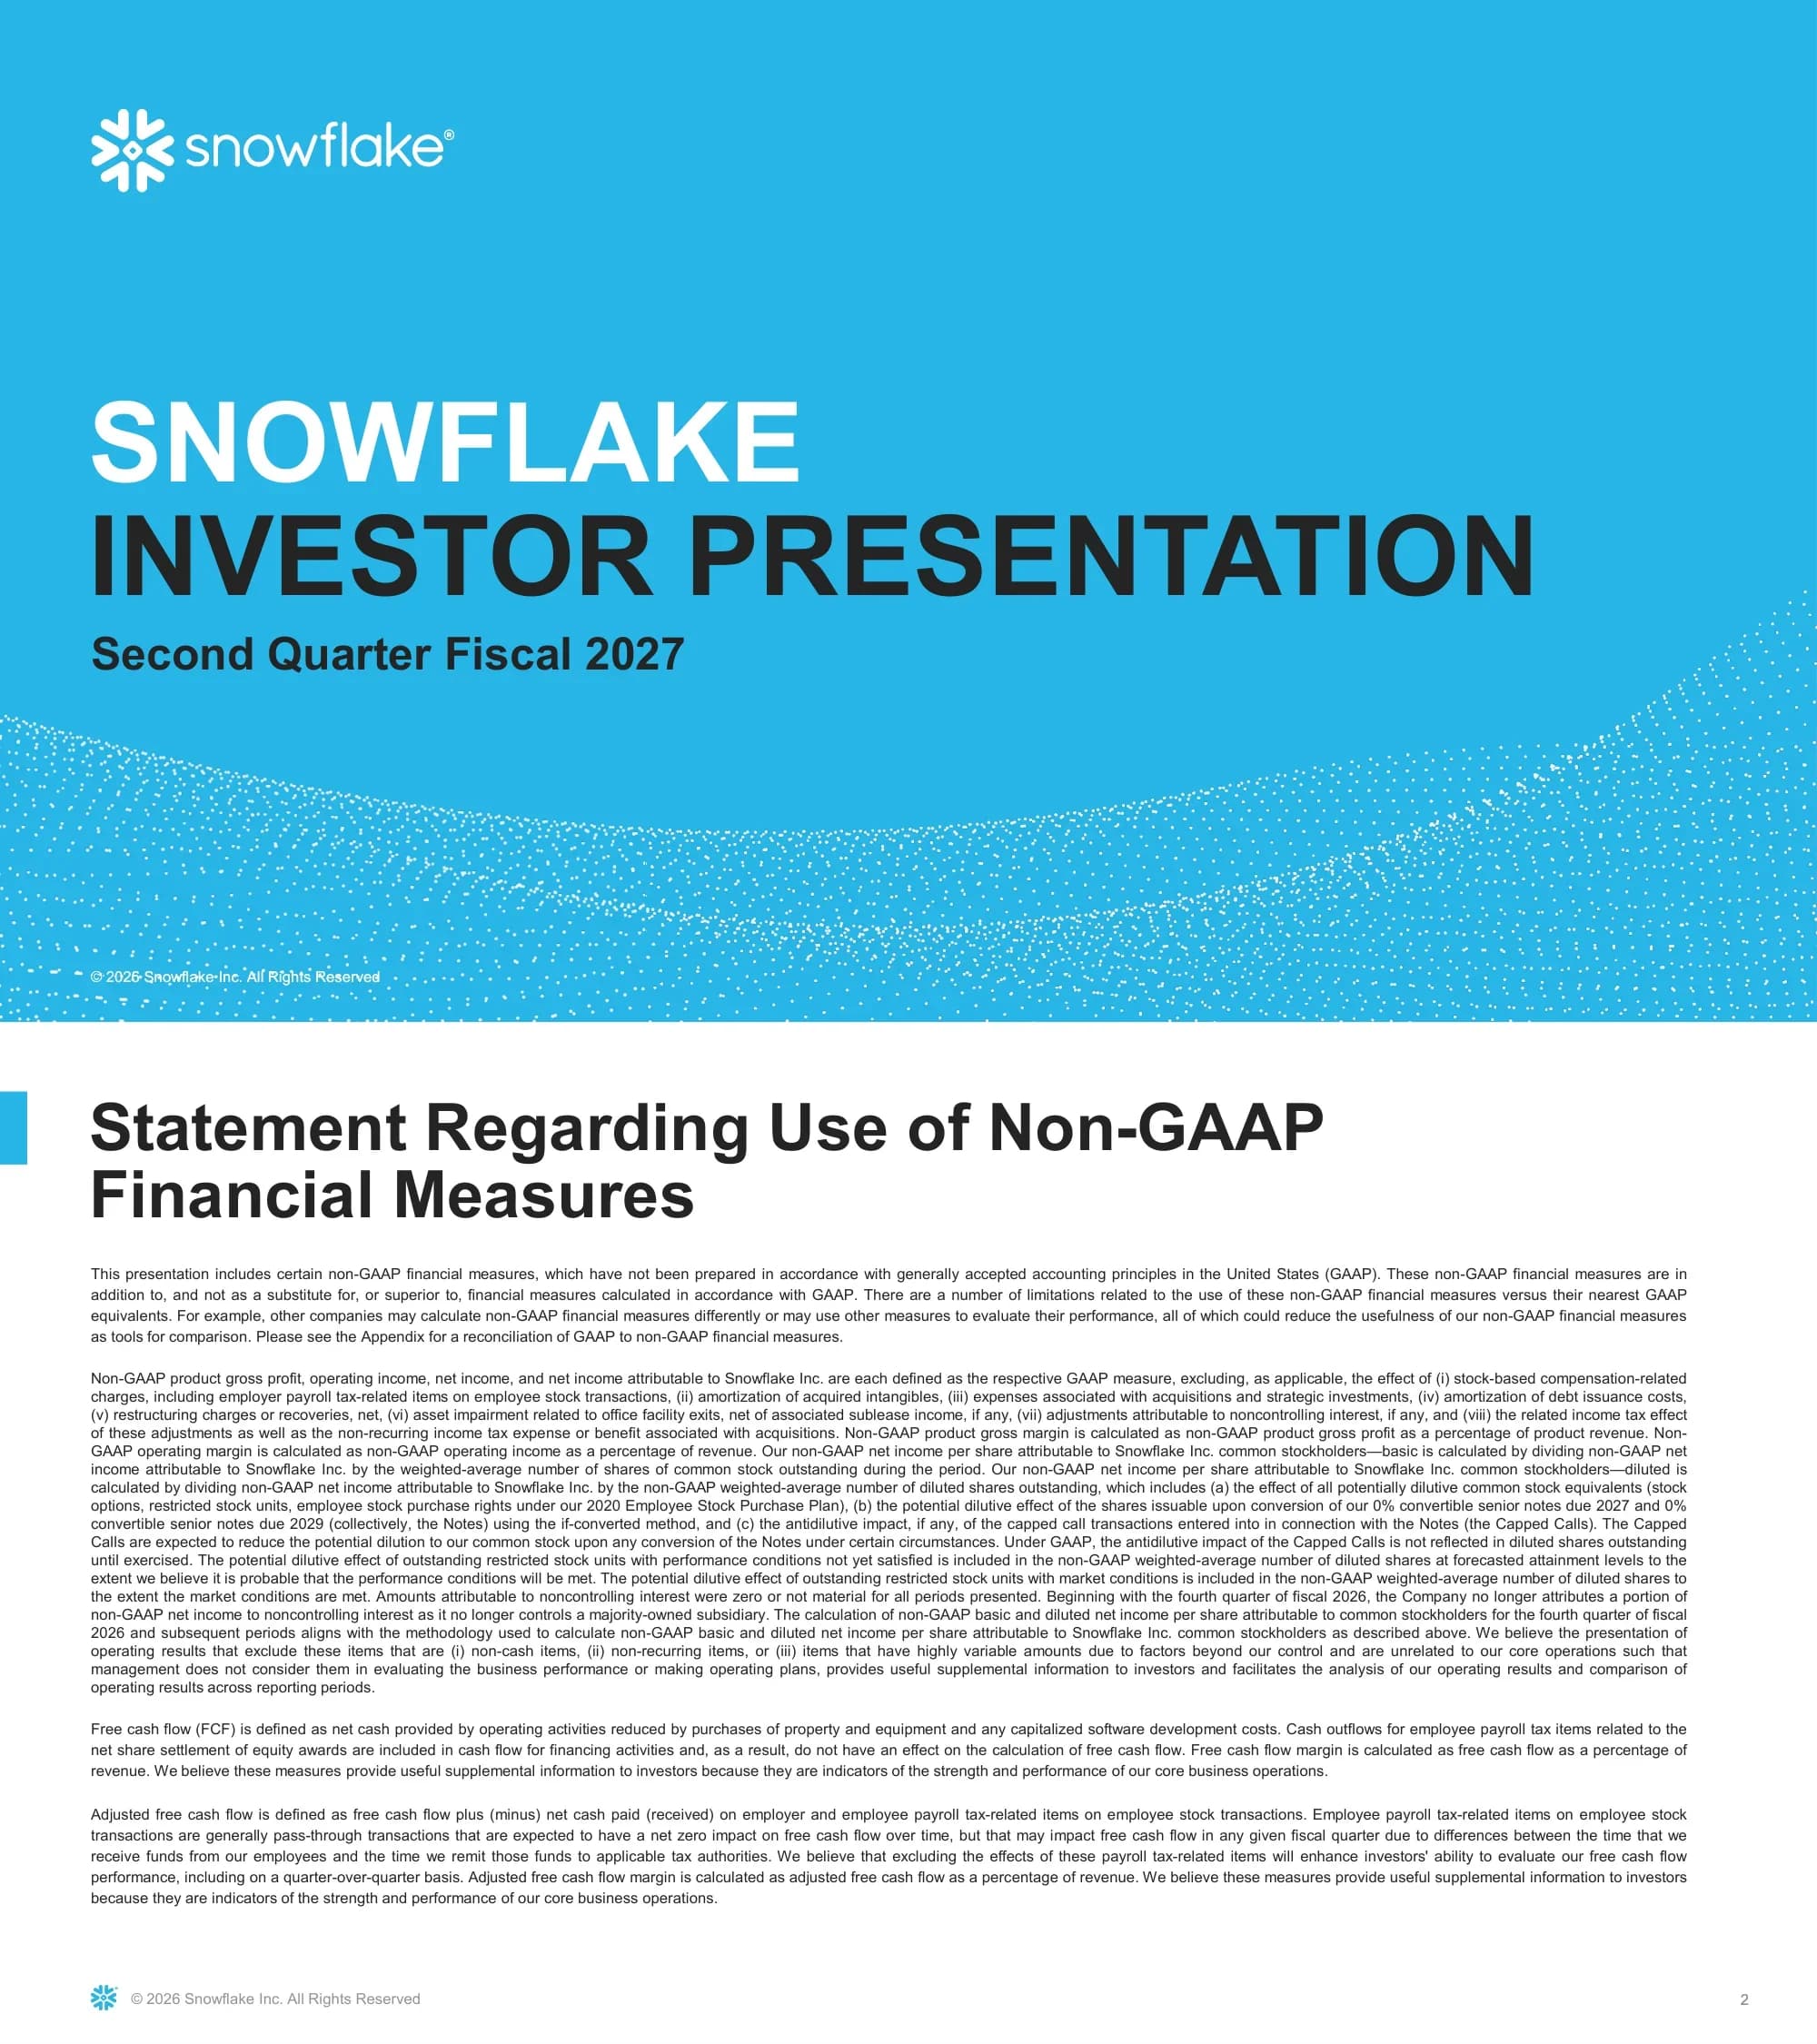
Cover slide for Snowflake's investor presentation covering the second quarter of fiscal 2027.
Full-bleed brand-blue field with the white snowflake mark and wordmark at the top left; 'SNOWFLAKE' in white and 'INVESTOR PRESENTATION' in black set in heavy condensed capitals at left-centre; the period in smaller bold type beneath; a dotted particle wave rising across the bottom third.
Definitions and caveats for every non-GAAP measure used in the deck: non-GAAP product gross profit, operating income, net income and net income attributable to Snowflake Inc.; the eight categories of excluded items; the treatment of the 0% convertible senior notes due 2027 and 2029 and the related capped calls in diluted share counts; and definitions of free cash flow, free cash flow margin, adjusted free cash flow and adjusted free cash flow margin.
Bold two-line heading with a small blue rule at the left margin; four dense justified paragraphs of small body text filling the slide; Snowflake mark and copyright line in the footer.
Forward-looking statements disclosure covering operating results and targets, business strategy, new product releases including Snowflake Cortex AI, Snowpark, Snowflake Marketplace and the AI Data Cloud, market and competitive considerations, and the risk factors that could cause outcomes to differ — from macro conditions and tariffs to customer consumption optimisation and stock-based compensation as a percentage of revenue.
Two columns of justified small text under the same bold heading treatment, running the full height of the slide, ending with the trademark notice.
Section divider introducing the product narrative.
Brand-blue field with concentric solid and dotted arcs radiating from the centre; the title set across the middle in heavy condensed capitals, 'THE ERA OF' in black above 'THE AGENTIC ENTERPRISE' in white.
The problem statement: a sprawling node graph of CRM, ERP, Kafka, data lake, warehouse, staging DB, legacy data marts, vector DB, dashboards, APIs and LLM inference, littered with red crosses and orange warning triangles labelled security control, failure modes, identity models, security reviews, multiple shadow data lakes, stale cache, old temp tables, personal data copies and disconnected LLM fine-tuning sets.
Title in heavy black capitals at the left, with 'LIMITS AI' picked out in brand blue; the right three-quarters given over to a purple-and-blue network diagram that bleeds off all three edges, deliberately overwhelming.
Four claims: full enterprise data and context, governed and ready for AI; choice of any AI model or cloud infrastructure; integration with all major systems of record; and an Agentic Control Plane for everyone.
White slide, bold black title with the blue accent rule; four evenly spaced columns, each a line-art blue icon above three or four lines of grey bold text. Nothing else.
Three pillars — AI Model Choice, Enterprise Data and Context, and Software and Apps — arranged around the AI Data Cloud, with the Agentic Control Plane at the centre.
Brand-blue field; title stacked at the upper left; a glowing particle-sphere render of the AI Data Cloud at the right, divided into three sectors, with white circular labels at the three vertices and a white centre circle for the Agentic Control Plane, all inside a dashed orbit.
The platform view: five workload cards — Data Engineering, Analytics, Transactions, AI, and Applications & Collaboration — sitting on a band that reads Fully Managed | Cross-Cloud | Interoperable | Secure | Governed.
White ground with the glowing particle sphere centred behind a blue panel; the sphere carries the snowflake mark and the 'AI DATA CLOUD' label; five white cards with blue icons sit in a row across the panel, and a dark navy strip beneath holds the five platform attributes separated by pipes.
Three positioning statements: eliminate complexity to deploy enterprise agents at scale; connect all data, apps and models without data movement; de-risk enterprise AI with built-in governance and cost controls.
White slide with no title bar. Three columns, each a blue line icon above a dark blue one-word heading and two or three lines of centred black text. The top arc of the glowing particle sphere rises into the bottom third of the slide.
Logo wall of roughly 130 technology and services partners, including Accenture, AWS, Anthropic, Capgemini, Deloitte, EY, Fivetran and dbt Labs, Google Cloud, IBM, Informatica, Infosys, KPMG, Meta, Microsoft, OpenAI, Salesforce, SAP, ServiceNow, Tableau, TCS, Workday and Wipro.
Full-bleed grid of logos filling the top and bottom halves, with the title set in large blue type on a white band across the middle between two blue rules.
Customer logo wall including DoorDash, P&G, Ticketmaster, Wayfair, Philips, Ecolab, Alaska Airlines, T-Mobile, RBC, ConocoPhillips, Moderna, Thomson Reuters, Samsung, Canva, Novo Nordisk, Zscaler, BHP, Cemex, Merck, Scania, thyssenkrupp and Toyota Material Handling.
The partner-page layout repeated exactly — logo grid above and below a centred blue title band between two rules.
Two network visualisations of actual data-sharing activity, April 30, 2020 on the left — a handful of sparse nodes — against July 31, 2026 on the right, a dense saturated disc.
White slide, bold title upper left with the blue accent rule; two circular graph renders side by side at equal size with their dates captioned beneath; a one-line methodology note at the bottom left.
Section divider marking the start of the financial section.
Dark navy field with the title in white heavy capitals at left-centre and a dotted contour-line wave across the lower third — the same construction as the earlier divider in a different colourway.
Snowflake's estimated total addressable market growing from $225 billion in FY26 to $460 billion in FY31 — roughly 2x. A note states that the fiscal year ends January 31 and the figures are Snowflake estimates.
Two large rounded rectangles — grey for FY26, brand blue for FY31 — holding the two figures in oversized white type, joined by a gradient arrow labelled '2x'. A dotted timeline beneath runs from FY26 to FY31.
Four headline metrics for Q2 FY27: 37% year-over-year product revenue growth, a 126% net revenue retention rate, 828 customers with more than $1 million of product revenue, and a 75% non-GAAP product gross margin.
Four equal light-grey panels across the slide, each with a small black all-caps label at the top, an oversized brand-blue figure in the middle and a two-line blue caption beneath. Three footnotes at the bottom point to the appendix.
The revenue cycle explained: customers book, are billed (typically paying annually in advance), consume, and draw down from bookings as they consume, with consumption patterns dictating future bookings. Product revenue is described as the leading indicator of growth; RPO as contracted future revenue not yet recognised; and billings as not necessarily indicative of future consumption because payment terms vary.
Left two-thirds: three navy circles labelled Book, Bill and Consume, numbered 1 to 4 with white rounded callout boxes between them, joined by dotted paths. Right third: three short text blocks with navy headings.
Three columns explaining revenue recognition (consumption — recognised as customers consume the platform), the pricing model (consumption — compute, storage and data transfer), and billings terms (typically upfront, annually in advance for capacity contracts, with some on-demand and in-arrears customers). Each column lists Pros and a 'Consider' — revenue is variable with usage; performance improvements can reduce customer cost; payment terms are flexible.
Three columns separated by hairline rules, each with a navy heading, a blue subheading, a short explanatory paragraph, then bulleted Pros marked with blue triangles and Considers marked with grey triangles.
Annual product revenue of $2,667 million in FY24, $3,462 million in FY25 and $4,472 million in FY26, up 29% year over year; quarterly product revenue of $1,090 million in Q2 FY26 rising through $1,158M, $1,227M and $1,334M to $1,492 million in Q2 FY27, up 37% year over year.
Two bar charts side by side, annual on the left and quarterly on the right, in flat brand blue with values reversed out inside each bar. Each chart carries a navy trend arrow with a circled growth rate at its midpoint.
Remaining performance obligations of $6,932 million in Q2 FY26, $7,881M, $9,772M, $9,205M and $9,004 million in Q2 FY27, with the share expected to be recognised as revenue in the next twelve months at 50%, 48%, 46%, 50% and 54%. A note explains that 54% of RPO as of July 31, 2026 is expected to be recognised within the twelve months ending July 31, 2027.
Five two-tone stacked columns — light blue for the next-twelve-months portion with its percentage reversed out, darker teal for the remainder — with the total above each column and a two-item legend beneath.
Total customers rising from 11,893 in Q2 FY26 through 12,503, 13,245 and 13,862 to 14,554 in Q2 FY27; Forbes Global 2000 customers from 786 through 791, 804 and 815 to 829.
Two five-column charts side by side, light blue at left for total customers and darker teal at right for Forbes Global 2000, each with values reversed out inside the bars and the chart title above.
Customers with more than $1 million of trailing twelve-month product revenue: 654 in Q2 FY26, then 688, 733, 780 and 828 in Q2 FY27 — 27% year-over-year growth.
Single five-column chart in brand blue with values inside the bars, a navy trend arrow across the top and the growth rate in a circled callout at its midpoint.
Net revenue retention rate of 125% for Q2 FY26, Q3 FY26 and Q4 FY26, then 126% for Q1 FY27 and Q2 FY27.
Five near-identical blue columns with the percentage reversed out near the top of each — the flattest chart in the deck, which is the point.
Three two-bar comparisons of Q2 FY26 against Q2 FY27: non-GAAP product gross margin 76% to 75%, non-GAAP operating margin 11% to 15%, and non-GAAP adjusted free cash flow margin 6% to 6%.
Three panels separated by hairline rules, each with a bold title and two bars in a progressively darker blue — light for gross margin, mid-teal for operating margin, navy for cash flow margin — with values above the bars.
Employee headcount by function: 8,769 in Q2 FY26 (S&M 4,047, R&D 2,333, G&A 1,200, cost of revenue 1,189) rising to 9,394 in Q2 FY27 (S&M 4,427, R&D 2,571, G&A 1,169, cost of revenue 1,227), via 9,023, 9,060 and 9,250.
Five stacked columns in four colours — light blue, teal, purple and pink — with every component value reversed out inside its band and the total in bold above each column; four-item legend beneath the axis.
Revenue mix by geography holding steady: Americas 78% for four quarters then 77% in Q2 FY27; EMEA 16% then 17%; APJ 6% throughout. A note explains that revenue is attributed by customer location from ship-to or bill-to information.
Five 100% stacked columns in light blue, teal and pink with each percentage reversed out in its band, a three-item legend beneath and a two-line attribution note at the bottom.
Two platform metrics as of July 31, 2026: 43% of customers have at least one stable edge (data sharing), and 4,105 marketplace listings, up 21% year over year.
Two wide light-grey panels side by side, each with a small black all-caps label, an oversized brand-blue figure and a blue caption beneath. Two footnotes at the bottom.
Guidance placed beside three years of actuals. Product revenue $2,667M in FY24, $3,462M in FY25, $4,472M in FY26 and $6,070M guided for FY27; year-over-year product revenue growth 38%, 30%, 29% and 36% guided; non-GAAP product gross margin 78%, 76%, 76% and 74.0% guided; non-GAAP operating margin 8%, 6%, 10% and 14.5% guided; non-GAAP adjusted free cash flow margin 29%, 26%, 25% and 23.0% guided. A footnote states that a reconciliation of GAAP to non-GAAP guidance measures is not available on a forward-looking basis without unreasonable effort.
Five-row table with four columns — FY24, FY25, FY26 and FY27 Guidance — navy row labels at the left, a navy rule under the headers, hairline separators between rows, and no fill colour anywhere.
Section divider marking the start of the appendix.
Dark navy field with 'APPENDIX' in white heavy capitals at left-centre and nothing else but the footer — the Financial Overview divider stripped of its wave.
Definitions for every metric used in the deck: customers over $1M product revenue, data sharing and what counts as a 'stable edge' (an edge producing at least 20 jobs consuming compute in each of two successive three-week periods), Forbes Global 2000 customers, marketplace listing, net revenue retention rate and its trailing-two-year cohort method, product revenue, remaining performance obligations, and total customers.
Eight justified paragraphs, each opening with a bold defined term, filling the upper two-thirds of a white slide under the standard bold heading.
Five quarters plus three fiscal years. Q2 FY27: product revenue $1,491,861K, total revenue $1,546,793K; GAAP product gross profit $1,057,443K at a 71% margin, adjusted for $31,217K stock-based compensation and $25,424K amortisation of acquired intangibles to a non-GAAP product gross profit of $1,114,084K at 75%. GAAP S&M expense $611,615K (40% of revenue) reconciles to non-GAAP $489,420K (32%); GAAP R&D expense $567,476K (36%) reconciles to non-GAAP $309,146K (20%).
Dense eight-column table with a subtitle under the main heading, thin blue rules separating sections, italic bold percentage rows, and adjustment lines indented beneath each GAAP figure. No fills.
Q2 FY27 GAAP G&A expense of $120,594K, 8% of revenue, adjusted for $44,908K stock-based compensation, $32K amortisation of acquired intangibles, $1,378K acquisition and strategic investment expenses, $2K restructuring recoveries and $17K asset impairment recoveries to a non-GAAP G&A expense of $74,295K, 5% of revenue. A footnote notes that the asset impairment charges relate primarily to the San Mateo office facility Snowflake ceased using in the three months ended April 30, 2025.
Same eight-column reconciliation table, shorter — one expense line and five adjustments — leaving the lower half of the slide empty.
Q2 FY27 GAAP total operating expenses of $1,299,685K, 84% of revenue, reconciling to non-GAAP $872,861K, 57%. GAAP operating loss of $(262,967)K at a (17)% margin reconciles — after $456,363K stock-based compensation, $42,230K amortisation of acquired intangibles and smaller items — to non-GAAP operating income of $236,985K at a 15% margin. A footnote quantifies the employer payroll tax element of stock-based compensation at $23.6 million for the quarter ended July 31, 2026.
Two stacked reconciliation blocks in one eight-column table, the operating income block carrying negative GAAP figures in parentheses and the non-GAAP margin row in italic bold at the foot.
Q2 FY27 GAAP net loss of $(191,720)K, (12)% of revenue, reconciling through stock-based compensation, amortisation of intangibles and debt issuance costs and a $(75,005)K income tax effect to non-GAAP net income of $235,308K, 15% of revenue. The lower block repeats the reconciliation for net income attributable to Snowflake Inc., landing at the same $235,308K.
Two stacked reconciliation blocks, the second nearly identical to the first — the structure that lets a reader see the noncontrolling-interest adjustment has gone to zero.
Q2 FY27 GAAP net loss per share of $(0.55) on 349,257 thousand weighted-average shares; non-GAAP net income per share of $0.67 basic and $0.62 diluted, the diluted figure using 377,878 thousand shares after adding 18,345 thousand dilutive common stock equivalents and 14,603 thousand shares from the convertible senior notes and deducting 4,327 thousand for the antidilutive impact of the capped call transactions.
Per-share reconciliation table across the same eight columns, with multi-line row labels wrapping on the left and the share-count build indented beneath the diluted line.
Q2 FY27 GAAP net cash provided by operating activities of $91,357K, 6% of revenue, less $7,554K of property and equipment purchases, giving non-GAAP free cash flow of $83,803K at a 5% margin; adding $8,500K of net cash paid on payroll tax items gives adjusted free cash flow of $92,303K at 6%. Investing activities used $(349,437)K and financing activities used $(117,051)K. A footnote gives the excluded employee payroll taxes on net share settlement as $184.9 million for the quarter.
Single reconciliation block across eight columns with two margin rows in italic bold, plus two extra cash-flow lines appended at the foot for investing and financing activities.
One-page summary: product revenue $1.49B, up 37% year over year; net revenue retention rate 126%; 14,554 total customers with 32% year-over-year growth in net new additions; 828 customers with trailing twelve-month product revenue over $1 million, up 27%; 330+ product capabilities launched to GA in H1 FY27, up 35% year over year; 5,800 accounts using Snowflake CoWork; 9,100+ accounts using Snowflake CoCo with 2,000+ net new in the quarter; and the AI Data Cloud platform panel repeated from slide 8.
Full-bleed brand-blue field with the white wordmark and an underlined as-of date across the top; seven white rounded cards in two rows, each with an all-caps label, a blue line icon and an oversized blue figure; the platform panel occupies the wide card at the lower right. Three footnotes run along the bottom.
Closing slide.
Full-bleed brand blue with 'THANK YOU' in white heavy capitals at left-centre and the white snowflake wordmark above the copyright line in the bottom left corner.
Распространенные вопросы об этом слайде и основном содержании презентации.
The full 37-slide Snowflake Q2 FY27 investor presentation as both PDF and editable PowerPoint, plus a page-by-page preview. The PPTX keeps charts and tables as editable objects so you can substitute your own figures.
Yes. The PDF is the file Snowflake published on its investor relations site for the second quarter of fiscal 2027. The PowerPoint was converted from that PDF for editing convenience — check any layout you plan to reuse, since conversion is not always pixel-perfect.
Product revenue of $1.49 billion, up 37% year over year; a 126% net revenue retention rate; 14,554 total customers and 828 with more than $1 million of trailing twelve-month product revenue; a 75% non-GAAP product gross margin; and remaining performance obligations of $9.0 billion, 54% of which is expected to be recognised in the next twelve months.
Stock-based compensation, almost entirely. Slide 32 shows a GAAP operating loss of $263.0 million becoming non-GAAP operating income of $237.0 million after adding back $456.4 million of stock-based compensation charges and $42.2 million of intangible amortisation. The deck gives the full reconciliation rather than only the adjusted figure.
Product revenue of $6,070 million, which would be 36% year-over-year growth, with a 74.0% non-GAAP product gross margin, a 14.5% non-GAAP operating margin and a 23.0% non-GAAP adjusted free cash flow margin. Slide 27 places all four next to three years of actuals.
Because it changes which metrics matter. Snowflake recognises revenue as customers consume rather than ratably over a contract, so billings do not predict future revenue the way they would at a subscription company. Slides 16 and 17 make that case explicitly, and list the downsides — variable revenue, flexible payment terms — alongside the advantages.
It is a strong model for a growth-stage company that needs to tell a product story and a financial one in the same document. The structure is worth copying: narrative section, divider, market size, quarterly metrics each on their own slide, business model explained plainly, guidance beside actuals, then a definitions page and full reconciliations in the appendix.
One brand blue carried across every chart, with darker tones introduced only when a second series needs separating. Values sit inside the bars instead of on an axis, so most charts have no axis at all. Section dividers switch to a dark navy so the deck's two halves are obvious, and the headline metric slides use oversized numerals on grey panels that read from across a room.
Original PDF published by Snowflake alongside its Q2 FY27 results.

Create Your Own Slides
Turn your ideas into professional presentations in seconds with 2slides AI.
Используйте профессиональные дизайны, выберите свой стиль и генерируйте слайды с идеальной отрисовкой текста. На базе Nano Banana—начните создавать свою презентацию прямо сейчас.
Your AI Agent for slides. Save time, shine faster with intelligent presentation creation.




© 2026 2slides. All rights reserved.