
Входит в коллекцию Примеры презентаций для инвесторов · Примеры презентаций для инвесторов из Австралии
Resolute Mining Q3 2026 Activities Presentation: the 25-slide quarterly activities report deck from ASX-listed African gold producer Resolute Mining Limited (ASX: RSG), dated 29 October 2026 and lodged with the ASX. It covers the September 2026 quarter (Q3 = July to September 2026; Resolute reports on a calendar year): 44,398 oz gold poured at a Group AISC of US$2,506/oz, Q3 revenue of US$143 million, EBITDA of US$64 million, net cash of US$276 million, the Doropo construction project in Côte d'Ivoire, the ABC and La Debo growth projects, and the Syama (Mali) and Mako (Senegal) operations.
Использует обложку этой презентации как образец стиля для слайдов с вашим содержанием. Или выберите любую страницу ниже, чтобы взять за образец её макет.
Быстрая навигация
Теги
Поделиться слайдами
Resolute Mining Q3 2026 Activities Presentation: the 25-slide quarterly activities report deck from ASX-listed African gold producer Resolute Mining Limited (ASX: RSG), dated 29 October 2026 and lodged with the ASX. It covers the September 2026 quarter (Q3 = July to September 2026; Resolute reports on a calendar year): 44,398 oz gold poured at a Group AISC of US$2,506/oz, Q3 revenue of US$143 million, EBITDA of US$64 million, net cash of US$276 million, the Doropo construction project in Côte d'Ivoire, the ABC and La Debo growth projects, and the Syama (Mali) and Mako (Senegal) operations.
Подробный просмотр каждой страницы слайда, включая макет, ключевой контент и визуальные элементы.
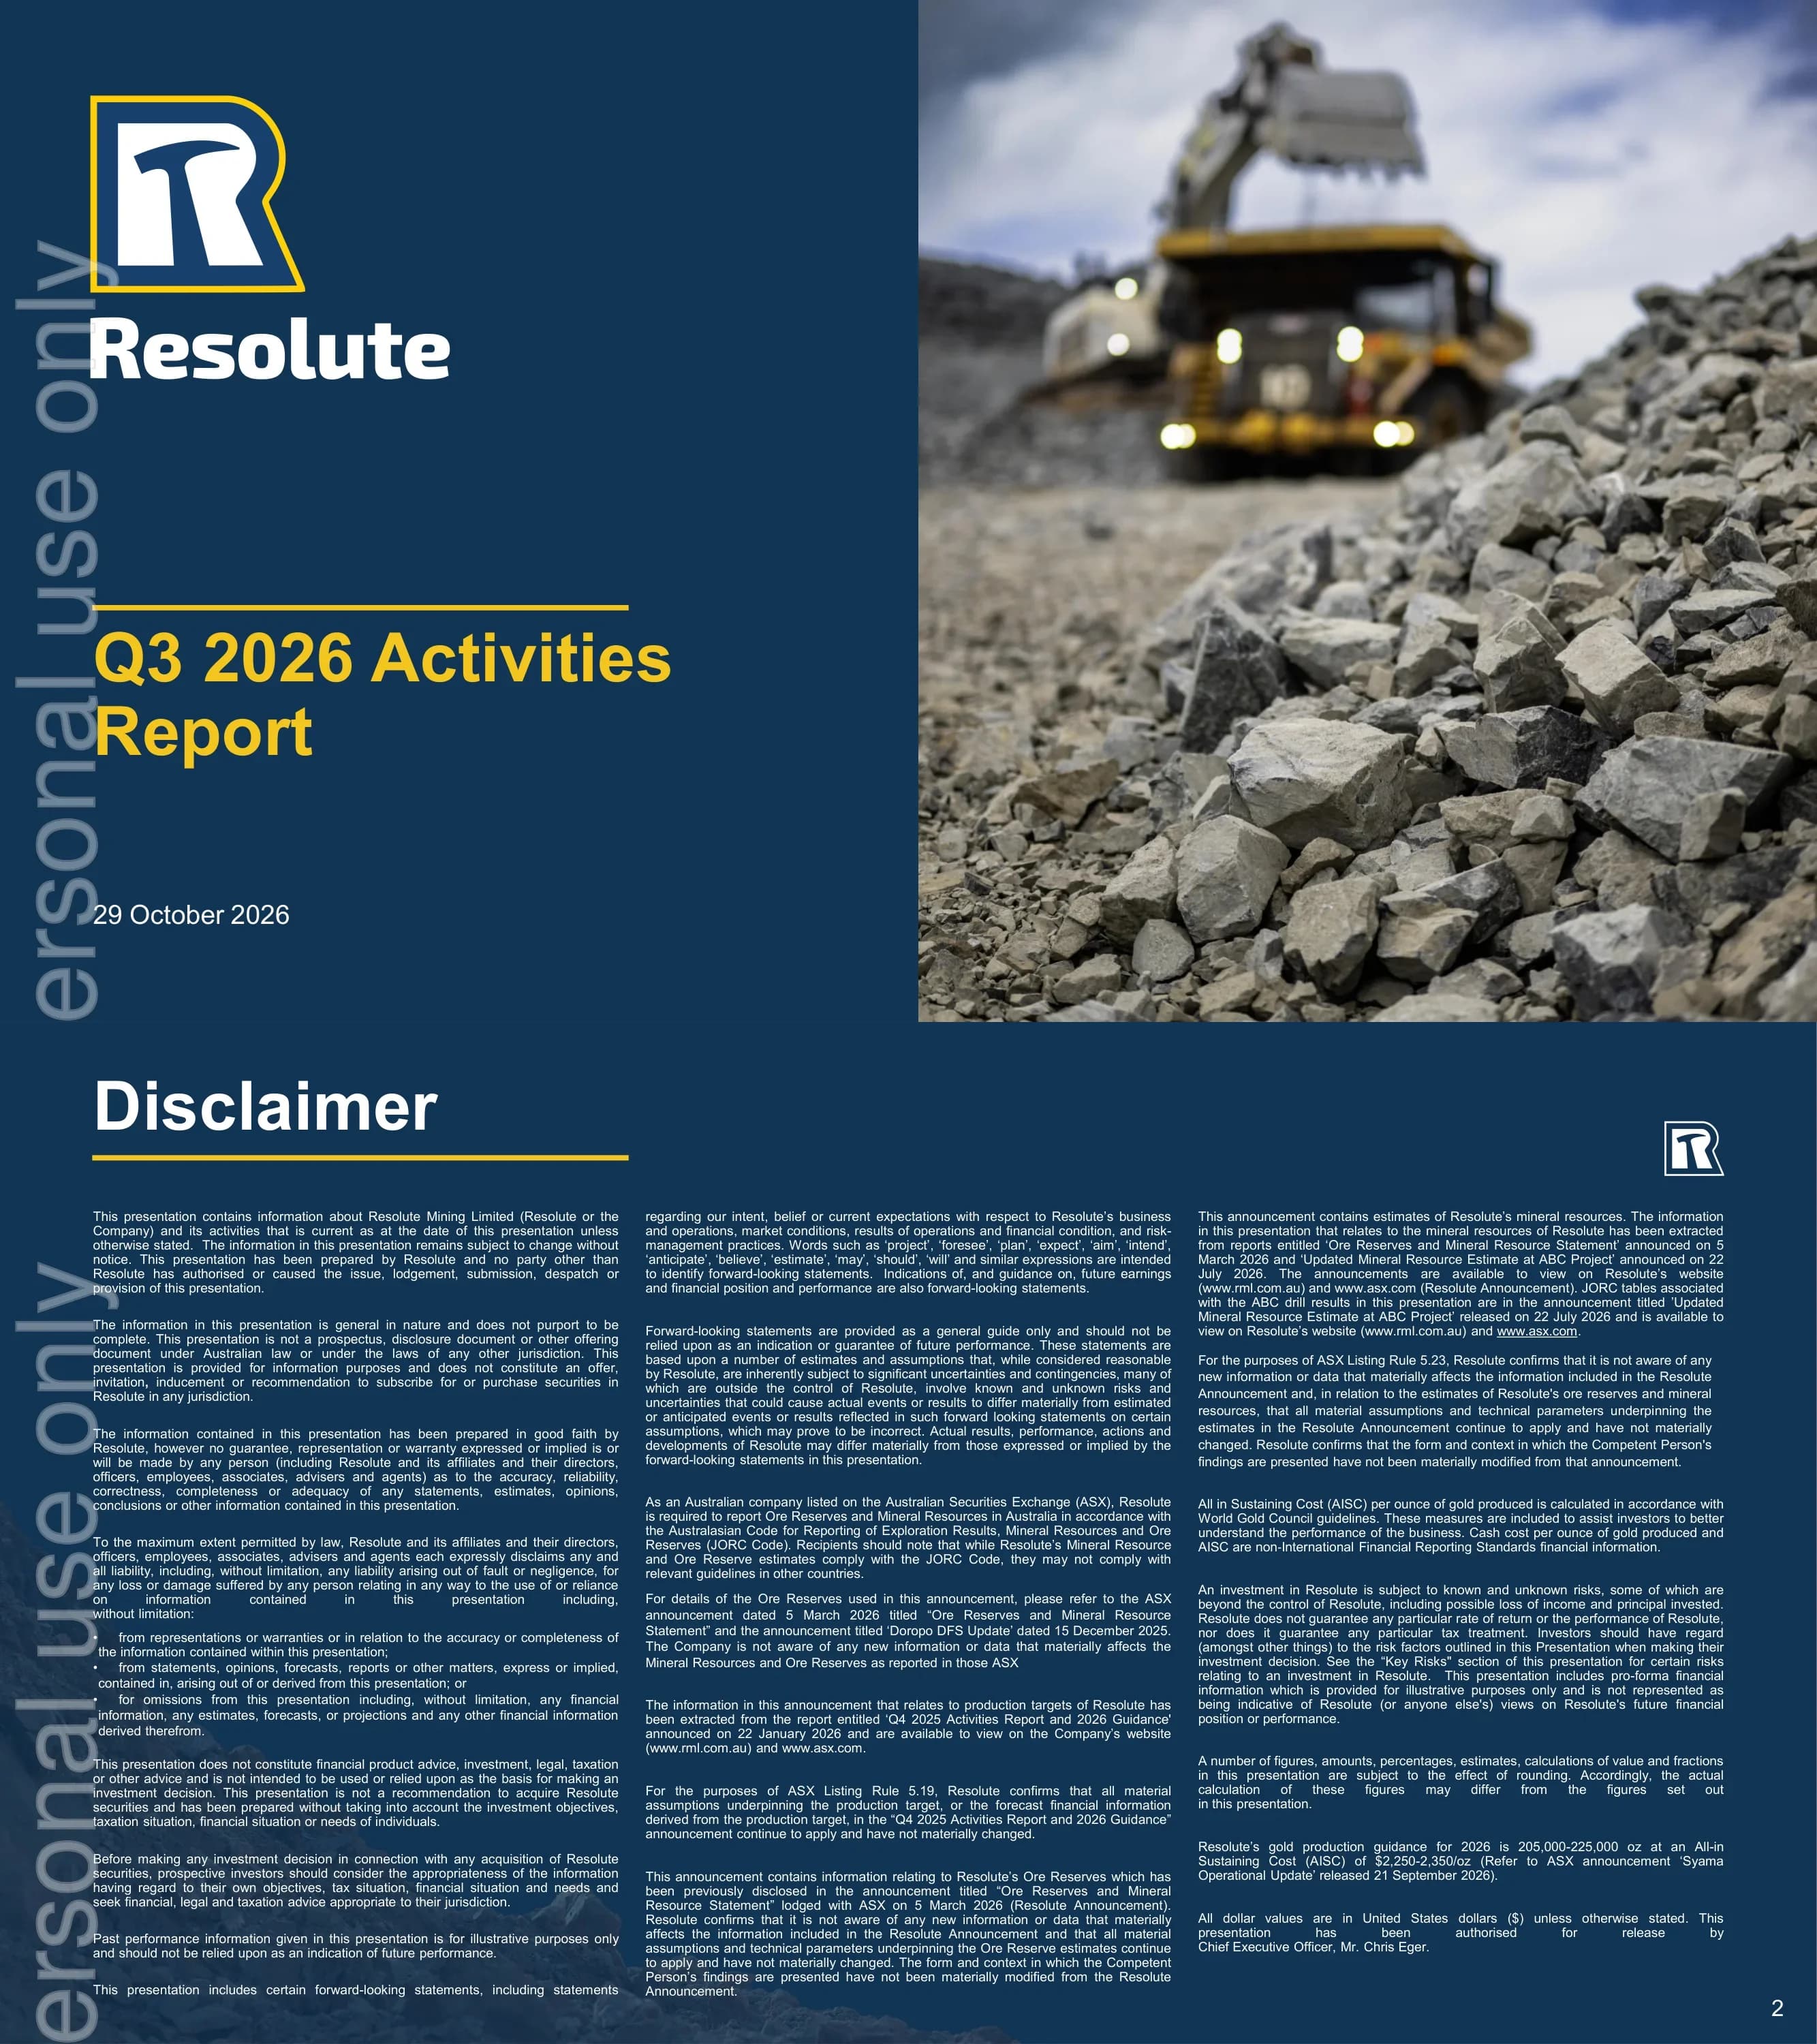
Title slide for Resolute's Q3 2026 Activities Report dated 29 October 2026, with the Resolute R-and-hammer logo and wordmark on a navy panel beside a photo of an excavator loading a haul truck over a pile of broken ore.
Split layout: left half solid navy with logo, yellow rule, yellow title and date; right half full-height mining photograph.
Three-column legal disclaimer: information current as at the date of the presentation, forward-looking statements, JORC Code reporting of Ore Reserves and Mineral Resources (referencing the 5 March 2026 Ore Reserves and Mineral Resource Statement, the 15 December 2025 Doropo DFS Update and the 22 July 2026 ABC MRE), ASX Listing Rules 5.19 and 5.23 confirmations, AISC calculated per World Gold Council guidelines as non-IFRS information, 2026 production guidance of 205,000-225,000 oz at AISC of US$2,250-2,350/oz (Syama Operational Update, 21 September 2026), and the statement that all dollar values are in US dollars unless otherwise stated; authorised for release by CEO Chris Eger.
Dense three-column body text under a large white heading with a yellow underline on a navy background.
Lists the call presenters: CEO Chris Eger, COO Gavin Harris, CFO Dave Jackson, and Corporate Development and Investor Relations lead Matty O'Toole-Howes.
Full-bleed photo of a terraced open pit with a bullet list of names overlaid in white bold text and a yellow heading.
One-page quarter summary. Operations: year-to-date TRIFR 0.85 with four recordable injuries in Q3; Syama 31,777 oz at AISC US$2,596/oz; Mako 12,621 oz at AISC US$1,516/oz; on track for revised 2026 guidance of 205-225 koz at AISC US$2,250-2,350/oz. Projects: Doropo on track and on budget with US$52.9 million capital spend in the quarter; ABC over 23,000 m drilled; La Debo MRE up 44% from 643 koz to 927 koz; Syama Sulphide Conversion Project commissioning nearing completion; Mako Life Extension Project advancing ESIA and Bantaco drilling. Corporate: Doropo financing completed with US$260 million local bank debt in Côte d'Ivoire, US$29 million drawn. Operating metrics box: 44,398 oz gold poured, US$2,506/oz Group AISC, US$85 million capex. Financial metrics box: 33,035 oz gold sold, US$4,325/oz average realised price, US$64.0 million EBITDA, US$55.8 million operating cash flow, US$276.1 million net cash.
Two-column dashboard: left column of grouped bullet lists (Operations, Projects & Exploration, Corporate); right column with a cream Operating Metrics card above a grey Financial Metrics card.
Production growth chart: 277 koz achieved in 2025, 205-225 koz guidance for 2026, 250-275 koz target for 2027 (ABC feasibility workstreams), then rising 2028-2029 with Doropo in production toward a target of more than 500 koz per year beyond 2030 including ABC and future growth opportunities (La Debo, Guinea exploration, Doropo expansions, optimising Mali). Donut charts show production mix moving from Syama 64% / Mako 36% in 2025 to Syama 40% / Doropo 42% / Mako 18% in 2029. AISC bar chart (US$/oz): Syama 2,350 and Mako 1,700 at 2026E guidance midpoint, Doropo 1,472 life-of-mine average. Footnotes reference JORC-compliant reserves and source announcements.
Stacked bar timeline across the top, two donut charts and an AISC bar chart in the lower half, with outlined callout boxes on the right; footnotes at bottom.
Section break introducing the Côte d'Ivoire assets (ABC, La Debo and Doropo), over a photo of geologists logging drill core.
Full-bleed photograph with large white section title and a short yellow rule on the left.
ABC is being advanced to become Resolute's fourth mine in West Africa and second in Côte d'Ivoire. Since the July 2026 MRE update, focus is on infill drilling and expanding the resource footprint; 23,900 m drilled in Q3 2026 with 11 rigs operating; metallurgical studies and the Environmental and Social Impact Assessment started in Q3 2026. A map shows the Faraka Nafana, Kona (Moya, Kona Central, Kona South), Windou, Gbemanzo, Kato and Gouramba permits.
Text bullets on the left; permit map with inset country map and legend on the right.
Updated MRE targeted for Q1 2027; the next twelve months cover technical studies, environmental and social baseline work, metallurgical testwork and site infrastructure upgrades. Study schedule Gantt (Q4 2026-Q4 2027): Mineral Resource Update, ESIA Phase 1, technical studies (hydro, geotech, metallurgical), mine planning and optimisation, with expected study completion in Q4 2027. A drill plan shows completed Q3 and pending holes at Kona Central and Kona South.
Left: bullets above a quarterly Gantt chart with a star milestone. Right: drill-hole plan with zoom insets and geology legend.
La Debo is an MRE-stage development project in Côte d'Ivoire offering longer-term organic growth. 15,867 m of diamond drilling in 2026 led to an October 2026 MRE update at G3S; the programme aimed to drill out a 600 m strike panel and extended higher-grade mineralisation down dip at G3S. Map shows targets G3N, G3S, G2, G4, F1, F2, Main, LD and LDS within the La Debo, Okroyou and Serihio permits.
Bullets on the left, geological permit map with legend and inset on the right.
October 2026 MRE update for G3 South after additional drilling (G3 North unchanged): G3S resource up 75% to 14.9 Mt at 1.4 g/t; a higher-grade core of 4.2 Mt at 2.9 g/t Au for 397 koz. Inferred MRE table (0.5 g/t cut-off, unconstrained): G3 North 8.6 Mt at 0.9 g/t for 0.26 Moz; G3 South 14.9 Mt at 1.4 g/t for 0.67 Moz; total 23.5 Mt at 1.2 g/t for 0.93 Moz. Plan view lists drill intercepts such as 23 m at 3.38 g/t Au including 1 m at 61.34 g/t (LBDD0078) and 25 m at 1.91 g/t including 5 m at 6.68 g/t (LBDD0077).
Bullets and a blue-header resource table on the left; annotated drill plan with assay callouts and colour legend on the right.
Doropo construction: no LTIs since construction began; over 800 people on site; Operations General Manager hired; stage 1 accommodation delivered; key earthworks, water storage and tailings earthworks and plant concrete works under way; SMP and electrical packages progressed; tender for a 30 MW solar plant completed; wet season navigated on schedule. Timeline: on track and on budget for first gold in H1 2028; US$52.9 million capital spend in Q3; about US$315 million (61%) of total capex committed. Gantt (Q1 2026-Q4 2028) covers early works, long-lead procurement, construction, commissioning, first gold (Q2 2028) and ramp-up.
Two columns: left bullet list of Q3 activities, right project timeline bullets above a quarterly Gantt chart.
Photo page of construction progress: concrete batch plant commissioned, ring beam foundations, mill area raft foundation, and a concrete pour on the CIL Tank No. 8 ring beam.
Four aerial and ground photos in a staggered grid with yellow borders and short captions.
Remainder-of-year plan: complete the construction camp and start mine village installation; finish plant-site and mine services bulk earthworks early in Q4 and continue the TSF, water storage dam and water harvesting dam; concrete works across CIL, milling, thickener, reclaim and crushing; mobilise the CIL tank contractor; complete water bores and borefield piping; award major mechanical, electrical, mining and solar packages; progress SMP and E&I installation contracts; detailed engineering and procurement; owner's team and operational readiness.
Single-column bullet list under a large heading on navy background.
Exploration drilling began in Q3 at the Kilosegui deposit about 30 km from the Doropo process plant: an initial 20,000 m RC and step-out diamond programme to test down-dip extensions. Kilosegui holds the largest Ore Reserve in the updated DFS mine plan (21.8 Mt at 1.22 g/t Au for 856 koz at a US$1,950/oz gold price), sits on a 6 km mineralised trend open down dip, and study work is assessing a second standalone processing plant and tailings facility.
Bullets on the left, satellite image with block model and planned drill traces on the right.
Section break for the Mali operations (Syama), shown with an underground drill rig in a meshed tunnel.
Full-bleed dark underground photograph with white section title.
Syama produced 31.8 koz at AISC US$2,596/oz, in line with the September operational update. Underground mining was constrained early in Q3 by explosive availability and wet-area blasting; emulsion supply improved and an on-site emulsion plant is being commissioned. The SSCP roaster upgrade was commissioned, with the secondary crusher and ball mill to follow. Q4 production expected to rise to 45-50 koz. Q3 capex US$18.6 million; full-year capex expected below the US$70-85 million guidance. Table (Sep Q vs Jun Q vs 9M 2026 vs 9M 2025): underground ore mined 490,070 t at 2.09 g/t; open pit 300,182 t at 2.11 g/t; sulphide ore processed 655,115 t at 2.15 g/t, 72% recovery, 30,439 oz poured, 20,762 oz sold; oxide 53,741 t at 0.61 g/t, 1,338 oz poured; 9M 2026 AISC US$2,459/oz vs US$2,092/oz in 9M 2025.
Bullet commentary on the left; detailed operating table on the right grouped into Mining, Processing and Cost bands.
Section break for the Senegal operation (Mako), shown with a photo of the Mako processing plant beside a waste dump.
Full-bleed processing plant photograph with white section title.
Mako produced 12.6 koz at AISC US$1,516/oz, in line with expectations; year-to-date production 43.7 koz keeps Mako on track for 55-65 koz full-year guidance. AISC came in below the US$1,600-1,800/oz guidance range thanks to lower rehandle, processing and maintenance costs; sustaining capital of US$1.2 million for plant maintenance. Table: ore processed 504,295 t at 0.85 g/t and 91% recovery; gold poured 12,621 oz; gold sold 10,935 oz; capex US$3.3 million; 9M 2026 gold poured 43,733 oz vs 82,140 oz in 9M 2025 and AISC US$1,579/oz vs US$1,180/oz.
Bullets on the left, compact seven-row operating table on the right.
Q3 2026 MLEP work focused on permitting, ESIA public hearings and the Relocation Action Plan (RAP), including agreeing the relocation package with the community; exploration permit transfers expected in Q4 2026 and exploitation permits for both deposits in H1 2027. Next steps: agree the Tomboronkoto relocation package and the Bantaco livelihood restoration approach to complete RAP Phase 1 by end Q1 2027, and finalise new village design and tender documents for RAP Phase 2. Gantt (Q3 2026-Q4 2029): technical studies, permitting, plant modifications, relocation and road diversion, Mako stockpile processing, Bantaco mining and Tomboronkoto mining.
Bullets (Q3 activities and next steps) on the left; quarterly Gantt chart with blue, grey and yellow bars on the right.
Section break for the financial results, over a photo of articulated haul trucks on a muddy haul road.
Full-bleed photograph with white section title and yellow rule.
Six headline figures: Q3 revenue US$143 million (unaudited), Q3 EBITDA US$64 million (unaudited), net cash US$276 million, available liquidity US$480 million, Q3 Group AISC US$2,506/oz and Q3 average realised gold price US$4,325/oz.
Three staggered outlined boxes, each with a yellow circular icon (money bag, gold bars, pickaxe) and two large figures with yellow underlines.
Total capital and exploration spend of US$85 million as Doropo construction and exploration ramped up; working capital inflow of US$6 million; net cash of US$276 million at quarter-end; US$260 million of local bank debt secured for Doropo with US$29 million drawn; existing balance sheet, operating cash flow and local debt seen as sufficient to fund Doropo. Waterfall: net cash US$317.4 million at 1 July 2026, plus operating cash flows 55.8 and working capital 6.2, less VAT paid 9.1, capex 74.8, exploration 10.6 and minority shareholder dividend 8.8, ending at US$276.1 million on 30 September 2026.
Bullets on the left over a light background with a rock image; net cash waterfall chart on the right.
Section break before the closing summary, with three workers in high-visibility gear walking along a red dirt road.
Full-bleed photograph with white section title.
Closing takeaways: Doropo construction fully funded, on track and on budget; a strong organic growth pipeline across the portfolio (ABC and expansion studies); net cash of US$276 million; a broader geographic footprint for long-term growth; positioned to exceed 500 koz of annual gold production by the end of 2028.
Left navy panel with five yellow arrow bullets; right panel photo of gloved hands holding a gold bar.
Back cover with the large Resolute logo and wordmark and the company website www.rml.com.au.
Solid navy background with oversized logo and wordmark, yellow bottom rule.
Распространенные вопросы об этом слайде и основном содержании презентации.
It is the 25-slide deck Resolute Mining Limited (ASX: RSG) released with its Q3 2026 Activities Report on 29 October 2026 and lodged with the ASX. It covers safety, production and costs at Syama and Mako, Doropo construction, the ABC and La Debo projects, and the quarter's financial results.
Resolute reports on a calendar year, so Q3 2026 is the September 2026 quarter, July to September 2026. This differs from many ASX companies whose financial year runs July to June.
US dollars. Although Resolute is listed on the ASX, the deck's disclaimer states that all dollar values are in United States dollars unless otherwise stated, so the $143 million revenue and $2,506/oz AISC are US$ figures.
44,398 oz of gold poured and 33,035 oz sold, Group AISC of US$2,506/oz, an average realised gold price of US$4,325/oz, revenue of US$143 million and EBITDA of US$64 million (both unaudited), operating cash flow of US$55.8 million, net cash of US$276.1 million and available liquidity of US$480 million.
Doropo in Côte d'Ivoire is under construction, on track and on budget for first gold in H1 2028. Q3 capital spend was US$52.9 million, about US$315 million (61%) of capex is committed, and US$260 million of local bank financing has been secured with US$29 million drawn.
Revised 2026 guidance is 205-225 koz at AISC of US$2,250-2,350/oz. The deck sets out a pathway to more than 500 koz a year, with Doropo in production and ABC and other growth options, and the closing slide says Resolute is positioned to exceed 500 koz annually by the end of 2028.
Yes. The page offers the original PDF and a PPTX version converted from that PDF, so slide text, tables and Gantt charts can be edited. Conversions from PDF may need minor layout fixes, and the original remains the authoritative ASX document.
Useful patterns include the split operating/financial metrics summary on slide 4, the per-mine operating tables on slides 16 and 18, the construction and study Gantt charts on slides 8, 11 and 19, and the net cash waterfall on slide 22. Replace the data with your own and keep the country section dividers to organise assets by jurisdiction.
Company website named on the closing slide; hosts ASX announcements including quarterly activities reports.

Create Your Own Slides
Turn your ideas into professional presentations in seconds with 2slides AI.
Используйте профессиональные дизайны, выберите свой стиль и генерируйте слайды с идеальной отрисовкой текста. На базе Nano Banana—начните создавать свою презентацию прямо сейчас.
Ваш AI-агент для слайдов. Экономьте время, сияйте быстрее с интеллектуальным созданием презентаций.


© 2026 2slides. Все права защищены.