
Входит в коллекцию Примеры презентаций для инвесторов
REA Group Investor Day 2026: the 122-page presentation that REA Group, operator of realestate.com.au, lodged with the ASX on 22 October 2026. It sets out the company's AI-era strategy, its growth engines (New Homes, Commercial, Financial Services and its global businesses) and its through-the-cycle financial targets. All amounts are in Australian dollars (A$) as shown in the deck.
Использует обложку этой презентации как образец стиля для слайдов с вашим содержанием. Или выберите любую страницу ниже, чтобы взять за образец её макет.
Быстрая навигация
Теги
Поделиться слайдами
REA Group Investor Day 2026: the 122-page presentation that REA Group, operator of realestate.com.au, lodged with the ASX on 22 October 2026. It sets out the company's AI-era strategy, its growth engines (New Homes, Commercial, Financial Services and its global businesses) and its through-the-cycle financial targets. All amounts are in Australian dollars (A$) as shown in the deck.
Подробный просмотр каждой страницы слайда, включая макет, ключевой контент и визуальные элементы.
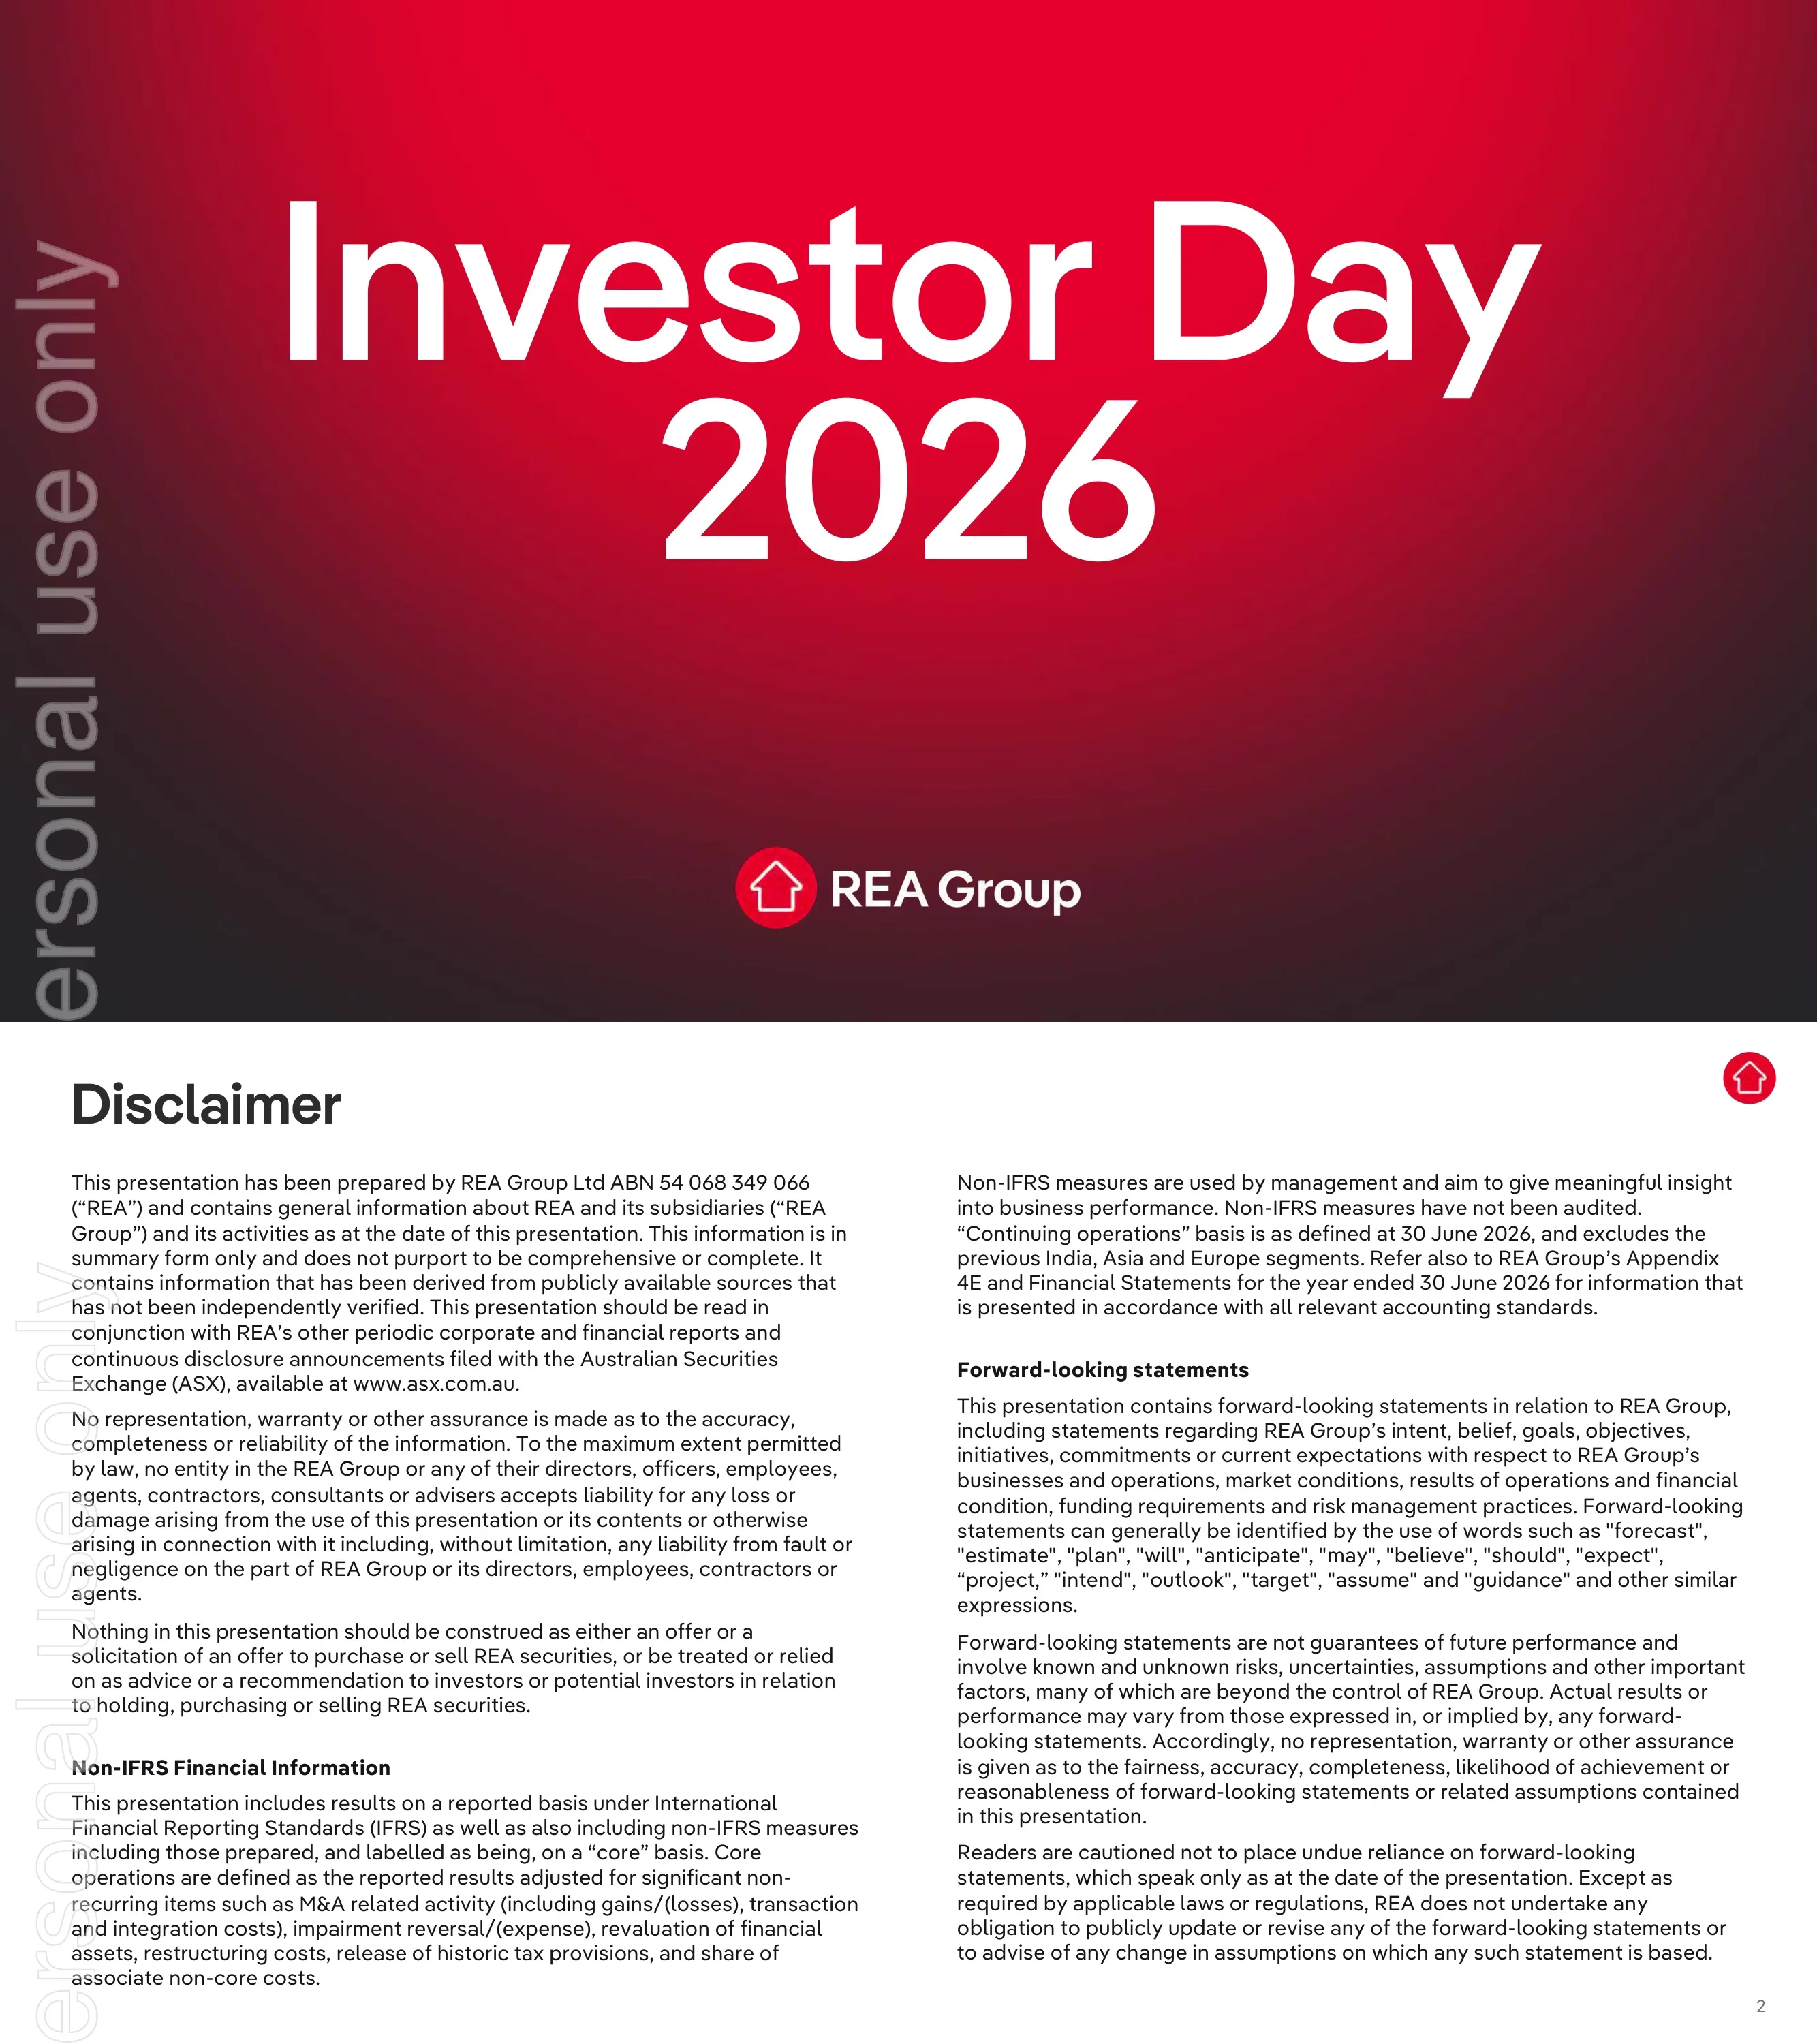
Cover slide for REA Group's Investor Day 2026.
Full-bleed radial red gradient fading to charcoal at the corners; large centered white title on two lines; REA Group house logo and wordmark centered at the bottom.
Legal disclaimer from REA Group Ltd (ABN 54 068 349 066): general information only, no offer of securities, non-IFRS 'core' measures, and cautions on forward-looking statements. 'Continuing operations' is defined at 30 June 2026 and excludes the former India, Asia and Europe segments.
White background, bold black title top-left, dense body text in two columns with bold subheadings (Non-IFRS Financial Information, Forward-looking statements); red house icon top-right.
Running order from 9:30am Welcome (Alice Bennett) to 12:15pm Q&A Session #2: Strategy & Investor Proposition, Our Edge, Consumer, Residential, Q&A #1, then New Homes, Commercial, Financial Services, Global Businesses, People & Technology and Finance, each with named presenters. A break follows Q&A #1 and lunch follows Q&A #2.
Dark maroon background; table-like rows with time on the left, session title in large white text in the middle and presenters right-aligned; thin divider lines; red pill labels 'Break' and 'Lunch' sit on red horizontal rules.
Section divider for the strategy session presented by Cameron McIntyre, Chief Executive Officer.
Red gradient background; very large white two-line title top-left; presenter headshot card with name and title bottom-right; REA Group logo bottom-left.
Leadership team of nine: Cameron McIntyre (CEO), Andrew Cramer (CFO), Katrina Konstas (Chief Commercial & Marketing Officer), Jonathan Swift (CPO), Steve Maidment (CTO), Jane Cohen (Chief Strategy Officer), Anthony Waldron (CEO Financial Services), Elisa Nerone (Chief People & Sustainability Officer) and Tamara Kayser (Chief Legal Officer & Company Secretary).
White background; title with 'next move' in red; 5 + 4 grid of cut-out headshots on light-grey rounded cards, each with red name and grey role caption.
Seven shifts: refreshed strategy for the AI era built on trust; accelerating AI consumer property experiences; deepening customer partnerships and value; evolving how product is developed; executed revised M&A approach; new approach to capital; new management team.
Split layout: left third is a red gradient panel with white title and REA Group logo; right two-thirds white with a numbered list (large red numerals 1-7), each line with key phrase highlighted in red, separated by grey rules.
Four proof points: #1 brands in residential and commercial property; 9 in 10 Australians searching for residential property choose realestate.com.au; 20 visits per person per month on average to the realestate.com.au apps; 9 in 10 agents recommend realestate.com.au. A logo strip shows the portfolio brands (realestate.com.au, realcommercial.com.au, property.com.au, Flatmates, Ignite, Mortgage Choice, PropTrack, iGUIDE, realtor.com and others).
Dark maroon background; four white rounded cards in a row, each with a red pill header and a huge red statistic; footnotes below; white band at bottom with two rows of brand logos.
Six chapters of REA history: Print Disruptor (until 2005, online marketplaces), Scaled Disruptor (2006-10, national scale and mobile-first), Value Creator (2011-15, subscription to vendor-paid depth), Marketplace Innovator (2016-20, Ignite agent solutions), #1 Property Marketplaces (2021-25, Financial Services and Data) and 'Our next move' (2026-30, harnessing AI to reinvent, scale and accelerate growth).
White background; six-column timeline with red 'Chapter N' pills, era title, years and description; below each a screenshot of the product from that era (early website, early iPhone app, web listing page, Ignite dashboard, modern app, AI-era app); Melbourne skyline photo along the bottom with tagline 'Changing the way the world experiences property'.
Revenue and EBITDA bars from FY01 to FY26 grouped by the six chapters. FY16-26 revenue CAGR of 12% (continuing operations) and EBITDA CAGR of 13% (core, continuing operations).
Maroon frame with a white panel; clustered column chart (red revenue, grey EBITDA) across FY01-FY26 with alternating grey bands marking Chapters 1-5 and an upward arrow into Chapter 6; two red concentric-ring circles with the CAGR figures overlap the lower left.
Strategy framework: purpose 'To change the way the world experiences property'; serves Consumers, Customers and Brokers; edge of deep relationships, unparalleled data and better outcomes around the vision 'The trusted partner powering every property move'; three missions: Reinvent property experiences, Scale growth engines (Commercial, New Homes, Financial Services, new markets), Accelerate the organisation. Amplifiers: Innovation Leadership, Dynamic Culture, Operational Excellence.
White card on maroon background; left grey bars for audiences, central red ring diagram with curved text and house icon, right red arrow-shaped banners for the three missions; label pills (Our Purpose, Who We Serve, Our Edge, Our Missions, Our Amplifiers); 'Our next move' logo top-right.
40+ AI experiences delivered to audiences and 2.6x faster speed to value with agentic-first squads. Consumers: 1 in 4 AI conversations lead to high value actions; Customers: 15k+ Campaign Assist conversations to date; Brokers: Policy Search saves 30% time per loan application.
Red gradient background; left column with two large white stats separated by a rule; right three phone screenshots under CONSUMERS / CUSTOMERS / BROKERS headings, each overlaid with a red ringed stat bubble.
Four pillars: better vendor outcomes to support advertising yield (depth advertising value, add-on penetration, new add-ons); uplift customer productivity and growth (subscription tier value, new products e.g. Likely to List); AI productivity funds growth engine acceleration (growth engine revenue); new TAMs unlocked by agentic AI (partner lead referrals, premium consumer value). Each lists value-creation drivers.
Maroon gradient background; four columns with red header blocks, translucent body panels listing 'Value creation' bullets and 'Monetisation levers' as outlined pills; dashed pills mark future optionality, explained in a key bottom-right.
Video placeholder slide; the frame shows aerial footage of a hilly Australian residential suburb with detached houses and trees. No data on the slide.
Full-bleed photo/video still with a white translucent house icon top-right and a 'VIDEO' label bottom-left.
Take-rate (average cost to advertise on REA relative to sale price) rose only from 0.20% in FY20 to 0.22% in FY26; average cost to advertise on REA relative to the average marketing schedule rose from 36% to 43%, still less than half.
Dark maroon background; two white rounded cards side by side, each with a bold headline and a two-bar red column chart (FY20 vs FY26) with values inside the bars and a caption below.
FY26 revenue (continuing operations) of $1.7b, core EBITDA $1.1b and 5-year revenue CAGR of +14%. Breakdown: Residential Buy & Rent core $1.3b; growth engines New Homes $132m, Commercial $106m, Financial Services $148m, Global $18m.
White panel on maroon; left pink 'Core' card with $1.3b, centre grey 'Growth Engines' block with a 2x2 grid of white cards in brand colours (red, blue, teal, navy), dark banner 'Powered by leading consumer and Ignite customer experiences'; right grey sidebar with three stacked headline figures.
Residential core $3.7b addressable TAMs (residential advertising $2.9b, customer solutions $0.8b; ~35% REA revenue share); domestic growth engines $3.0b (New Homes $1.0b, Commercial $0.3b, Financial Services $1.7b; ~13%); global growth engines $45.9b+ (Move North America $45b, iGUIDE North America $0.6b, Distilled Ireland $0.3b+; ~2%); potential expansion TAMs $4.3b (conveyancing, connections, building & pest, buyer advocates, home improvements; <1%).
Maroon background; four white columns with large red/grey TAM figures, grey sub-tiles for each business in colour-coded amounts, and REA revenue share at the bottom; the potential-TAM column uses grey text and a dashed box; dense footnotes.
Growth drivers by segment: Residential (AI-powered advertising campaigns, AI-powered workflows, seller leads); New Homes (lead quality and volume, expanded advertising suite, value beyond advertising); Commercial (more high-quality leads, advertising and workflow value, proprietary data); Financial Services (REA-sourced leads, AI broker efficiency, value beyond mortgages); Global (Move, iGUIDE North America, Distilled Ireland); Expansion TAMs (leads from buyer and owner experiences, expanding participation). Taglines: extend our runway, accelerate from strong foundations, create value exchange, unlock via AI assistants.
Maroon background; four white grouped panels containing six columns of three stacked tiles, each column headed by a colour-coded pill (red, red, blue, teal, navy, grey); summary taglines beneath each group.
65% EBITDA margin (core, continuing operations); free cash flow grew from $300m in FY21 to $676m in FY26, +18% CAGR; FY26 net cash of $366m (as at 30 June 2026, excluding lease liabilities).
Maroon gradient background; three white cards: big red 65% stat, a two-bar column chart with a grey CAGR bubble and bracket arrow, and big red $366m stat.
Four-point investor proposition: #1 with clear value runway to grow core Residential; portfolio of growth engines with well-defined plans to capture value; proven innovator with a unique edge (relationships, data, outcomes) to lead in the AI era; strong cash generation and balance sheet to fund growth.
Aerial suburb photo with a maroon-to-red overlay; small subtitle above large white headline; four translucent rounded cards numbered 1-4 with white text.
Section divider for 'Our Edge' presented by Jane Cohen (Chief Strategy Officer) and Jonathan Swift (Chief Product Officer).
Red gradient background; huge white two-line title top-left; two presenter photo cards with names and titles bottom-right; REA Group logo bottom-left.
Property journeys are human, unique, complex and high stakes; REA's edge answers each with deep relationships, unparalleled data, better outcomes and trusted partnership. Buying a home is one of the top 3 biggest life decisions, and takes 40 weeks from search to transact.
Left: photo of an agent speaking to buyers at an open home, overlaid with title and two red stat circles; right: four rows pairing a dark 'Property journeys are...' card with a red arrow-shaped 'REA's edge is...' card.
Consumers: 50%+ of Australian adults visit realestate.com.au every month and 80%+ of traffic comes through direct, organic and lifecycle channels. Customers: 96% of residential agencies have an active personal relationship with REA; 370+ Ignite integrations. Partners: 1,100+ mortgage brokers and 500+ iGUIDE cameras in market. Backed by 30+ years of relationships.
Maroon background; three horizontal bands (Consumers, Customers, Partners) each with a lifestyle photo on the left, two large white stats and brand logos on the right; red '30+ years' circle top-right; thin red network lines labelled 'Behaviour & intent signals' and 'Property & market context'.
REA connects proprietary, third-party and derived data: realEstimate and property information for 12m+ addresses, 5.3m+ owner tracks and 7.3b+ behavioural datapoints per month, feeding outputs such as likely-to-list prediction, accurate valuations, serious buyers, leads and enquiries, listing optimisation and next best actions.
Maroon background; network graph of circles connected by thin red lines; white circles for proprietary data, grey circles for third-party data (location, planning, agency outcomes), red circles for specialised intelligence; legend pills bottom-left.
Specialised intelligence (listings, location, property, lifestyle, financial services, consumer, customer signals) powers better AI outcomes: discover more possibilities, turn complexity into confidence, move from intent to action. 13% of listing views are driven via AI-powered personalisation and 1 in 4 AI conversations convert to a high value action.
Three zones: left node diagram of data domains with labelled sub-signals; centre phone screenshot; right three translucent outcome cards with red stat circles overlapping the right edge.
Ignite connects CRM systems, consumer signals and third-party communication channels into AI-powered workflows that help agents win more listings, improve campaign results and gain efficiency. 50k+ monthly active Ignite users and ~4x growth in Ignite AI Assistant use in 2 months.
Left three red input cards linked by lines to a central tall Ignite panel showing three UI snippets; right three outcome cards with red stat circles.
Video placeholder; the captured frame is an empty charcoal-to-maroon gradient with no visible content.
Full-bleed dark gradient with 'VIDEO' label bottom-left.
REA is relied on by millions every week, trusted to provide accurate insights grounded in property context, and proven to help consumers act and customers grow. Ranked #1 trusted real estate portal (Finder Customer Satisfaction Awards 2026).
Desaturated aerial suburb photo with red gradient top-left; central ring diagram (Our Edge / Our Vision) flanked by statements left, right and below; red '#1' circle top-right.
Three takeaways: property decisions require trusted, specialised vertical intelligence at scale; REA's deep relationships and proprietary data power better outcomes to lead in the AI era; REA is building the agentic platform for the industry and its AI experiences are reshaping the market.
Red-maroon gradient background; three translucent rounded cards with white line icons (house, house-in-circle, shield check) above centred white text.
Section divider for Consumer presented by Tim Bradley (Executive General Manager, Experiences and Platforms) and Jonathan Swift (Chief Product Officer).
Red gradient background; small mission subtitle above huge white 'Consumer'; two presenter photo cards bottom-right; REA Group logo bottom-left.
Almost 12m unique audience (55% of Australian adults, 4m+ more than the nearest competitor); 60.1m monthly app visits vs 11.1m for the nearest competitor (5x); 75% of time spent across residential property search portals is on realestate.com.au; +50% 3-year growth in monthly active members, who spend 5x more time on site than non-members.
Red gradient background; four white cards in a row with titles and large red figures; the app-engagement card uses a red vs grey bubble comparison with a 5x arrow.
Buying a home takes 40 weeks on average: 24 weeks searching and monitoring, 7 weeks attending inspections, 9 weeks from offer to settlement, then ~10 years owning a home. Matching product themes: smarter discovery & affordability confidence, richer property insights, confident next moves, always-on relationships.
Maroon background; translucent panel with a segmented red journey bar (stages of increasing brightness), four theme headings below, and four phone screenshots cropped at the bottom edge.
59% of conversational search users start with broad lifestyle-defined criteria rather than a single suburb; fewer than 10% of consumers looking to buy are pre-approved; 27% of consumers are estimating costs, repayments and affordability with AI.
White background with tab bar of the four journey themes (first active); headline and three large red stats left; phone screenshot right on a soft pink glow.
Demo frame of the AI Assistant: a user asks 'What is this property really worth... I've seen cheaper' and the assistant shows a 'Thinking' state. No text layer on this page; content visible only in the image.
Maroon background with journey tab bar; large rounded pastel-gradient chat canvas centred, with a white user prompt bubble and a sparkle 'Thinking' indicator.
Demonstration (current products and future pipeline) of the realestate.com.au app home: 'Start a search' bar, recent searches (Richmond VIC 3121, Buy House $800K-$900K; '3 bed home with a backyard...'), and a 'Featured in Richmond' listing with an AI sparkle button.
Dark charcoal background with red glow bottom-left; single centred phone mock-up; disclaimer 'Demonstration includes current products & future pipeline' bottom-left.
Successful buyers spend 6+ hours engaging with the listing. Experience the property via interactive floorplans, interior and exterior 3D tours and videos (iGUIDE, Immersiv); understand it via AVMs, sustainability and neighbourhood insights (PropTrack).
White background with journey tabs (second active); headline and large red '6+ hours' stat centred left; two white feature cards with partner logos; phone screenshot of a 3D tour on the right.
Demonstration of a listing page: 14 Wright Street, Richmond VIC, auction, $1,200,000, 3 bed / 2 bath / 2 car house, inspection today 10:00am, with an AI card 'Strong match for your preferences' explaining it is a classic weatherboard home 8 minutes from work; Enquire and Call buttons.
Dark charcoal background with red glow; centred phone mock-up; demo disclaimer bottom-left.
10.7m high value actions taken per month; 53% of consumers feel overwhelmed by the steps in buying a home. REA helps them take the next step (share listings, inspection bookings, enquiries, making an offer) and connect to the right person (conveyancing, mortgage broker, building & pest, utilities), which unlocks expansion TAMs.
White background with journey tabs (third active); headline and two large red stats; two white bullet cards with labels 'realestate.com.au' and 'Unlocks Expansion TAMs'; phone screenshot right.
Demonstration frame showing a phone lock screen (Friday, October 23, 9:41), the starting point for a proactive notification demo; no other content visible.
Dark charcoal background with red glow; centred phone mock-up with abstract wallpaper; demo disclaimer bottom-left.
5.3m unique properties are tracked by owners. The AI Assistant proactively guides owners on what could be done to their property (home renovations), financial options and when to refinance (Mortgage Choice broker leads), and when to sell (PropTrack seller propensity).
White background with journey tabs (fourth active); headline and large red 5.3m stat; three white cards with grey footers naming the monetisation link; phone screenshot right.
Demonstration frame identical to page 38: phone lock screen (Friday, October 23, 9:41) introducing the owner-side demo; no other content visible.
Dark charcoal background with red glow; centred phone mock-up; demo disclaimer bottom-left.
Recap of the Consumer section in three statements: #1 in property with the largest, most engaged audience; AI deepens consumer engagement at every step of the journey; the consumer relationship unlocks growth across the whole portfolio.
Three equal translucent rounded cards in a row on a deep crimson-to-maroon gradient background, each with a white line icon above centered white text; REA house icon top right.
Opens the Residential section under 'Mission #1: Reinvent Property Experiences', presented by Jonathan Cameron, Executive General Manager Residential. Lists businesses 100% owned by REA Group (realestate.com.au, Ignite, Realtair) and investments (iGUIDE).
Full-bleed red gradient; mission label and very large white 'Residential' headline top left; brand logos along the bottom left split into owned vs investments; speaker portrait card with name and title bottom right.
9 in 10 Australians searching for property choose realestate.com.au, 9 in 10 customers recommend it, and 50% of sellers track their homes on the Owners Dashboard prior to listing. Residential revenue grew at a +15% CAGR FY21-FY26 (double-digit growth), from vendor-paid revenue (pay-per-listing, depth tiers, add-ons AMAX, Luxe, iGUIDE) and customer-paid revenue (annual subscriptions, agency/agent advertising).
Three white rounded cards with red pill headers ('Demonstrated outcomes', 'Double-digit growth', 'Unique market dynamics') on a dark charcoal-to-red gradient; left card has stacked big red stats, middle card a red bar chart FY21-FY26 with rising arrow and grey +15% CAGR bubble, right card bullet lists.
Residential TAM is $3.7b, made up of $2.9b Residential Advertising (realestate.com.au) and $0.8b Customer solutions (Ignite); Residential revenue is ~35% share of TAM. Three growth drivers: grow Customer Solutions revenue via seller leads, accelerate customer efficiency with AI-powered workflows and insights, and extend the double-digit yield runway with AI-powered advertising campaigns.
Split layout: left half red gradient panel with large white $3.7b TAM figure, two translucent breakdown bars with brand logos, and ~35% share stat; right half white rounded panel with red/grey 'Residential growth drivers' heading and three drivers separated by red rules, key phrases in red.
100k+ seller leads generated in FY26. Three levers: Pro subscription with AI-powered seller insights (30%+ Pro penetration), branding add-ons via agent profiles, ratings and reviews (+15% YoY branding add-on revenue growth), and a new AI 'Likely to List' propensity model launching 2027 targeting 800k+ potential sellers on realestate.com.au.
Dark background with tab navigation (Seller leads active) at top; title left and large red circle badge with concentric rings top right; three translucent cards with red pill headers, each containing a product UI mockup (Ignite seller propensity score 9/10, Pippin&Hall agent profile with 5.0 rating, Likely to List score 92 'Very high') and a big white stat at bottom.
Opening frame of a product demonstration video showing an iPhone lock screen reading Friday, October 23, 9:41; caption notes the demonstration includes current products and future pipeline.
Centered iPhone mockup on a dark charcoal background with red gradient in the bottom-left corner; small disclaimer caption bottom left; REA house icon top right.
Ignite web app inbox listing buyer and seller enquiries for properties (e.g. 4/310 Lethbridge Street, St Kilda); the selected enquiry shows contact details, the request, a Buyer enquiry score of 8 and an 'Enquirer's buy readiness' scale (Low / Needs nurturing / Looks ready), with an 'Ask AI' button.
Large rounded browser-style app screenshot centered on a dark background; left nav rail, middle enquiry list with filter chips, right detail pane; demo disclaimer bottom left.
Ignite 'Lead Intelligence' screen where agents select addresses from their CRM or upload a CSV to get likelihood-to-list insights; a table shows two VaultRE CRM imports (1,094 and 3,342 addresses, Aug 2026) with a red 'Generate address list' button.
Centered white app screenshot with left nav (Insights active) on dark background with red corner gradient; two radio-option cards and a data table.
95% of agencies use Ignite. Ignite AI supports four workflow stages: engage seller leads (Pro), nurture and convert sellers (Pro & Realtair), market the property (new depth & add-on value), and nurture buyers and transact (depth & subscriptions). An AI assistant drives outcomes end-to-end across App, APIs and Agentic (Next).
Tab bar (AI-powered workflows active); headline with 95% red circle badge top right; four-step red chevron process band with white product labels; below each step a description and AI chat-style UI snippet (warming seller leads, generating property report, Luxe upgrade for $900, new top offer $1,289,000); white footer bar with App/APIs/Agentic pills.
Ignite 'Pitch' (powered by Realtair) prospecting screen showing draft vendor proposals for 14 Wright Street and 24 Ablett Parade, Richmond, filtered by agent Julia Bianchi, agency Pippen&Hall and proposal template.
Centered white app screenshot on dark background; left nav (Prospecting active); filter dropdowns and two property proposal cards with house photos and blue agency header.
Ignite listing performance view for 14 Wright Street, Richmond (Premiere listing, auction 29 Aug): campaign highlights for 13-19 Aug 2026 show 34,675 campaign exposure, 1,243 listing views, 8 enquiries and 4 inspection actions, with Download PDF, Shareable report and Ask AI options.
Centered app screenshot with hero photo banner of the house and listing metadata, tab row, and four KPI tiles; dark background with red corner gradient.
Mobile demo frame showing the Ignite app splash screen with the red Ignite rocket-house logo; caption notes the demonstration includes current products and future pipeline.
Centered white phone mockup with red logo on a dark charcoal background, red gradient bottom left.
Timeline of advertising evolution: 2000s digitised listings via customer-paid subscriptions; 2010s shift to vendor-paid depth tiers as consumers moved to mobile; early 2020s Premiere+ adoption; now depth and add-on packages; FY28+ (Next) driving yield with AI-powered advertising campaigns. Delivered +14% 10-year yield CAGR.
Tab bar (AI-powered advertising active); horizontal red timeline with dots and text below each era, final 'Next' FY28+ highlighted in a translucent card; bottom left huge '+14%' stat; bottom right four phone mockups labeled Premiere+, Luxe, Audience Maximiser and iGUIDE.
Four AI pipeline pillars: new AI surface areas (AI search) to drive exposure for depth customers; differentiated listings with immersive media and AI-enriched data; optimised campaigns via the Ignite AI Assistant; and proven, attributable outcomes nurturing buyers to conversion. Framed as an opportunity to grow the marketing schedule and REA's share.
Four translucent cards in a row on a crimson background, each topped with a product UI snippet (AI search results, 3D immersive tour with floorplan, AI-scored listing photos, campaign performance: 24 days to sell, 8 serious buyers, 3 offers), bold title and description; bottom tagline flanked by white rules.
realestate.com.au consumer app home screen showing 'Start a search', recent searches (Richmond VIC 3121 $800K-$900K; a natural-language '3 bed home with a backyard...' search), a 'Featured in Richmond' Pippin&Hall listing and a sparkle AI assistant button.
Centered phone mockup on dark background with red gradient bottom left; demo disclaimer caption.
Ignite listing performance for 14 Wright Street, Richmond (66,399 campaign exposure, 2,526 listing views, 12 enquiries, 9 inspection actions) with the Ignite AI Assistant panel open ('How can I help, Julia?') offering prompts to optimise performance, research comparables and draft vendor talking points.
Centered wide app screenshot: left nav, listing hero and KPI tiles in the main pane, AI assistant side panel on the right with suggested-prompt buttons grouped by category.
REA advertising cost is only 0.22% of the average property value in FY26. A stacked value chart shows Depth, Customer solutions, Add-ons and New AI value layering from today to the future along a double-digit yield line; depth and add-ons (depth tiers, Luxe, Immersive, Audience Maximiser, new AI experience value) grow vendor revenue, while customer solutions (Pro, Realtair, Ignite, AI-powered products, Ignite AI Assistant) grow subscription revenue.
Left white card with conceptual layered horizontal bar chart (Today vs Future, dashed divider) and red diagonal 'Double-digit yield' arrow, overlapped by a large red 0.22% circle badge; right dark translucent panel with two sub-cards listing product pills.
Recaps the three Residential growth drivers: grow Customer Solutions revenue by delivering seller leads, accelerate customer efficiency with AI-powered workflows and insights, and extend the double-digit yield runway with AI-powered advertising campaigns.
Three translucent rounded cards with line icons (trend line, bar chart, gauge) and centered white text on a maroon-to-red gradient.
First Q&A panel with Cameron McIntyre (CEO), Andrew Cramer (CFO), Jane Cohen (Chief Strategy Officer), Jonathan Swift (Chief Product Officer), Tim Bradley (EGM) and Jonathan Cameron (EGM).
Red gradient background; large white 'Q&A Panel #1' title top left; six cut-out headshots in translucent frames in a row with names and titles beneath; REA Group logo bottom left.
Agenda repeat marking progress: completed sessions (Welcome, Strategy & Investor Proposition, Our Edge, Consumer, Residential, Q&A #1) are greyed, followed by a Break, then highlighted upcoming sessions New Homes (Jarrod Scott), Commercial (Kris Matthews), Financial Services (Anthony Waldron), Global Businesses (Cameron McIntyre, Eamonn Fallon), People & Technology (Steve Maidment, Elisa Nerone), Finance (Andrew Cramer), Q&A #2 and Lunch.
Dark background with red bottom-left glow; full-width table-like list with thin rules, session names left and presenters right-aligned; red 'Break' and 'Lunch' pills on red divider lines; past items dimmed.
Opens New Homes under 'Mission #2: Scale Our Growth Engines', presented by Jarrod Scott, Executive General Manager New Homes. Owned: realestate.com.au, Ignite; investments: Immersiv, iGUIDE.
Red gradient full-bleed; mission label and huge white 'New Homes' title; logo strip bottom left; speaker portrait card bottom right.
realestate.com.au has a 1.8x larger new build audience than the nearest portal competitor, is 3x more preferred by customers, and is used by the top 20 home builders and top 20 residential developers. New Homes revenue grew at a +2% CAGR FY21-FY26 despite new build commencements declining at -1% 5y CAGR (~199k commencements in FY26); ~1 in 3 transactions are new homes. Developers (apartments, land focus) and builders (volume builder emerging focus) offer growth in houses, townhouses, retirement living, build to rent and boutique builders.
Three white cards with red pill headers on a maroon gradient: left stacked stats, middle combo chart (red revenue bars with black declining commencements line and +2% CAGR bubble), right two-column developer/builder segment grid with red and pink pills; large red '~1 in 3' circle badge overlapping bottom right.
70%+ of potential buyers would consider both a new or established property, and 5% of overall engagement on realestate.com.au is in new homes. REA's network of assets spans core consumer offerings (realestate.com.au, Mortgage Choice), immersive visualisation (Immersiv, iGUIDE), data and insights (PropTrack, neighbourlytics) and development funding (Simplicity).
Left: overlapping white-outline Venn circles labeled 'Existing home only' and 'New home only' with dark overlap holding the 70%+ stat and a red 5% circle badge; right: white card listing asset categories with brand logos separated by rules.
New Homes TAM is $1b: $900m New Homes Advertising (realestate.com.au) and $100m Customer solutions (Ignite); New Homes revenue is ~13% share of TAM. Growth drivers: improve lead quality and volume by driving trust and confidence to buy new, drive growth of advertising solutions by expanding the product suite, and unlock new revenue with value beyond advertising.
Split layout mirroring the Residential drivers slide: red gradient left panel with big TAM, two breakdown bars with logos and share stat; white right panel with red heading and three drivers divided by red rules.
The New Homes buying journey takes ~2 years and involves 100+ decisions of consequence, across stages: monitor the market (6 months), refine and compare (6 months), attend displays and showrooms (4 months), customise and reserve (3 months), settle (1-2+ years), owning. REA addresses it with educating (Consumer AI Assistant, document downloads), content generation (home designs, virtual tours) and driving trust (project updates, credentials).
Tab bar (Lead quality and volume active); headline; translucent panel with a journey chevron band shading from dark to light red; three columns of paired app screenshots (AI map search, Juniper brochure, home designs from $320,000, virtual tour, project updates, developer credentials) with labeled icons beneath.
realestate.com.au app project profile for 'Juniper', a new development at 123 Sun Street, St Kilda VIC 3130, under construction (70% complete), with hero rendering of a timber-clad apartment tower and video, 3D and +12 image thumbnails.
Centered phone mockup with green branded header on a dark background, red gradient bottom left; demo disclaimer caption.
Immersive 3D aerial view of a land estate masterplan with lots, streets and display homes, with control buttons and panels for Explore (Masterplan Aerial), Amenities and Sales Info (293 lots).
Wide rounded-corner rendered image filling most of the slide on a dark background; overlay toolbar top left and info tabs bottom left; demo disclaimer caption.
Immersive experiences inspire buyers online, make the future tangible before the visit, turn the sales office into a natural next step and deliver differentiated, personalised service. Image shows a couple in a sales lounge viewing a large screen with an aerial lot view, floor plan overlay and home designs matching Lot 12 (from $297,000).
Left translucent text card with headline and four bullets; right large lifestyle photograph of a display-suite lounge with a wall screen showing the immersive tool; dark background with red gradient.
One Project Profile offers multiple campaign levers: Now - on-REA amplification, audience prime, off-REA extension; Next - more prominence in search, AI-powered optimisation, campaign intelligence; Future - premium listing experience and buyer nurturing.
Hub-and-spoke: central red circle with headline and Juniper phone mockup; four translucent lever cards on each side connected by red lines, each with icon, title, description and a red Now/Next/Future tag; tab bar (Expand advertising suite active).
Data and AI capability that drives development decisions from concept to completion: data and insights for pipeline and product-market fit, development funding, showroom and display home experiences connected with deposit and contracting, and financing solutions for settlement and handover. A FUTURE Ignite 'Project Pulse' mockup for Como Residences, Richmond shows 72% project strength, site plan and buyer trends (64% of interested buyers; 35-44 largest age segment).
Tab bar (Value beyond advertising active); left translucent card with headline and four bold-lead bullets; right Ignite dashboard screenshot with red 'FUTURE' tag; bottom white logo strip 'Powered by our differentiated data and content' (realestate.com.au, PropTrack, neighbourlytics, Simplicity, Mortgage Choice, Immersiv).
Recap: leading New Homes platform in a market that needs better data and demand insights; a natural adjacency leveraging core audiences with AI and demand solutions; growth paths built on lead quality, moving beyond listings and driving value beyond the campaign.
Three translucent cards with line icons and centered white text on a maroon-to-red gradient.
Opens Commercial under 'Mission #2: Scale Our Growth Engines', presented by Kris Matthews, Executive General Manager Commercial and Property Data. Owned: realcommercial.com.au, Ignite, neighbourlytics; investments: Arealytics, iGUIDE.
Full-bleed royal blue gradient (section colour shift from red to blue); huge white 'Commercial' title; logo strip bottom left; speaker portrait card bottom right.
realcommercial.com.au has a 2.5x unique audience lead, #1 customer rating on ROI, and 83% of customers prefer it. Commercial revenue grew at a +15% CAGR FY21-FY26. The portfolio is diversified across retail, industrial, office and mixed-use and others (medical, hotel, education), with sale and lease revenue streams.
Three white cards with blue pill headers on a navy-blue gradient: stacked blue stats, blue bar chart with trend arrow and +15% CAGR bubble, and a four-quadrant photo circle of sub-segments with Sale/Lease light-blue buttons.
Paired bar comparisons (blue = realcommercial.com.au, red = realestate.com.au) show Commercial lagging Residential on digitisation of marketing (% of ad spend on digital channels), premium depth advertising (RCA Elite+ vs Resi Premiere+ buy) and digitisation of agent workflows (% of agencies using Ignite every month), indicating headroom. No numeric values are shown.
Three white cards on a blue gradient, each with a two-bar unlabeled column comparison (blue shorter, red taller); brand legend logos at bottom left.
Commercial TAM is $350m: $300m Commercial Advertising (realcommercial.com.au) and $50m Agent solutions (Ignite, Arealytics); Commercial revenue is ~30% share of TAM. Drivers: deliver more, high-quality leads with industry-leading consumer experiences; drive yield via advertising and workflow value; strengthen customer and consumer value with proprietary data.
Split layout: blue gradient left panel with TAM figure, breakdown bars with logos and share stat; white right panel with blue heading and three drivers separated by blue rules.
Commercial journey: early research (11 weeks), searching (9 weeks), property evaluation (4 weeks), enquiry (3 weeks), offers (4 weeks), owning. Features: unique data and insights (Next), Consumer AI Assistant (Future), iGUIDE immersive visualisation (Live) and Document Downloads (Live); listings with Document Downloads get +46% enquiries.
Tab bar (More, high-quality leads active); blue chevron journey band shading dark-to-light; four columns with feature titles and white UI cards (suburb heatmap, AI 'Where should we start?' prompt, 360 tour images, locked documents) tagged Next/Future/Live; blue +46% circle badge bottom right.
realcommercial.com.au app showing 147 lease results for Surry Hills, NSW, featuring 'Premium office in the heart of Surry Hills' at Nicholas Building, 31-34 Lennox Street (200-250 m2, 10 car spaces, offices, contact agent for price) and an AI sparkle button.
Centered phone mockup on a blue gradient background; demo disclaimer caption bottom left.
Three levers: drive premium depth penetration with Elite+ and new multi-space listings (25% of Elite+ lease listings advertise multiple spaces); drive add-on penetration with AMAX (Audience Maximiser) optimised by REA data (+30% YoY RCA AMAX revenue growth); grow subscriptions with AI-powered Ignite workflow solutions.
Tab bar (Advertising and workflow value active); three translucent blue cards with blue pill headers: multi-space listing mockup (130 Collins Street), phone with Facebook ad surrounded by publisher logos (Nine, Yahoo, Carsales, 7News, Instagram, Fox Sports etc.), Ignite commercial listings view with Ask AI; large stats at bottom.
Future products: deeper subscription insights for customers (buyer signals, ownership and occupancy data, comparables, price and yield insights) and enriched leads through logged-in consumer experiences (property and location insights, sale and lease rates, yield rates). Mockups show map transactions (1,758 sales, 901K median sold price) and commercial data insights powered by Arealytics (271 transactions, $250/m2 yield).
Tab bar (Proprietary data active); two translucent blue text panels each paired with a phone mockup tagged 'Future'; bottom white logo strip of data assets (realcommercial.com.au, PropTrack, neighbourlytics, Simplicity, iGUIDE, Arealytics).
Recap: #1 Commercial platform with a track record of strong growth in a diverse market; applying the proven Residential playbook to unlock growth; driving growth via new customer and consumer value strengthened by proprietary data.
Three translucent cards with line icons and centered white text on a navy-blue gradient.
Opens Financial Services under 'Mission #2: Scale Our Growth Engines', presented by Anthony Waldron, CEO Financial Services. Owned: Mortgage Choice, Campaign Agent, PropTrack; investments: Simplicity, Athena, Simpology.
Full-bleed dark teal gradient (section colour shift); two-line huge white 'Financial Services' title; logo strip bottom left; speaker portrait card bottom right.
Financial Services delivered $148m FY26 revenue (+11% YoY), $58m FY26 EBITDA (+12% YoY) and +13% FY26 settlements growth, with revenue growing at a +12% CAGR from FY22 to FY26. The portfolio spans buyers (Mortgage Choice residential brokerage, Athena non-bank lender 19.9% stake, Simplicity commercial brokerage), vendors (CampaignAgent campaign finance), brokers (Simpology loan origination platform, 33% stake) and lenders (PropTrack data & valuations).
Dark teal gradient background with two white rounded cards under teal pill headers: left card pairs three stacked KPIs with a FY22-FY26 teal bar chart and a +12% CAGR bubble on a trend arrow; right card lists portfolio brands with logos grouped by customer type.
Three columns explain the two-way value between REA's portals (realestate.com.au, realcommercial.com.au) and its finance businesses: for consumers, earlier access to Australia's largest property audience and greater financial confidence; for customers & brokers, quality leads, customer synergies (e.g. project funding) and greater value for shared partners; for data insights, comprehensive property data with propensity signalling combined with deep behavioural consumer and member insights.
Three translucent teal panels (Consumers, Customers & brokers, Data insights), each holding two white cards (portal logos on top, finance brand logos below) connected by up and down gradient arrows.
Financial Services addresses a $1.7b TAM: $850m residential mortgage broking, $400m commercial loan commissions, $200m data & valuations and $250m campaign finance; REA's Financial Services revenue is ~9% of that TAM. Four growth drivers: grow REA-sourced leads and the Mortgage Choice brand, build consumer confidence to transact, accelerate broker efficiency with AI tooling, and create value beyond mortgages with Simplicity, PropTrack and CampaignAgent.
Split layout: left dark-teal half with a large $1.7b headline, four translucent TAM bars each tagged with brand logos, and a ~9% share stat; right large white rounded panel with the title and four drivers separated by teal rules, key phrases highlighted in teal.
realestate.com.au leads to Mortgage Choice grew +27% YoY and realestate.com.au-sourced settlements grew +31% YoY in FY26. Charts show the REA share of leads rising FY24-FY26 and settlements from REA leads growing each year; phone mockups show 'Now' (a listing page for 34 Penguin Parade, Richmond at $850,000-$895,000 with a Finance section saying 'This property is in budget' and an 'Explore borrowing power' button) and 'Next' (an AI affordability chat estimating borrowing power of $840,000-$975,000 and comfortable repayments of $3,400-$4,500).
Tab bar across the top (REA-sourced leads active of four drivers); two large KPI stats; white card with a stacked bar chart (REA vs Non-REA leads) and a teal bar chart (settlements); grey panel on the right with two phone screenshots labelled Now and Next.
The Move Modeller tool makes the buy-or-sell-first decision clearer for homeowners, giving them confidence to move while creating more leads for brokers. The phone screenshot shows a 'My Property' page for 14 Wright Street with tabs (Property details, Market value, Finance), a 'Buy or sell first?' prompt, a 'Try restyling' house photo, a realEstimate of $1,345,000 (high confidence, +$45,000 since last sold) and a 'Get a free market appraisal' button.
Teal gradient background with the four-tab strip (Confidence to transact active); headline and body copy on the left, a single large phone mockup centred-right; footnote 'Demonstration includes current products & future pipeline' bottom-left.
REA is building AI co-workers across broker workflows to automate high-effort, repetitive tasks. Metrics: 15 live AI agents, 70%+ of Mortgage Choice brokers using AI tools, and 30% time saved per loan application. The wheel covers eight workflow stages: Client Retention, Marketing & Lead Gen, Nurture Leads & Clients, Client Meetings, Quick Qualify, Product Policy & Search, Client Data Verification, Submit & Settle.
Dark background with tab strip (Broker efficiency active); intro text left, a central eight-segment teal wheel with icons around a white 'Broker Co-worker' hub, and three stacked large stats on the right.
Three businesses' data points are connected for the first time: client context from Mortgage Choice (example client Sarah Williams, existing loan $880K at 6.4%, repayments $5.5K/mo, rate competitiveness score 6), property valuation and insights from PropTrack (property value $1.52M, last sold 2018 $920K, propensity to refinance score 3), and signals and intent from realestate.com.au (mid sell stage, seller propensity score 8, buyer enquiry score 9). 52% of Mortgage Choice clients are active on REA.
Teal background with tab strip (Broker efficiency active); translucent panel containing three pill headers with descriptions and three white data cards linked by thin connector lines; large teal circle callout top-right with the 52% stat; caption bar at the bottom.
The Client Retention Agent improves broker efficiency with timely insights and prompts. Client value: move confidently with the right support at the right time and access sharper rates; broker value: retain more clients and grow the loan book and trail revenue. The mockup 'Actionable Intelligence' card for client Sarah Williams flags 'Buy and sell ready', '$600K in estimated equity' and 'Likely upsizing from current property'.
Teal background with tab strip; translucent panel with bulleted client and broker value text on the left and a white 'Actionable Intelligence' UI card on the right with three green checkmarked rows; 'Client Retention Agent' pill badge top-right; logo row (realestate.com.au, PropTrack, Mortgage Choice) at the bottom.
Three adjacent services: Simplicity commercial broking (large fast-growing market, less tied to the residential cycle; revenue +21% CAGR FY24-FY26), CampaignAgent vendor marketing finance (leading campaign finance player, lending margin on every funded loan, tied to listings not interest rates; +22% CAGR), and PropTrack data & valuations (embedded with major lenders, growth beyond lenders; 0% CAGR).
Three white rounded cards with teal pill headers and brand logos, each with three checkmark bullets and a FY24-FY26 teal bar chart with a CAGR bubble on a trend arrow; tab strip (Value beyond mortgages active).
Three takeaways: four years of double-digit compound EBITDA growth backed by a diversified portfolio; Financial Services extends REA's reach across the property journey; growth headroom across leads, AI-enabled brokers and adjacent services.
Dark teal gradient background with three equal translucent rounded cards, each topped by a white line icon (trend line, stacked lines, sparkle) and centred white text.
Section divider for Mission #2: Scale Our Growth Engines, covering investments in realtor.com, iGUIDE and Distilled. Presenters: Cameron McIntyre (CEO, REA Group) and Eamonn Fallon (CEO, Distilled).
Navy-to-slate gradient background with oversized white title on the left, mission label above, 'Investments in' logo row bottom-left, and two speaker headshot cards with names and titles bottom-right.
iGUIDE is a Canada-based camera and software platform using AI for 3D virtual tours, floorplans and measurements; its Australia rollout has 500+ cameras in market and it features in 25% of homes sold in Canada. realtor.com is a leading US marketplace scaling AI-first experiences (RealAssist conversation tool) with a 33% share of total visits to US real estate portals. Realtor is accelerating iGUIDE's penetration of a $0.6b North America TAM by improving the portal experience, leveraging agent relationships and surfacing virtual tour insights on Realtor's agent platform.
Navy background with tab strip (iGUIDE and Realtor active); North America map on the left with Canada in light blue (iGUIDE) and US in pink (realtor.com); two white cards with logos and bullets on the right; dark navy synergy panel below with three translucent boxes.
Sub-section cover introducing Distilled, the Irish online marketplace operator, branded with the REA Group logo. There is no text content beyond the Distilled wordmark.
Full-bleed photo of Dublin's Ha'penny Bridge over the River Liffey with a navy overlay; large white 'distilled.' wordmark mid-left and the REA Group logo bottom-left.
Distilled generated ~A$120m FY26 revenue and ~A$70m FY26 adjusted EBITDA, with a +21% 5-year adjusted EBITDA CAGR (FY2021-FY2026), and is a Great Place to Work Best Workplaces Ireland 2026. Five investment reasons: #1 portal in each market/category, strong market fundamentals, demonstrated growth with significant future potential, opportunity to accelerate with REA capabilities, and strong strategic and cultural alignment. The footnote notes the agreement to acquire a 35% interest is subject to regulatory approvals.
Navy background with tab strip (Distilled active); dark navy KPI band across the top with three stats separated by dividers and a Best Workplaces badge; five numbered translucent cards in a row below.
Distilled holds #1 positions in real estate portals, motors portals and horizontal marketplaces, with ~$120m FY26 revenue (EUR 72.4m converted at 1.65 AUD per EUR); the revenue donut shows segments of 60% (red, connected to motors), 34% (blue, connected to real estate) and 5% (orange, horizontal marketplace). On web and app monthly visits per population, daft.ie scores 1.5 and PropertyPal 1.4 versus realestate.com.au at 2.3 and global peers at 0.9-1.2; DoneDeal scores 0.8 and Used Cars NI 0.4 versus motors peers at 0.3-0.7. Adverts is the #1 horizontal marketplace.
Navy background with a central donut chart (red, blue and orange segments) showing ~$120m revenue mix, flanked by two white cards with vertical bar charts comparing Distilled brands (coloured) against grey global peers; '#1' labels above each side and below the donut.
daft.ie earns revenue from residential (~1.2k agent subscriptions, vendor-paid depth listing tiers and upsell products), new homes developers and other data and mortgage products. Its average cost to advertise is 0.05% of sale price versus 0.22% on realestate.com.au. Growth drivers: increase penetration of vendor-paid Advantage Ads, drive residential yield by delivering more value to customers, and drive New Homes volume and yield with innovation.
Navy background with three white cards: revenue sources list, a two-bar comparison chart (blue daft.ie vs red realestate.com.au), and three numbered growth drivers in circled numerals; daft.ie logo in the title.
Since 2023, Advantage Ads deliver +6x visibility (GOLD vs standard listings), +37% enquiries and +2.6% sale price (all Advantage Ads vs standard). Advantage adoption rose from 8% in Q4 FY24 to 24% in Q4 FY26, with an arrow pointing to realestate.com.au as the penetration benchmark.
Navy background with two white cards: left shows a sample listing screenshot (Habitat agency row of brick houses) above tier labels GOLD, SILVER, BRONZE, Standard beside three large blue stats; right shows a two-bar adoption chart with a red curved arrow toward the realestate.com.au logo.
Ireland compares favourably with Australia: population CAGR 2020-25 of 1.3% vs 0.9%, real Gross National Income CAGR 2019-24 of 5.1% vs 2.8%. Average annual housing turnover 2020-25 is ~3% in Ireland vs ~5% in Australia, indicating listing volume upside.
Navy background with one wide white card divided into three columns, each a paired bar chart (blue Ireland vs grey Australia) with flag icons below the bars.
DoneDeal has three revenue sources: Dealer Motor (~2.4k car, motor and agri dealers on slots-based monthly subscriptions plus visibility and upgrade packages), Private Motor (fee per private listing) and Other (finance, media, other marketplace and data products). Its dealer revenue is ~3% of dealer gross profits versus ~7-8% and ~8-10% for two global peers. Growth drivers: drive yield, increase upgrade penetration, expand revenue pools through adjacent services.
Navy background with three white cards: revenue source list, a three-bar chart (red DoneDeal vs grey peers), and three circled-number growth drivers; DoneDeal wordmark in the title.
REA will support its global businesses through four capabilities: shared product development and assets; pricing, packaging and GTM expertise; shared global and agentic delivery capability; and cross-market management expertise. The logo strip lists realtor.com, iGUIDE, daft.ie, PropertyPal, DoneDeal, Used Cars NI and Adverts.
Navy gradient background with four equal translucent cards each topped by a white line icon, and a full-width white logo strip beneath.
Section divider for Mission #3: Accelerate The Organisation. Presenters: Elisa Nerone (Chief People & Sustainability Officer) and Steve Maidment (Chief Technology Officer).
Solid crimson gradient background with oversized white title left, mission label above, REA Group logo bottom-left and two speaker headshot cards bottom-right.
A timeline of 'leading through change' from the 2000s to now: scaling an entrepreneurial start-up culture, leading in agile ways of working, launching the first REA Hackdays (now #45), moving to cloud-first infrastructure, first recognition as a 'Great Place to Work', adopting decentralised delivery structures, scaling global centres of excellence, and launching the FlowLab innovation hub.
Dark burgundy-to-red background with a horizontal red timeline (2000s, 2010s, Early 2020s, Now) and eight translucent milestone cards alternating above and below via vertical connectors; 'Our next move' logo top-right.
REA reports a top-quartile employee engagement score, 91% of staff confident in recognising opportunities to use AI, '#1 Choice for talent' with Great Place to Work Best Workplaces badges (Australia 2025, in Technology 2025, for Women 2026), and ~1,900 employees with access to a global talent pool via REA Cyber City (India), Global Business Solutions and iGUIDE in Canada.
Red background with a dark rounded panel on the left holding two stats, a red '#1 Choice for talent' pill and three award badges; right side shows a world map highlighting India, Australia and Canada with location labels and a red ~1,900 employees circle.
REA frames AI in three zones: Zone 1 AI in our products (value through AI-enabled products and services), Zone 2 AI to ship products (accelerating design, build and delivery, anchored by FlowLab), and Zone 3 AI to run the business (organisational productivity and operating leverage). These sit on a control plane of AI system, cost optimisation, learning loops and cybersecurity, plus a portfolio of partners.
Red gradient background with three zone panels, the centre Zone 2 card raised in white with the FlowLab logo; two dark maroon full-width bars below for the control plane and the partner portfolio.
Zone 2 changes three stages of delivery: product design moves from long discovery programs to rapidly validated prototypes with AI (fast-follow); software delivery from human-written code to agentic-first, human-supervised coding (in-flight); value delivery from few, large releases to always-on go-to-market with an AI-enabled sales team (fast-follow).
Dark red background with three chevron headers (Product Design, Software Delivery, Value Delivery) above three cards split red top (FROM) and white bottom (TO) with sparkle icons and status pills (Fast-follow, In-flight, Fast-follow).
A maturity path from traditional tools (1x productivity) through AI-assisted individuals (2024), AI-accelerated teams (2025), agentic-first delivery (2026+, scaling) and autonomous agent orchestration (currently experimenting), targeting 5-10x productivity. Agentic-first delivery showed 2.6x acceleration proven in a trial with one agentic squad.
Red background with a horizontal gradient arrow labelled 'Increasing Agentic utilisation' from 1x to 5-10x, a red 2.6x circle callout, and five white stage cards with people/robot icons joined by plus signs; the last two cards sit in highlighted red frames labelled Scaling and Currently experimenting.
Cumulative agentic-first squads onboarded rise from Q4 FY26 through the FY27 quarters to an FY27 target of ~20% of squads, with a larger FY28+ opportunity and a 2-3x squad acceleration ambition. Released capacity is reinvested into enterprise missions: reinvent property experiences (Residential) and scale growth engines (New Homes, Financial Services, Commercial, New markets).
Red background with a white card holding a red bar chart (Q4 FY26 to FY28+) and annotations, a red 2-3x circle callout overlapping the card edge, and a dark maroon panel on the right listing missions with coloured pills.
Three takeaways: a culture of innovation, navigating change and reinventing how REA works; three AI value zones accelerating innovation from products to delivery and operations; and scaling agentic-first delivery to unlock capacity to reinvest in growth.
Dark maroon-to-red gradient background with three equal translucent rounded cards, each with a white line icon and centred white text.
Section divider for the Finance section presented by Andrew Cramer, Chief Financial Officer.
Crimson gradient background with a large white 'Finance' title top-left, REA Group logo bottom-left and a single speaker headshot card bottom-right.
10+ years of double-digit growth: revenue (continuing operations) rose from $566m in FY16 to $1,730m in FY26 (+12% CAGR); core EBITDA from $341m to $1,121m (+13% CAGR); core NPAT from $208m to $682m (+13% CAGR). EBITDA margin expanded from 60% to 65%.
Dark red background with three white cards, each a two-bar FY16 vs FY26 red chart with a grey CAGR bubble and bracket arrow; a dark band below shows the 60% to 65% EBITDA margin change.
National buy listings swing year on year (e.g. -8% during the Banking Royal Commission, -11% around COVID, +15% and +11% in the rebound, -13% in the interest rate cycle, then +7%, +1%, 0%), but volumes have been broadly flat over the last 10 years from FY16 to FY26.
Dark red background with two white cards: left a red line chart of YoY change with labelled data points and event annotations; right a dark red bar chart of listing volumes FY16-FY26 with a dashed average line and pink band.
Residential revenue grew at a +13% CAGR FY16-FY26, driven by +14% Residential Buy 10-year yield CAGR. FY21-FY26 Residential revenue growth came from price to value (50%), penetration & product mix (28%), add-ons, subs & other (22%) and listings & geo-mix (0%). Runway remains: advertising on REA costs only 0.22% of the average sale price and 43% of the marketing schedule.
Dark red background with three white cards: a red bar chart FY16-FY26 with trend arrow and CAGR bubble; a red-shaded pie chart of growth sources with a 0% bar beneath; and two large red stats for runway.
Commercial revenue grew from $53m (FY21) to $106m (FY26), +15% CAGR; New Homes from $119m (FY21) to $132m (FY26), +2% CAGR; Financial Services (incl. CampaignAgent) from $95m (FY22) to $148m (FY26), +12% CAGR.
Dark background with three white cards under coloured pill headers (blue Commercial, red New Homes, teal Financial Services), each a two-bar chart in the matching colour with a CAGR bubble and bracket arrow.
Australia core revenue and cost growth lines track each other from FY16 to FY26, with cost cut in downturns (e.g. -9% in FY20) and FY26 revenue +11% vs cost +7%. FY26 Australia opex is 61% labour, 14% marketing, 9% tech, 9% other and 7% COGS. Productivity levers: centres of excellence (Global Business Solutions, REA Cyber City), scale (News Corp tech & marketing) and AI capability (FlowLab, Zone 3 AI for the business).
Dark red background; left white card with a dual-line chart (navy revenue, red cost) with data labels; grey card with a single stacked opex bar; right translucent panel with three dark rows ending in red chevron labels.
From FY16 to FY26, free cash flow (continuing operations) grew from $185m to $676m, Australia capex (excl. fit-outs) from $36m to $131m, and dividends per share from 82ct to 297ct, each +14% CAGR. Operating cash conversion held at 95%, capex/revenue moved from 6% to 8%, and dividends rose from $107m to $390m.
Red background with three white cards of FY16 vs FY26 red bar pairs with CAGR bubbles, each sitting on a dark maroon band showing a before-to-after metric with an arrow.
FY27 guidance: new buy listings down low single digits; low double-digit controllable residential buy yield growth; target operational margin expansion; Group & Australia costs to increase mid-single digits (excl. M&A); Group costs to increase by mid to high single digits (incl. M&A); losses from associates expected to improve in FY27 vs FY26.
Red gradient background with title top-left and six full-width translucent rounded rows, each led by a large numeral.
Through-the-cycle targets by pillar: Growth (scale and capture value across growth engines; double-digit controllable yield growth) targets double-digit revenue growth; Earnings (cost flexibility; operating margin expansion) targets double-digit EBITDA growth; Capital management (fully franked dividends with flexibility for additional returns; strong free cash flow growth and capex 7-9% of revenue) aims to maximise long-term shareholder returns.
Dark red background with three horizontal rows: red chevron label block, white two-column text area, and grey end block with red target text; a red frame labelled 'Through-the-cycle targets' encloses the right half.
Three takeaways: track record of strong financial results through all market conditions; highly cash-generative earnings funding investment and shareholder returns; and double-digit revenue and EBITDA through-the-cycle guidance reaffirmed.
Maroon-to-red gradient background with three equal translucent rounded cards, each with a white line icon and centred white text.
Second Q&A panel featuring nine executives: Cameron McIntyre (CEO), Andrew Cramer (CFO), Anthony Waldron (CEO Financial Services), Eamonn Fallon (CEO Distilled), Elisa Nerone (Chief People & Sustainability Officer), Jarrod Scott (EGM New Homes), Jonathan Swift (Chief Product Officer), Kris Matthews (EGM Commercial and Property Data) and Steve Maidment (CTO).
Crimson gradient background with a large 'Q&A Panel #2' title and a two-row grid of nine headshot cards (five on top, four below) with names and titles beneath.
Four-point investor proposition: #1 with clear value runway to grow the core Residential business; a portfolio of growth engines with well-defined plans to capture value; a proven innovator with a unique edge (relationships, data and outcomes) to lead in the AI era; and strong cash generation and balance sheet to fund growth.
Full-bleed aerial suburb photo under a maroon-to-red overlay; small 'Investor proposition' label above a large title; four numbered translucent cards in a row.
Closing back page showing only the REA Group logo; no other content.
Red-to-maroon gradient background with the centred REA Group logo (red circle house icon and white wordmark).
Распространенные вопросы об этом слайде и основном содержании презентации.
REA Group, the company behind realestate.com.au, presented this deck at its 2026 Investor Day and lodged it with the ASX (Australian Securities Exchange) on 22 October 2026. Across 122 pages, it covers strategy, consumer and Residential products, the New Homes, Commercial, Financial Services and Global growth engines, People & Technology, and the Finance section with the FY27 outlook.
The Finance section reports FY26 revenue of $1,730m from continuing operations, a +12% CAGR since FY16. Core EBITDA was $1,121m at a 65% margin, core NPAT was $682m, and free cash flow was $676m. Dividends per share reached 297 cents, up from 82 cents in FY16. All figures are in Australian dollars.
REA Group's financial year runs from July to June, so FY26 covers July 2025 to June 2026 and the FY27 outlook in the deck covers July 2026 to June 2027.
For FY27, REA expects new Buy listings to fall by a low single-digit percentage and controllable Residential Buy yield to grow at a low double-digit rate. It also targets operating margin expansion and expects Group costs to rise by mid-to-high single digits including M&A. Its through-the-cycle aspirations are double-digit revenue growth, double-digit EBITDA growth, and capex of 7-9% of revenue.
The deck names four levers. The first is depth advertising value from new AI surfaces and optimised campaigns. The second is customer productivity, through products such as the Likely to List seller-propensity model. The third is AI productivity from agentic-first squads, which trialled at 2.6x acceleration. The fourth is new addressable markets reached through consumer AI assistants, such as conveyancing, connections and home services.
The domestic growth engines are New Homes ($132m FY26 revenue), Commercial ($106m) and Financial Services ($148m, including Mortgage Choice, PropTrack, Simplicity and CampaignAgent). Globally, the deck covers iGUIDE and the US portal Realtor, plus Distilled in Ireland and Northern Ireland (daft.ie, DoneDeal, Adverts), at about A$120m FY26 revenue.
The download is the original PDF as lodged with the ASX, with all 122 pages and the slide images shown on this page. No editable slide file comes with it.
Yes, as a reference. Each section has its own gradient colour (crimson for Residential, blue for Commercial, teal for Financial Services, navy for Global) and opens with a presenter divider. Large stat badges, white rounded cards and a three-card summary at the end of each section are useful patterns. The content and branding remain REA Group's.
REA Group's market announcements, where the Investor Day 2026 presentation was lodged

Create Your Own Slides
Turn your ideas into professional presentations in seconds with 2slides AI.
Используйте профессиональные дизайны, выберите свой стиль и генерируйте слайды с идеальной отрисовкой текста. На базе Nano Banana—начните создавать свою презентацию прямо сейчас.
Ваш AI-агент для слайдов. Экономьте время, сияйте быстрее с интеллектуальным созданием презентаций.


© 2026 2slides. Все права защищены.