
Входит в коллекцию Примеры презентаций для инвесторов · Примеры презентаций для инвесторов из Индии
Punjab National Bank (PNB) Q2 FY27 earnings presentation: the 49-slide financial results deck for the quarter ended 30 September 2026 (July–September 2026), released on 16 October 2026 and filed with the Indian stock exchanges.
Использует обложку этой презентации как образец стиля для слайдов с вашим содержанием. Или выберите любую страницу ниже, чтобы взять за образец её макет.
Быстрая навигация
Теги
Поделиться слайдами
Punjab National Bank (PNB) Q2 FY27 earnings presentation: the 49-slide financial results deck for the quarter ended 30 September 2026 (July–September 2026), released on 16 October 2026 and filed with the Indian stock exchanges.
Подробный просмотр каждой страницы слайда, включая макет, ключевой контент и визуальные элементы.
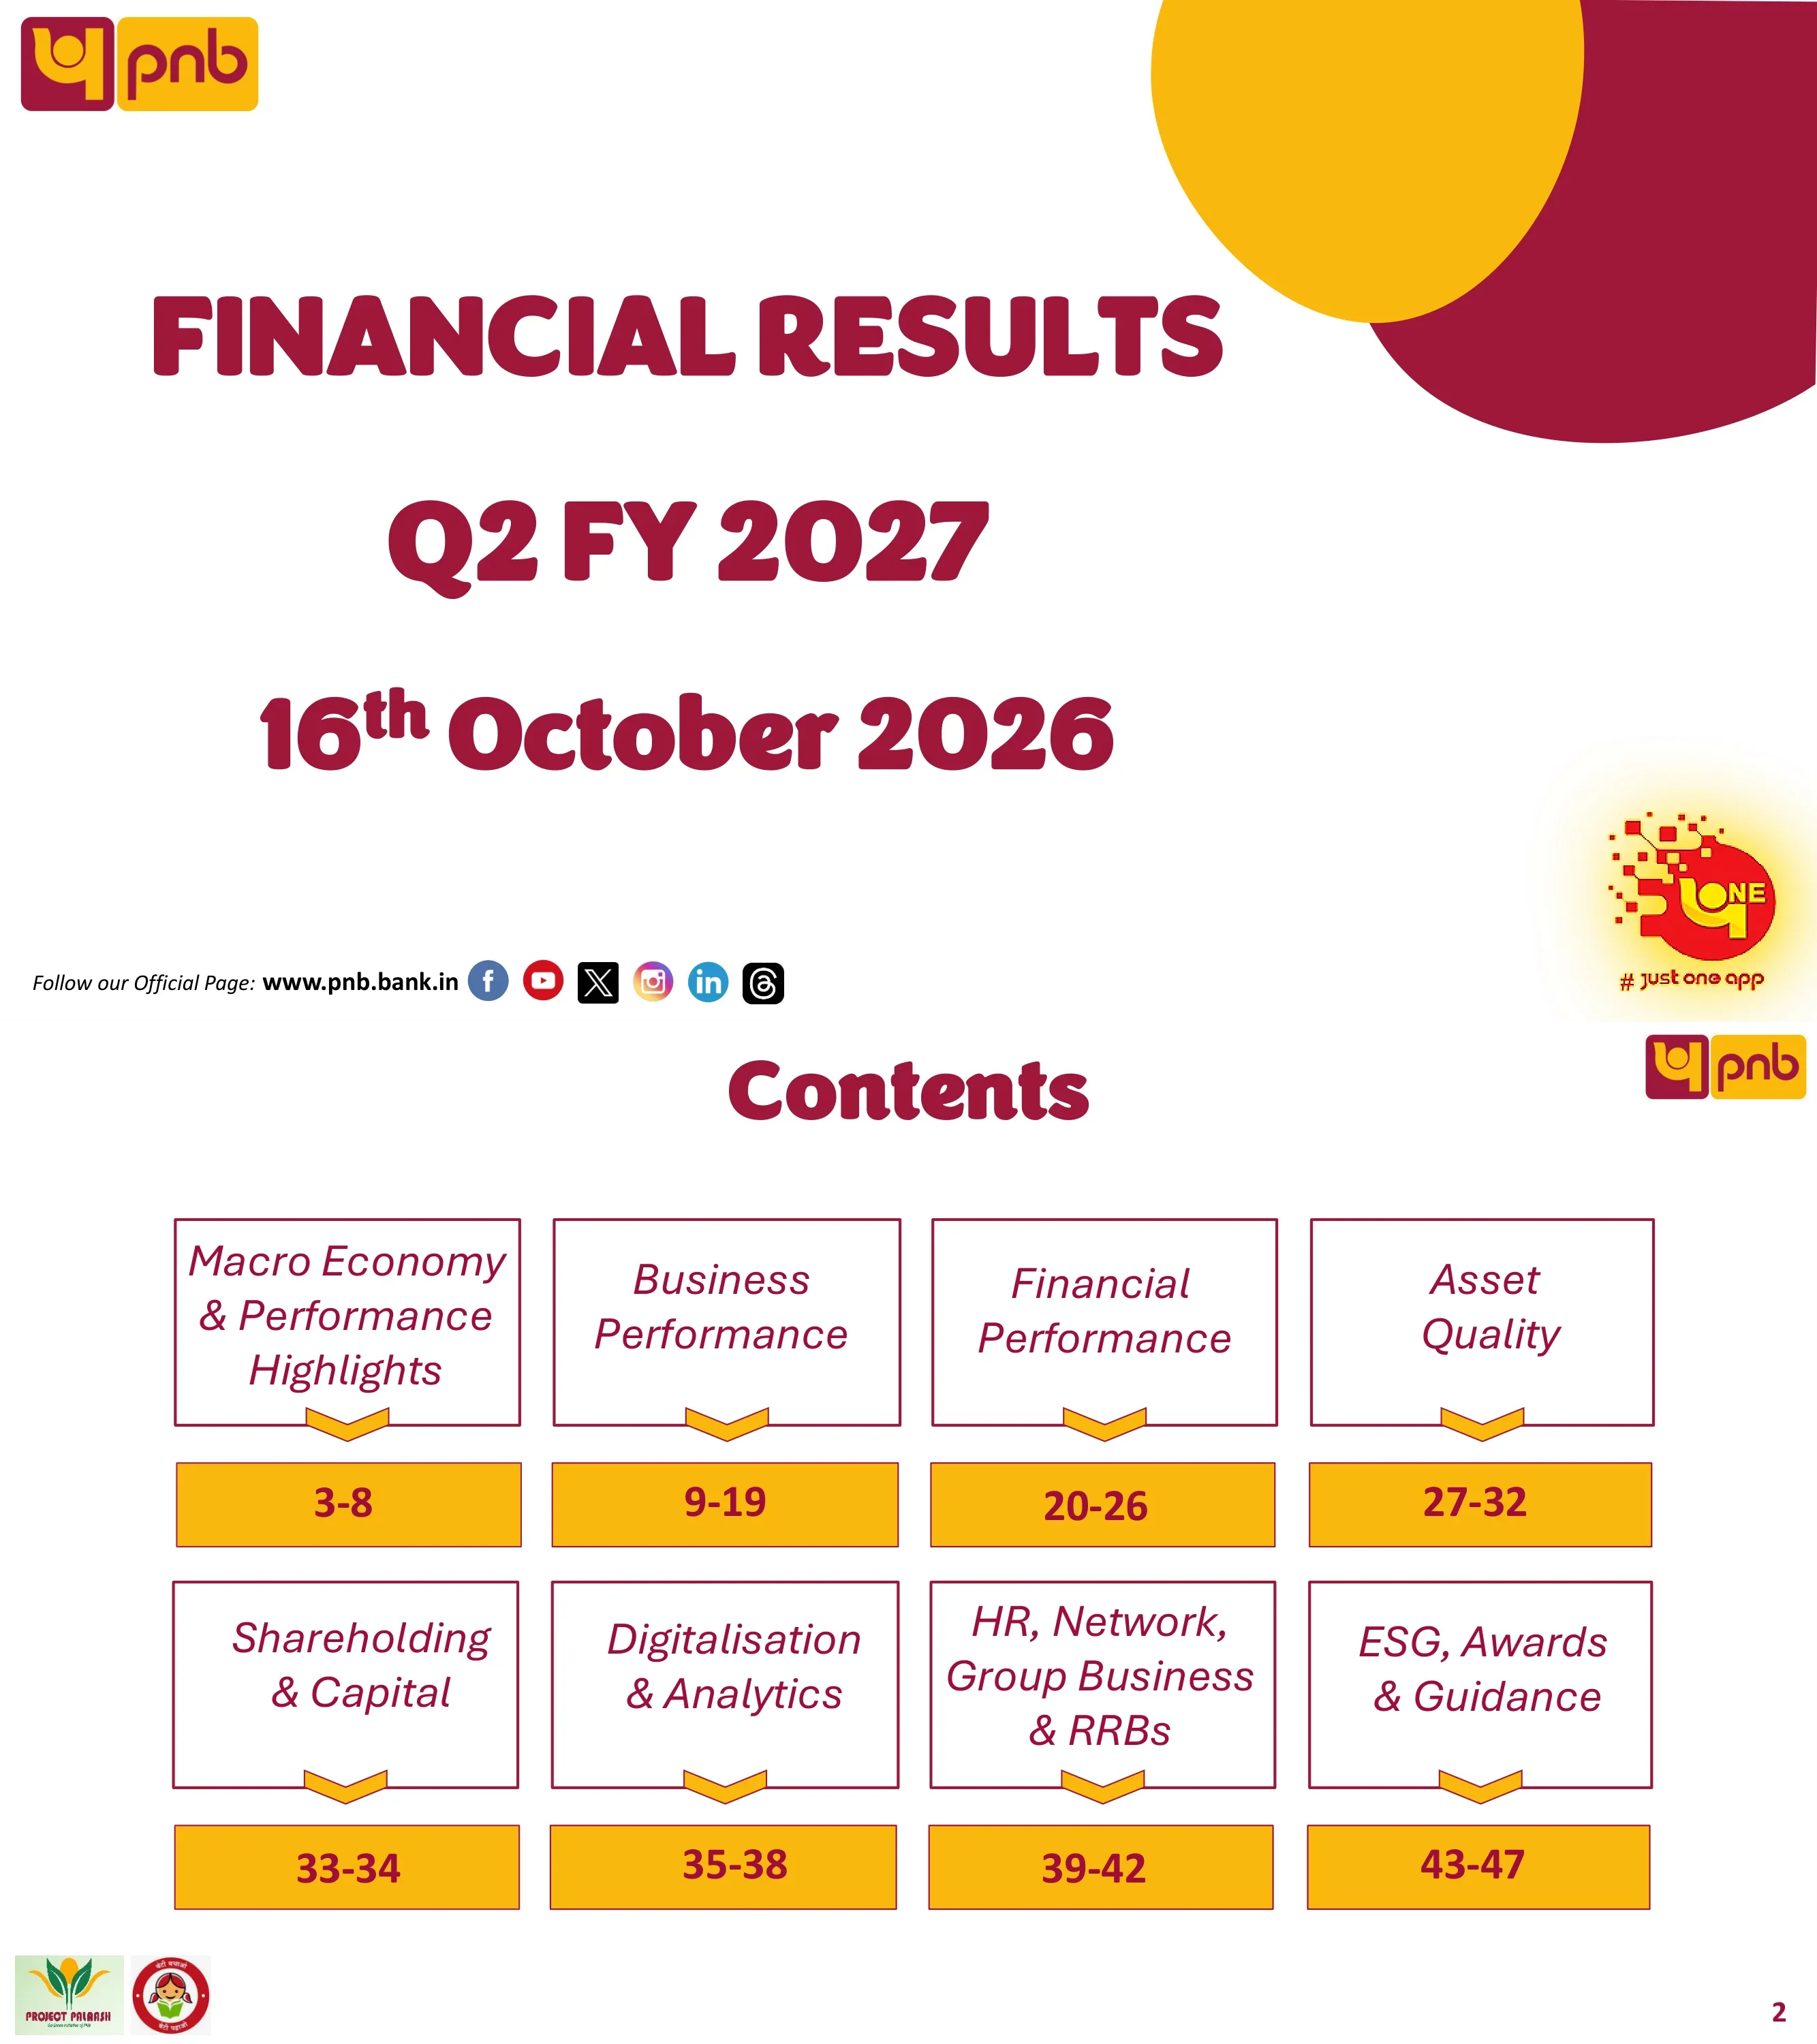
The cover announces PNB's financial results for Q2 FY 2027, dated 16 October 2026, with the website www.pnb.bank.in and social media links.
Large centred maroon display type on white, overlapping yellow and maroon circles in the top-right corner, PNB logo top-left, and a PNB ONE app badge bottom-right.
Eight sections with page ranges: Macro Economy & Performance Highlights (3-8), Business Performance (9-19), Financial Performance (20-26), Asset Quality (27-32), Shareholding & Capital (33-34), Digitalisation & Analytics (35-38), HR, Network, Group Business & RRBs (39-42), and ESG, Awards & Guidance (43-47).
A 4x2 grid of maroon-outlined boxes with italic section names. Each box has a yellow chevron pointing to a yellow page-range bar below it.
FY27 GDP forecasts have been raised to 7.0–7.1% (World Bank, RBI, OECD at 7.1%; IMF, ADB at 7.0%). WPI inflation rose to 11.39% and CPI to 5.54% by Sep-26, and RBI projects CPI of 5.2% for FY'27. The slide lists four pillars of growth and four major headwinds, including crude oil volatility and geopolitical risks.
The top half pairs a bar chart (earlier vs latest GDP projections) with a WPI/CPI line chart. The bottom half has four coloured chevron pillar panels and a Major Headwinds list with icons.
Twelve KPI tiles: net profit ₹5,532 Cr (+12.8% YoY), ROA 1.05%, tangible book value per share ₹111.94 (+16.7%), operating profit ₹7,532 Cr (+4.2%), GNPA 2.55% (-90 bps), NNPA 0.25% (-11 bps), PCR incl. TWO 97.32% (+41 bps), SMA-2 0.09%, global business ₹31,18,434 Cr (+11.9%), deposits ₹17,77,240 Cr (+9.9%), advances ₹13,41,194 Cr (+14.7%) and RAM advances ₹7,21,996 Cr (+13.6%).
A 4x3 grid of maroon-bordered tiles. Each tile has a small-caps label, a green YoY change and up/down arrow, and a large maroon value.
Nine-quarter trends from Q2 FY'25 to Q2 FY'27: net profit rose from ₹4,303 Cr to ₹5,532 Cr after a dip to ₹1,675 Cr in Q1 FY'26, operating profit from ₹6,853 Cr to ₹7,532 Cr, and NII reached ₹11,601 Cr. Annualised ROA was 1.05% in Q2 FY'27 (0.37% in Q1 FY'26).
Four dashed-border panels in a 2x2 grid: three yellow column charts with the latest quarter in maroon, and one ROA line chart.
Annualised tangible ROE was 17.32% in Q2 FY'27 and quarterly EPS was ₹4.81. Book value per share rose to ₹123.64 (total) and ₹111.94 (tangible), from ₹98.47 and ₹79.18 in Q2 FY'25. CRAR was 17.95% and CET-1 14.44% at Sept'26.
A 2x2 grid of line charts in dashed panels. Two of them are dual-series charts in maroon and yellow (book value; CRAR vs CET-1).
Gross NPA fell steadily from 4.48% (Sept'24) to 2.55% (Sept'26) and net NPA from 0.46% to 0.25%. Gross NPA declined from ₹47,582 Cr to ₹34,190 Cr and net NPA from ₹4,674 Cr to ₹3,313 Cr.
Two descending line charts on top (GNPA%, NNPA%) and two yellow bar charts below, with the latest bar in maroon.
PCR including technical write-offs rose to 97.32% and PCR excluding TWO was 90.31%. Annualised credit cost was 0.25% in Q2 FY'27, the slippage ratio 0.77%, and fresh slippages ₹2,395 Cr.
A 2x2 panel grid: a dual PCR line chart, a credit-cost line chart, a slippage-ratio line chart and a slippage-amount bar chart.
Global business was ₹31,18,434 Cr (+4.0% QoQ, +11.9% YoY). Overseas business grew 42.7% YoY and overseas advances 62.7% YoY. Global deposits were ₹17,77,240 Cr and global advances ₹13,41,194 Cr, with the CD ratio up to 75.5%.
A maroon-header table with QoQ/YoY growth columns on the left. On the right, a global business bar chart in ₹ lakh crore and a deposits-vs-advances clustered bar chart.
Domestic deposits were ₹17,11,840 Cr (+9.5% YoY). CASA deposits were ₹6,25,945 Cr (+7.3%) and the domestic CASA share was 36.6%. In the domestic mix, term deposits were 63.4%, savings 31.7% and current 4.9%.
A detailed deposit table on the left and a 3D pie chart of the domestic deposit mix in ₹ lakh crore on the right.
Domestic advances were ₹12,57,083 Cr (+12.5% YoY). MSME grew 19.8%, agriculture 14.4% and retail excluding IBPC 16.3%. RAM share rose to 57.4%. The domestic credit mix was corporate & others 42.6%, retail 23.6%, MSME 17.1% and agriculture 16.7%.
A segment-wise advances table with a four-slice 3D pie chart of the domestic credit mix.
Over five quarters to Sept'26: retail excluding IBPC reached ₹2,71,565 Cr (+16.3% YoY), home loans ₹1,41,836 Cr (+14.3%), vehicle loans ₹38,234 Cr (+29.6%) and education loans ₹9,514 Cr (+6.9%).
Quadrant layout split by maroon crosshair lines, with four bar charts. Each has a boxed YoY growth label and the latest bar in maroon.
PM Mudra disbursements were ₹6,269 Cr in Q2 FY27 (₹5,129 Cr in Q2 FY26). PM Surya Ghar has 2,35,415 accounts sanctioned (₹4,290 Cr). PM Vishwakarma has 44,103 applications with ₹429 Cr sanctioned. PM-Vidyalaxmi has ₹629 Cr sanctioned for the Apr–Sept'26 period.
Four quadrants, each pairing a scheme logo or photo with a small maroon-header table and a decorative three-star row.
Five-quarter bar charts show PMJJBY enrolments rising to 99.75 lakh, PMSBY to 370.56 lakh, APY to 62.69 lakh and PMJDY accounts to 582.78 lakh. There are 32,276 business correspondents, and BC-mobilised deposits reached ₹42,240 Cr. A side panel lists infrastructure such as 80 RSETIs and 163 FLCs.
Six small bar charts in a 3x2 grid separated by maroon rules, with a dashed-border bullet list on the right.
In the portfolio above ₹25 Cr, BBB & above is 93.7% (₹5,07,695 Cr) and AAA alone is 52.4%. The total portfolio is ₹6,04,357 Cr. Repo-linked loans rose to 56.51% of advances, while MCLR-linked loans fell to 21.77%.
A rating-grade table across three dates with maroon subtotal rows, and a stacked 100% column chart of the benchmark-rate mix on the right.
Industry exposure is 22.0% of domestic advances (₹2,76,747 Cr), with infrastructure at 8.6% (₹1,07,818 Cr). The externally rated standard energy portfolio is ₹47,086 Cr, shown in a rating-wise donut chart (A ₹19,671 Cr, 41.8%; AAA ₹11,021 Cr, 23.4%).
A large industry exposure table on the left and an Energy Sector panel with a boxed total and a donut chart on the right.
NBFC exposure was ₹2,27,905 Cr at Sept'26. AAA and AA ratings make up 98.68% of the total NBFC portfolio (AAA 72.67%). Separate pies show HFCs (79.68% AAA), PSU-backed NBFCs (94.41% AAA) and private NBFCs + MFIs (58.10% AAA).
A key-sector table and callout boxes on the left over a large 3D pie. Three smaller 3D pies on the right show each sub-segment.
Gross domestic investment was ₹5,13,289 Cr, of which SLR was ₹3,81,883 Cr (74.4%). HTM was 70.1% of investments. Modified duration (AFS+HFT) was 3.90, and NDTL was ₹16,39,809 Cr.
A full-width, single-table slide with a maroon header and three date columns.
Total non-SLR investment was ₹1,31,406 Cr. The largest components were CG recapitalisation bonds at ₹55,274 Cr (42.1%) and PSU bonds at ₹31,953 Cr (24.3%).
A full-width table with paired outstanding/% share columns for three dates.
Total assets were ₹20,79,601 Cr at 30 Sept'26 (₹18,76,801 Cr a year earlier). Net advances were ₹13,10,451 Cr, net investments ₹5,17,591 Cr and borrowings ₹1,13,616 Cr.
A two-part balance sheet table with Capital & Liabilities and Assets sections divided by a pink band.
Interest income was ₹34,585 Cr (+8.5% YoY) and interest on advances rose 11.0%. Other income fell 17.1% to ₹3,601 Cr as treasury income dropped 57.4%, while fee-based income grew 16.0% to ₹1,954 Cr. Total income was ₹38,185 Cr (+5.4%).
A dense income table with quarterly columns and YoY variance, plus separate H1 columns, separated by a yellow divider.
Total interest paid was ₹22,984 Cr (+7.4% YoY) and interest on borrowings rose 196.2%. Operating expenses were ₹7,670 Cr (+1.1%), with establishment costs down 7.2%. Total expenses were ₹30,653 Cr.
A quarter and H1 comparison table in the same format as the Income slide, with taller rows.
NII was ₹11,601 Cr (+10.8%) and operating profit ₹7,532 Cr (+4.2%). Provisions other than tax fell 84.9% to ₹97 Cr. PBT was ₹7,435 Cr (+12.9%) and net profit ₹5,532 Cr (+12.8%). H1 FY27 net profit was ₹10,786 Cr (+63.9%).
A P&L bridge table running from NII to net profit, with quarter and H1 variance columns.
Annualised Q2 FY27 ratios (global/domestic): NIM 2.58%/2.74%, cost of deposits 4.96%/4.97%, yield on advances 7.60%/7.78%, cost of funds 4.35%/4.34%, yield on funds 6.54%/6.65% and yield on investment 6.83%/6.86%.
Six clustered bar charts in a 3x2 grid divided by maroon and yellow crosshair lines, each comparing global (maroon) and domestic (yellow) over three quarters.
Half-year ratios (global/domestic): NIM 2.54%/2.69% (2.65%/2.78% in Sept'25 HY), cost of deposits 4.98%/5.00%, yield on advances 7.57%/7.74% and cost of funds 4.35%/4.35%.
Same six-chart grid as the previous slide, comparing Sept'25 HY, Mar'26 FY and Sept'26 HY.
In Q2 FY27, ROA was 1.05%, ROE 17.32%, EPS ₹4.81 and cost-to-income 50.45% (51.20% a year earlier). Net profit per employee was ₹22.51 lakh and per branch ₹209.37 lakh. Business per employee reached ₹30.66 Cr and per branch ₹285.18 Cr.
Two stacked tables: key ratios by quarter and H1, and productivity ratios across three dates.
SMA-2 accounts above ₹5 Cr fell to ₹1,159 Cr, or 0.09% of domestic advances (₹1,873 Cr and 0.17% a year earlier). The RAM total was ₹974 Cr (0.08%).
A single category table with paired SMA-2 amount and % of domestic advances columns across three dates.
Gross NPA moved from ₹35,381 Cr to ₹34,190 Cr in Q2 FY27, with ₹1,762 Cr of recoveries and upgrades and ₹1,824 Cr of write-offs offsetting ₹2,395 Cr of fresh additions. Total recovery was ₹2,805 Cr in the quarter and ₹5,594 Cr in H1.
An NPA roll-forward table with quarter and half-year columns.
Standard advances were ₹13,07,003 Cr (97.45%). Gross NPA was ₹34,190 Cr (2.55%), down ₹6,153 Cr or 90 bps YoY. Doubtful assets were 1.38% and loss assets 0.70%.
An asset classification table with outstanding and share columns, plus a YoY variation column with green down arrows.
Fresh slippages were ₹2,233 Cr in Q2 FY27 (corporate ₹302 Cr, MSME ₹756 Cr, agriculture ₹815 Cr, retail ₹360 Cr). Net recovery was ₹2,805 Cr against net slippage of ₹2,395 Cr, or 1.2x. The annualised slippage ratio was 0.77%.
A sector-wise clustered bar chart on the left and a recovery vs slippage table on the right, separated by a dotted maroon line.
GNPA ratios at Sept'26: retail 0.73%, agriculture 8.63% (from 10.30%), MSME 6.08% (from 10.24%) and corporate, overseas & others 0.13%, for a global GNPA of 2.55%.
A sector table across three dates on top and four small bar charts of sector NPA% below.
Industry GNPA fell to 2.35% (₹6,508 Cr on ₹2,76,747 Cr outstanding) from 3.18% a year earlier. Food processing was at 7.94% and textiles at 5.25%, while infrastructure stayed low at 0.42%.
A dense full-width industry table with O/s, GNPA and GNPA% for three dates.
Shareholding at 30.09.2026 (1,149.29 crore shares): Government of India 70.08%, FIs/banks/insurance 9.98%, FIIs 6.66%, resident individuals 6.28%, mutual funds 6.14%. Ratings: Moody's Baa3/P-3/Stable, Fitch BBB-/F3/Stable, India Ratings IND AAA/Stable, and Basel III AT1 bonds AA+ and Tier-II AAA from four domestic agencies.
A 3D shareholding pie on the left. Stacked rating panels on the right with agency logos and green rating badges in a rounded table.
Total capital was ₹1,70,219 Cr with CRAR of 17.95%, Tier 1 15.89%, CET-1 14.44%, AT-1 1.45% and Tier 2 2.06%. Total RWA was ₹9,48,163 Cr, of which credit RWA was ₹8,42,303 Cr.
Capital and RWA tables on the left and a stacked column chart of CRAR components over five quarters on the right, with Tier 1 callouts.
PNB One users grew 19% to 285 lakh, PNB One BIZ users 112% to 4.14 lakh and WhatsApp banking users 72% to 143 lakh. Digital transactions rose 31% to 408 crore and UPI remitter transactions 31% to 397 crore. Digital channels handled 95.7% of transactions in Q2 FY27.
Six dotted rounded panels, each with two cylinder columns (yellow before, maroon after) linked by a green growth arrow. One panel holds a 3D pie of digital share.
Q2 FY27 digital sanctions totalled ₹22,018 Cr across 5,88,720 accounts: agriculture ₹10,724 Cr, MSME ₹6,531 Cr and retail ₹4,763 Cr. The slide lists 10 retail, 11 agri and 8 MSME digital loan journeys, including new ones such as GEM Sahay and Digi Kisan Vahan.
Maroon segment labels with boxed sanction values on the left. A maroon gradient banner with three icons heads a three-column product list on the right.
The e-rupee (CBDC) has 29.72 lakh users and 1.85 crore transactions. New initiatives include UPI in PNB One BIZ and family banking. Planned next steps include revamped internet banking, Aadhaar face authentication and WhatsApp account debit freeze.
A pink-maroon CBDC panel with an e-rupee coin illustration on the left and two pill-headed bullet columns on grey on the right.
Analytics-led business augmentation since 25.11.2021 totals ₹44,210 Cr (MSME ₹26,085 Cr, retail ₹15,916 Cr, agriculture ₹2,209 Cr). The slide describes five initiatives, including the PNB Business 360 app, graph-based fraud detection, quantum computing feasibility work and ML early-warning signals.
A rounded maroon stat card on the left and five numbered rounded cards with yellow numerals on the right.
Over 64% of staff are under 40, and the average staff age is 39. Qualifications include 11,300 B.Tech/M.Tech and 8,651 MBA/PGDBM holders. Training highlights include 47,545 officers trained in an AI enablement programme with Microsoft and the Golden Peacock National Training Award 2026.
Two stacked rounded cards on the left (age profile table, qualifications) and two bullet-list cards on the right (training, new HR initiatives).
There are 53,672 touch points: 10,481 domestic branches, 10,915 ATMs and 32,276 BCs. Branches are 38.0% rural, 25.2% semi-urban, 19.7% urban and 17.1% metro. By region, Northern has the most (3,214, 30.7%). International presence covers Dubai, GIFT City, London, Bhutan and Nepal.
A colour-coded India map with regional callouts on the left. KPI cards, a branch donut, an international presence table and a loan-processing-office grid on the right.
Subsidiaries: PNB Cards & Services (100%), PNBISL (100%), PNB Gilts (74.07%), PNBIL London (100%) and Druk PNB Bank Bhutan (51%). Associates: PNB Housing Finance (28.01%), PNB MetLife (30%) and Everest Bank Nepal (20.02%). PNB also holds a 35% stake in each of eight regional rural banks.
An organisation-chart tree from PNB to Subsidiaries and Associates & JV, split into Domestic/Foreign/RRB nodes with cream detail cards.
PNB Housing Finance earned ₹546 Cr net profit in the June'26 quarter, and Everest Bank ₹317 Cr for FY to July'26. Consolidated RRB H1 net profit rose 62.7% to ₹1,294 Cr, and RRB CRAR improved 65 bps to 14.10%.
An entity results table on the left and an RRB consolidated performance table with YoY column on the right, separated by a dotted line.
Environmental: PALAASH 4.0, the PNB Agri Plus scheme, digital signage in 1,001 branches and an MoU with IGBC. Social: SHG credit linkage of ₹15,462 Cr across 4,57,757 groups and the BRIDGE mentorship programme. Governance: a 2060 Net Zero target (Scope 1, 2 and 3) and post-quantum cryptography for 200+ APIs.
Three pennant-shaped banners (green Environmental, pink Social, cream Governance) hanging from binder clips on a maroon rail, each with tick-mark bullets.
H1 FY2027 sustainable financing sanctions: renewable energy ₹22,906 Cr, solar rooftop ₹1,946 Cr, Green Car ₹1,807 Cr and Harit Niwas ₹233 Cr. Green tariffs have been adopted at 171 locations. Solar capacity is 3,892 KWp installed, with 1,908 KWp under execution.
A green icon list of financing figures on the left, a central Project Palaash logo, side text blocks with coloured arrow tabs, and two green-bordered solar capacity boxes at the bottom.
The total CSR budget outlay for FY26-27 is ₹129 crore, with funds utilisation 100% on track. The CSR footprint table lists skill development via 80 RSETIs and 2 RDCs (₹95.00 Cr), FTCs (₹19.00 Cr) and PNB Ladli Siksha Yojna (₹8.66 Cr).
A photo collage of training programmes with a cream stat card on the left, and a CSR activity table with a maroon header on the right.
Awards: runner-up for Best Bank in MSME Acceleration at the 4th ICC Emerging Asia Banking Conclave, the NCRP Collaboration Excellence Award and Gold Data Quality Champion Award from TransUnion CIBIL, and first runner-up in the IBA–PNB Manthan 2025 case study competition.
Four rounded award photos in a row, each above a cream pennant-shaped caption card.
Credit growth of 14.7% beats the 12–13% guidance, and deposit growth of 9.9% is within 9–10%. Q2 NIM of 2.58% is below the 2.60–2.70% target, and GNPA of 2.55% is just above the <2.50% target. NNPA (0.25%), PCR (97.32%), credit cost (0.25%), ROA (1.05%) and slippage ratio (0.77%) are all within guidance. Operating profit growth (4.2%) is behind the 9–10% guidance.
A centred four-column table (parameter, FY'27 guidance, Q2 FY'27, HY1 FY'27) without the tab bar.
A forward-looking statements disclaimer: actual results may differ materially, and Punjab National Bank undertakes no obligation to update these statements.
A centred serif title with one justified paragraph of quoted text.
The closing slide promotes the PNB ONE app with a QR code and shows four event photos. It lists social media follower counts, including Facebook 35,41,937, Instagram 11,98,861, YouTube 6,16,000 and X 4,74,197.
A large maroon 'Thank You' and QR card on the left with brand circle shapes in the corners, a 2x2 photo grid on the right, and a social icon row with follower counts.
Распространенные вопросы об этом слайде и основном содержании презентации.
For the quarter ended 30 September 2026, PNB reported net profit of ₹5,532 crore (+12.8% YoY), operating profit of ₹7,532 crore (+4.2%) and net interest income of ₹11,601 crore (+10.8%). Annualised ROA was 1.05%. Gross NPA improved to 2.55% (-90 bps YoY), net NPA to 0.25% and PCR including technical write-offs to 97.32%. Global business reached ₹31,18,434 crore (+11.9%), with advances up 14.7% and deposits up 9.9%. CRAR was 17.95%.
Indian banks follow an April–March fiscal year, so FY27 runs from April 2026 to March 2027 and Q2 FY27 covers July–September 2026. The deck also reports half-year (H1/HY1 FY27) figures for April–September 2026. H1 net profit was ₹10,786 crore, up 63.9% YoY.
Yes. The page offers the original 49-page PDF and an editable PPTX converted from that PDF. The PPTX lets you reuse the tables, chart layouts and KPI tiles in PowerPoint, Keynote or Google Slides. Because it is a conversion, check fonts and chart objects after opening.
It is PNB's own results presentation, filed with the stock exchanges (BSE and NSE) under SEBI Regulation 30. The source is the BSE corporate filing linked on this page. The exchange cover letter that accompanied the filing has been removed, so page 1 is the deck cover dated 16 October 2026. The presentation is in English.
Slide 47 compares guidance with actuals. Credit growth of 14.7% beat the 12–13% guidance and deposit growth of 9.9% met it. Net NPA (0.25%), PCR (97.32%), credit cost (0.25%), ROA (1.05%) and slippage ratio (0.77%) were all within target. Q2 NIM of 2.58% was below the 2.60–2.70% range, GNPA of 2.55% was just above the <2.50% target, and operating profit growth of 4.2% trailed the 9–10% guidance.
The deck uses a strict maroon and saffron-yellow brand palette. A persistent eight-tab section bar marks the current chapter in maroon, and titles use a serif font. Data tables have maroon headers and yellow rules. Charts use yellow bars with the latest quarter highlighted in maroon, inside dashed panels. Nine-quarter trend charts make the direction of each metric easy to read. It is a good reference for presenting dense banking data clearly.
Use this deck as a structural reference: cover, contents, KPI tile dashboard, trend charts, detailed financial tables, asset quality, capital, strategy pages, guidance vs actuals, and disclaimer. Give 2Slides your own figures or a results PDF and describe the style (for example a two-colour brand palette with a section tab bar). 2Slides can generate a matching investor presentation that you can then edit.
It suits investors and analysts covering Indian public sector banks, and credit professionals tracking asset quality and Basel III capital. Finance students can use it to learn bank metrics such as NIM, CASA, PCR, SMA-2 and slippage ratio. IR teams, founders and designers can use it to see how a large bank lays out a data-heavy earnings deck.
Exchange filing; first page is the cover letter to the exchange

Create Your Own Slides
Turn your ideas into professional presentations in seconds with 2slides AI.
Используйте профессиональные дизайны, выберите свой стиль и генерируйте слайды с идеальной отрисовкой текста. На базе Nano Banana—начните создавать свою презентацию прямо сейчас.
Ваш AI-агент для слайдов. Экономьте время, сияйте быстрее с интеллектуальным созданием презентаций.


© 2026 2slides. Все права защищены.