
Входит в коллекцию Примеры презентаций для инвесторов · Примеры презентаций для инвесторов из Японии
West Japan Railway Company's (JR West, TSE 9021) Japanese-language first-half FY2026 (2027年3月期 第2四半期) earnings presentation, dated 5 November 2026 and originally published on TDnet (Tokyo Stock Exchange Timely Disclosure network). The 74-page deck covers H1 consolidated results (operating income ¥115.4bn / 1,154 億円), a raised full-year forecast, and a full reprint of the JR West Group Medium-Term Management Plan 2030 plus appendix material.
Использует обложку этой презентации как образец стиля для слайдов с вашим содержанием. Или выберите любую страницу ниже, чтобы взять за образец её макет.
Быстрая навигация
Теги
Поделиться слайдами
West Japan Railway Company's (JR West, TSE 9021) Japanese-language first-half FY2026 (2027年3月期 第2四半期) earnings presentation, dated 5 November 2026 and originally published on TDnet (Tokyo Stock Exchange Timely Disclosure network). The 74-page deck covers H1 consolidated results (operating income ¥115.4bn / 1,154 億円), a raised full-year forecast, and a full reprint of the JR West Group Medium-Term Management Plan 2030 plus appendix material.
Подробный просмотр каждой страницы слайда, включая макет, ключевой контент и визуальные элементы.
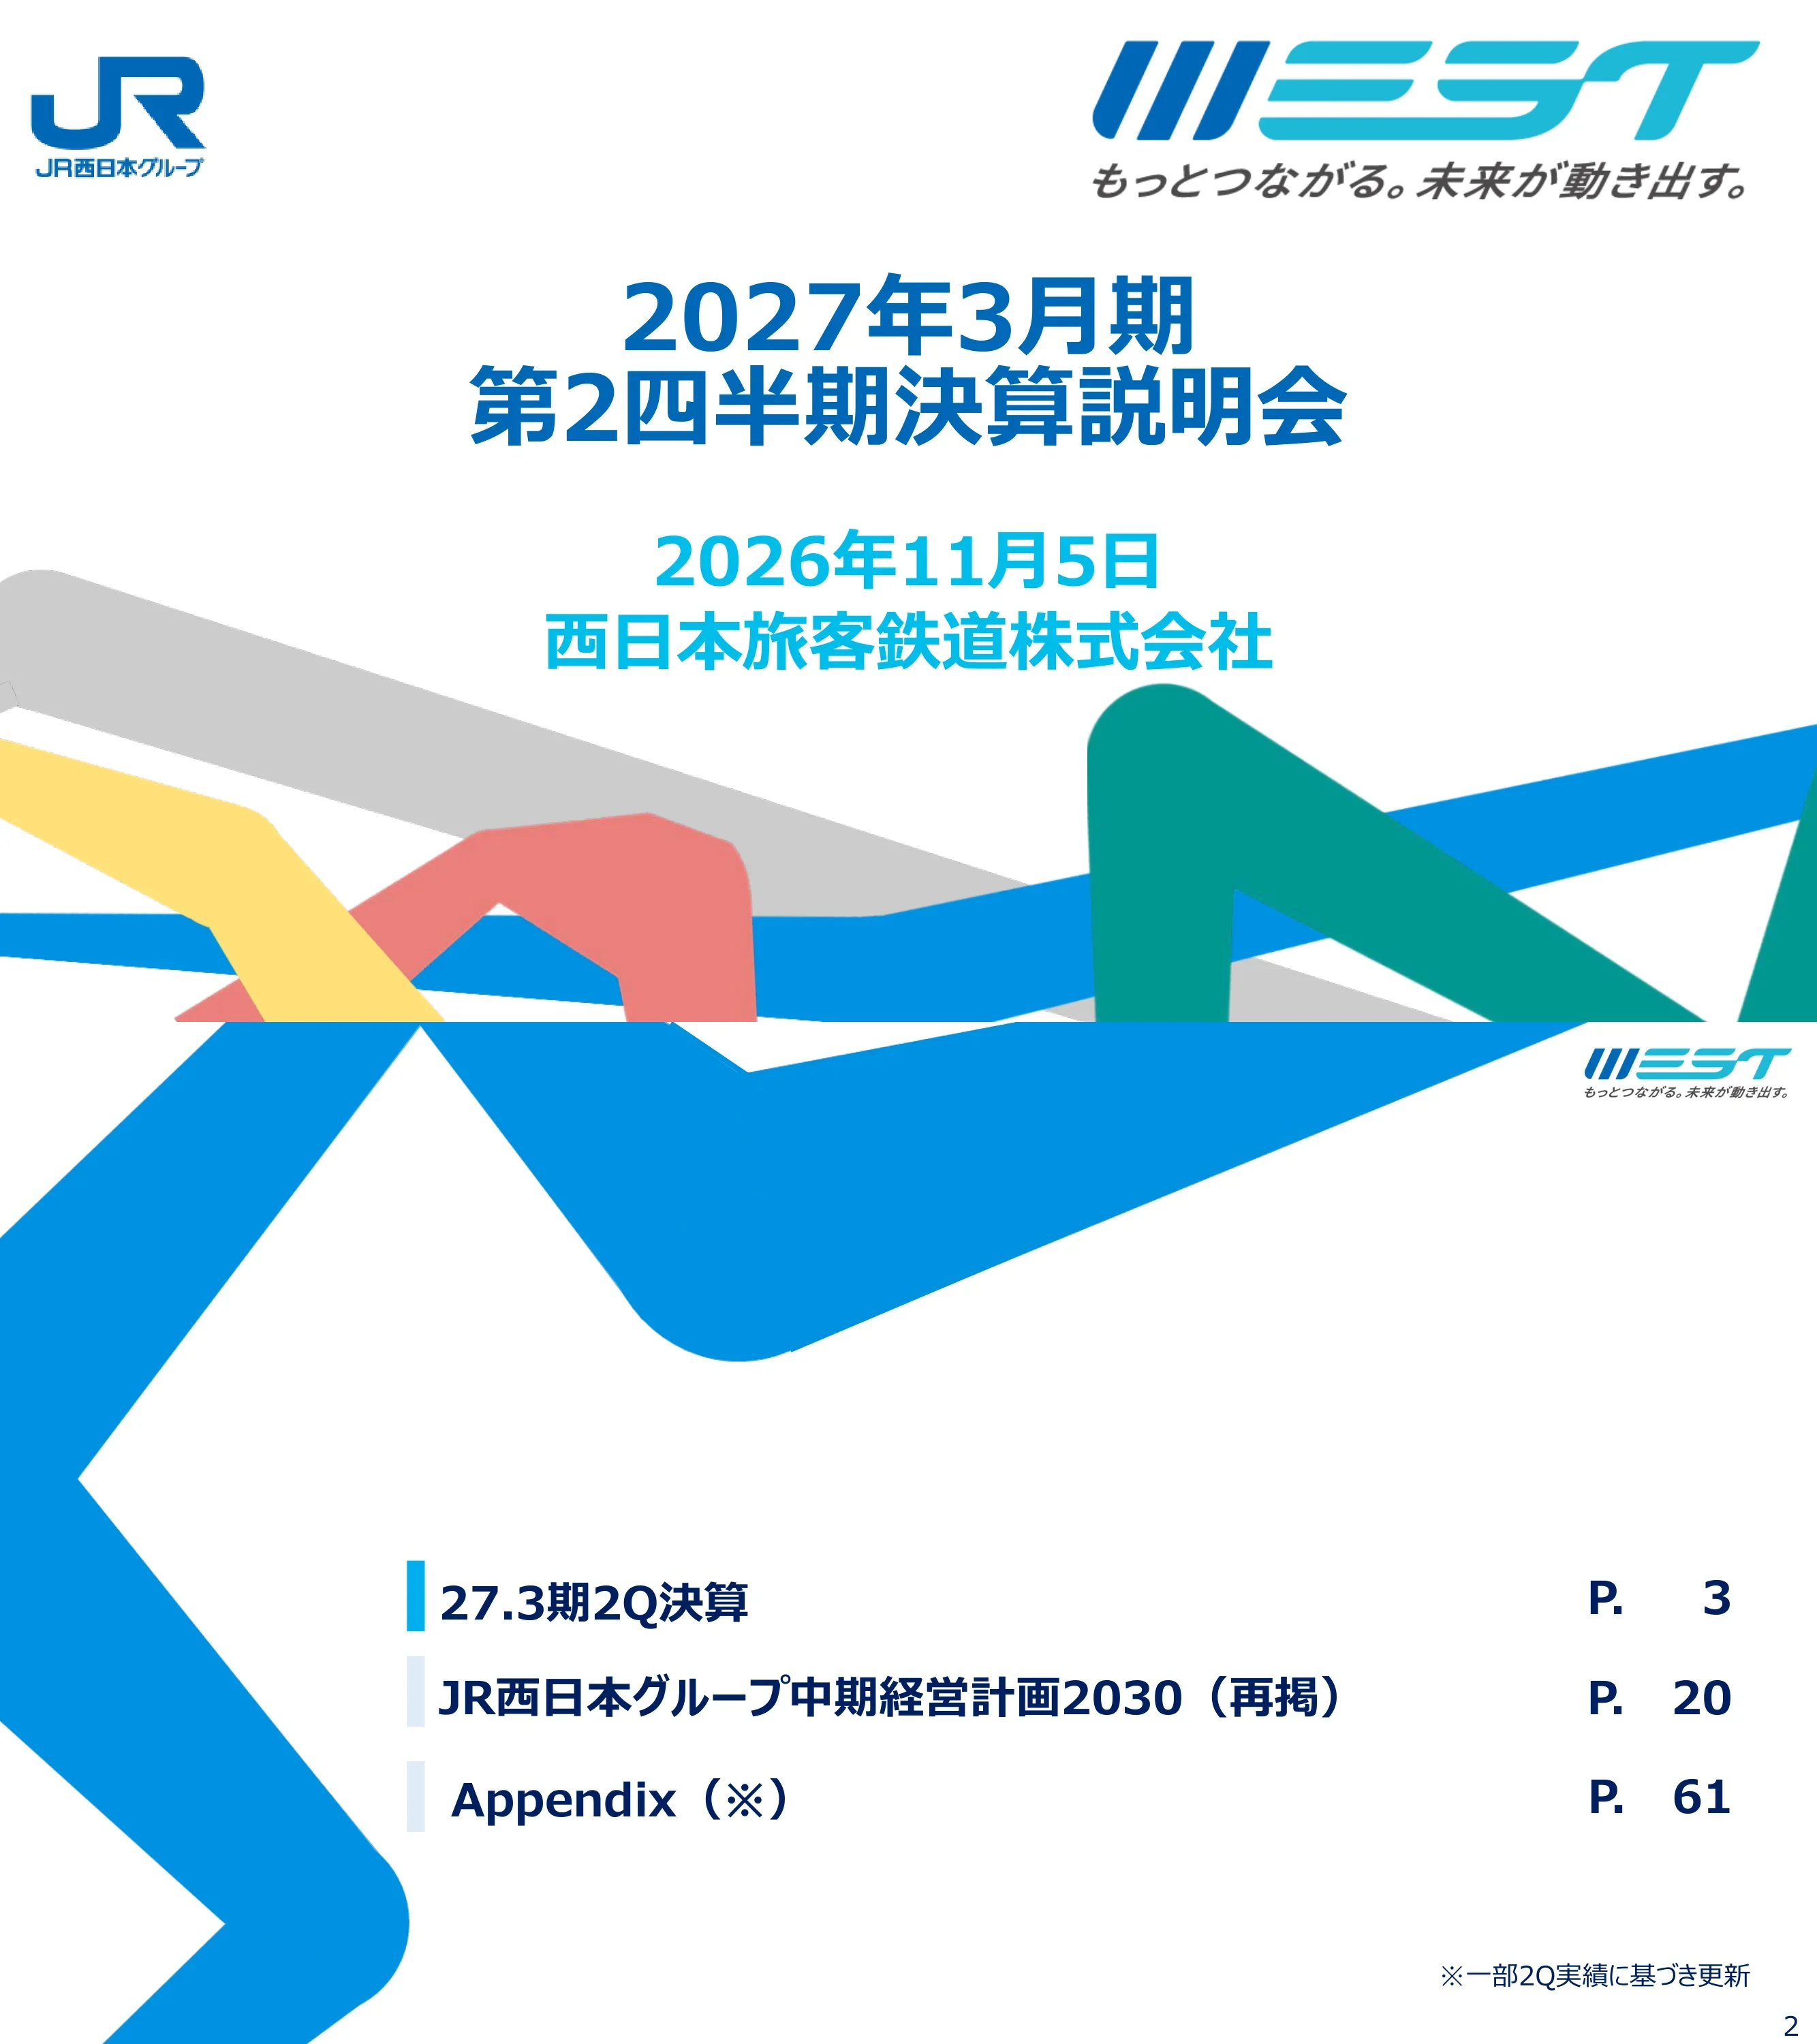
Title slide of West Japan Railway Company's FY3/2027 (FY2026) first-half earnings briefing, dated 5 November 2026.
Centered title block with company logo and tagline at top right, colorful rail-line ribbon graphic across the lower area
Three parts: H1 FY3/27 results (p3), JR West Group Medium-Term Management Plan 2030 reprint (p20), and Appendix (p61, partly updated with Q2 actuals).
Numbered agenda list on blue swoosh background with the first item highlighted
H1 operating revenue ¥879.2bn (8,792 億円, +74), operating income ¥115.4bn (1,154 億円, down 74), net income ¥73.7bn (737 億円). Full-year operating income forecast raised to ¥185.0bn (1,850 億円) from ¥165.0bn; annual dividend of ¥97.5 maintained.
Large blue-header consolidated results table with H1 actuals and full-year forecast columns, plus three summary bullets below
Operating income waterfall from ¥122.9bn (1,229 億円) to ¥115.4bn (1,154 億円): Mobility down 20, Retail down 30, Real Estate down 14, Travel flat. Commentary notes Shinkansen strength, loss of the Expo effect and hotel weakness.
Waterfall chart on the left with commentary bullets per segment on the right
Operating income forecast rises from ¥165.0bn (1,650 億円) to ¥185.0bn (1,850 億円), up 200: Mobility +165, Retail +15, Real Estate +20. Of the total, +70 stems from the revised Middle East impact.
Waterfall chart with segment detail and a callout for the Middle East effect
Assumptions revised: crude oil from $100 to $90 per barrel, inbound visitor reduction from 800k to zero. Impact on full-year operating income improves from down 130 to down 60 (¥7.0bn / 70 億円 better).
Assumption table above an impact table with initial and revised columns
H1 revenue ¥546.0bn (5,460 億円, +181) and operating income ¥84.2bn (842 億円, down 20); FY forecast operating income ¥117.0bn (1,170 億円). Transport revenue ¥479.7bn (4,797 億円) led by Shinkansen ¥279.3bn (2,793 億円).
Multi-year bar chart (revenue, operating income, EBITDA) beside a segment detail table with key points
Q1 transport revenue 102% and Q2 104% of prior year; FY forecast 103%. Drivers: domestic demand +323, inbound +2, Expo effect loss down 186. Non-consolidated FY costs up 393 vs prior year and up 110 vs initial.
Two bar charts (blue revenue, orange costs) with driver tables underneath
H1 inbound revenue ¥38.7bn (387 億円), 94% of prior year and 46% of the FY assumption of ¥83.5bn (835 億円). Visitor arrivals to Japan 20.34M for Apr-Aug (98% YoY) against a 60M government target for 2030.
KPI table on the left and arrivals bar chart on the right
H1 revenue ¥111.5bn (1,115 億円, down 75) and operating income ¥7.2bn (72 億円, down 30); FY forecast operating income ¥14.5bn (145 億円). Souvenir shops lost the Expo effect; Via Inn hotels earned 20.
Segment results table with chart and commentary bullets
H1 revenue ¥124.6bn (1,246 億円, +10) and operating income ¥24.0bn (240 億円, down 14). Leasing 87, sales 16, shopping centers 85, hotels down 7; FY forecast operating income ¥47.5bn (475 億円).
Revenue chart with sub-segment results table and commentary
Q2 shopping center sales ¥119.1bn (1,191 億円, 106%; LUCUA 293). Hotel ADR: Granvia ¥21,100 (99%) and Via Inn ¥11,300 (97%). New openings include LUCUA SOUTH and Prico Nishi-Akashi South.
KPI charts with a photo strip of new facilities
H1 (Jan-Jun) revenue ¥83.2bn (832 億円, down 38) and operating loss of 9 (flat); FY forecast revenue ¥201.0bn (2,010 億円) and operating income ¥1.0bn (10 億円).
Chart with results table
Two basic policies (safe, high-quality sustainable mobility; portfolio transformation) and five company-wide strategies. FY2030 targets: operating income ¥230.0bn (2,300 億円), EBITDA ¥470.0bn (4,700 億円), ROIC about 4%, ROE about 9%; cash allocation and DOE of about 3.5%.
Dense one-page summary: policy banner, strategy-by-segment matrix, target and cash allocation panels
Drone bridge inspection cuts days and staff by about 80%; AI depot work planning cuts time by about 90%; acquisition of Kaneko Co. Shinkansen pricing changes add ¥8-9bn (80-90 億円) per year; passenger-km up about 3%.
Grid of progress topic panels with photos and short bullet text
Route map of Keihanshin real estate and town-development projects: Osaka IR 2030, Naniwasuji Line spring 2031, LUCUA SOUTH, Sannomiya new station building FY2029, Kyoto station improvement FY2031 and Nara Hotel renewal.
Central route map with photo callouts and timeline labels
2030 targets: 11,000 DX key persons and value added per person up 15% vs FY24. Headquarters staff for Life Services and Infrastructure grows from about 200 (FY22) to about 500 (FY26).
Framework diagram on the left with targets and staffing chart on the right
Integrated Report 2026 published; JR West Group Innovation and Challenge Day on 22-23 Dec 2026 at Grand Front Osaka with investor Q&A; institutional investor IR Day planned around the end of FY2026.
Event cards with dates and venue details
Agenda repeated with the Medium-Term Management Plan 2030 section highlighted.
Same agenda layout with second item emphasized
Introduces the plan: environment and basic policy, the three focus areas, and positioning and target levels.
Title with short contents list on a diagonal blue gradient
External factors: inflation and rates, population decline and labor shortage, climate and earthquakes, AI, changing customer values, inbound and foreign labor, aging regional infrastructure. Non-railway operating income grew from 393 (2012) to 671 (2025).
Factor icon grid beside rolling-stock age histogram and trend chart
Mobility cycle from safety to customer experience to technology innovation, with fare revision. Non-mobility profit share rises from 40% (FY2025) to about 60% (FY2030); record ¥2.6tn five-year investment.
Cycle diagram at left, before/after portfolio pie charts at right
MTP 2025 focus areas (Mobility Services, Life Design) are reorganized into Life Services, Mobility and Infrastructure Solutions in MTP 2030.
Before and after mapping with connector arrows
Venn-style circles: Life Services (travel, leasing, shopping centers, retail, payments, hotels), Mobility (rail, secondary access, transport modes) and Infrastructure Solutions (technical solutions, JCLaaS), with an HR strategy base.
Three overlapping circles over a foundation bar
Operating income 1,969 (FY2018), 1,980 (FY2025, of which non-mobility 802 or about 40%), 2,300 target for FY2030 (non-mobility 1,350 or about 60%) and 3,000 for FY2035. ROIC 5.0% to about 4%, ROE 10.8% to about 9%.
Timeline bar chart with a stacked split and a target KPI table
FY3/31 targets vs FY3/26: Mobility 1,309 to 1,125, Retail 162 to 215, Real Estate 463 to 850, Travel 5 to 10, Other 54 to 100; total 1,980 to 2,300 (¥198.0bn to ¥230.0bn).
Comparison table with a teal IR supplement tag
Lists the five company-wide strategies and the management foundation.
Title with numbered strategy list on blue swoosh
Cycle diagram linking safety, quality and sustainability. The 2027 goal is to complete the Railway Safety Think-and-Act Plan 2027, with fare revision at an appropriate timing.
Cycle diagram with goal callouts
Projects across Osaka, Kyoto, Kobe and the Setouchi area; 2030 target of 1.4M additional Setouchi inbound visitors (1.6x vs 2025).
Regional map with project labels and target callout
Photo grid of completed and planned projects along the Sanyo Shinkansen, Tokaido and Naniwasuji/loop lines, with development potential.
Photo grid grouped by line with captions
Mobility co-creation platform with partners (Kansai private railways, JAL/ANA, Sagawa, Newmo, Pia, USJ); 2030 target platform GMV of ¥34.0bn (340 億円).
Partner ecosystem diagram with target callout
WESTER membership ecosystem with an AI orchestrator; target WESTER member spending of ¥470.0bn (4,700 億円) by 2030.
Ecosystem diagram with spending target
Acquisition of 20.0% of Kansai Mirai Bank for ¥90.0bn (900 億円) as an equity-method affiliate, enabling BaaS under the WESTER Mirai Bank concept.
Deal structure diagram with service concept
Preparing for the 60M-visitor era and Osaka IR; target group inbound revenue of ¥111.0bn (1,110 億円) by 2030. Visitor arrival chart 2003-2030 at 1.4x by 2030.
Long-term arrivals bar chart with initiative panels
Life Services plus Infrastructure operating income grows from 802 (FY2025) to 1,350 (FY2030, about 60%) through M&A, data centers, energy, fiber and XR.
Wedge-shaped growth chart with domain icons
Diversity and inclusion, generative AI utilization and enterprise architecture, tied to the portfolio shift toward non-mobility businesses.
Foundation diagram with three pillars
GHG reduction of 50% by 2030 (Scope 1+2 vs FY2013); environmental investment of about ¥350.0bn (3,500 億円) over FY26-30 across circular economy, nature and climate.
Pie-style diagram of three themes with target figures
Board effectiveness, risk management and the JRW-CSIRT cybersecurity team, with a governance structure chart.
Organization chart with three supporting panels
Lists Mobility; Life Services (retail, real estate, travel); and Infrastructure Solutions.
Title with business list on blue swoosh
Remembrance of the Fukuchiyama Line accident and Safety Plan 2027 hardware targets: platform doors 60% / 50%, level crossings 90% / 60%, Sanyo Shinkansen quake measures 100%.
Commemorative message at left, target table and photos at right
2030 target transport revenue of ¥1.07tn (10,700 億円) including fare revision; customer journey CX; Shinkansen private compartments; ridership growth targets of +10%.
Customer journey flow plus Shinkansen route map
Technology innovation using IoT sensors, drones and generative AI; target Mobility segment operating income of ¥112.5bn (1,125 億円).
Technology initiative panels with photos and target banner
Bars comparing total cost with revenue (pre-COVID, FY3/26, plan period) show room for fare revision during the plan; three requests to MLIT on inflation pass-through, Shinkansen non-reserved fares and commuter passes.
Cost vs revenue bar chart with request list
Target operating income of ¥21.5bn (215 億円); station retail renewals, franchise brands, Via Inn growing from 6,500 to 7,800 rooms and chain sales from ¥24.0bn to ¥30.0bn; JR Kyoto Isetan.
Initiative panels with brand logos and target figures
Target operating income of ¥85.0bn (850 億円); area mix shifting toward Tokyo, Fukuoka and overseas (about 35% to 60% by 2035); REIT AUM from 470 to 2,000 (億円) by 2035.
Mix charts with project photos and overseas map
Leasing asset mix, cumulative condo completions (6,399 to 15,524 to 24,143), book value 4,940 vs unrealized gain 4,969, and leasing yield 4.6% vs peers 2.5-3.3%; 2035 aim of ¥1tn assets and 5% ROA.
Pie charts, stacked bars and a peer yield comparison
Photo grid of condominium and office projects for FY3/27 and FY3/28 onward across Kansai, the Tokyo area and overseas (Houston, Sydney).
Two-period photo grid with project captions
LUCUA sales from ¥110.0bn (1,100 億円) in 2025 to ¥160.0bn (1,600 億円) in 2030 under Shopping x Community; hotel sales from 520 to 1,000 by 2035; Granvia Okayama and Nara Hotel renewals.
Target charts with facility photos
Target operating income of ¥1.0bn (10 億円); solutions, tourism and inbound/global initiatives including Himeji Castle management and a space travel tie-up.
Three initiative columns with photos
Target construction operating income of ¥17.5bn (175 億円); JCLaaS 30 contracts cumulative; ICOCA, iCONPASS, platform screens, ZIZAI robot and mitococa AI camera.
Solution product panels with target banner
Opens the section on cash allocation, investment, shareholder returns and KPIs.
Title with contents list on blue swoosh
Five-year cash in (operating CF ¥1.7tn / 17,000 億円, borrowing, asset sales) against cash out (capex and investment 26,200 and shareholder returns); net debt/EBITDA of about 6x.
Cash-in and cash-out stacked bars side by side
FY26-30 investment of ¥2.62tn (26,200 億円) vs 16,100 for FY23-27: growth 11,700 (+5,200), maintenance 12,600 (safety 7,900) and safety enhancement 1,900.
Stacked bar comparison of two plan periods with breakdown labels
The 11,700 growth investment split by strategy (1,300 / 6,800 / 3,600) with photo tiles of representative projects.
Breakdown bar at top with photo tiles below
The 12,600 maintenance investment: rolling stock 5,000, ground facilities 2,900, platform safety 450, earthquake measures 950 and others.
Breakdown bar with category labels
DOE of about 3.5%; dividend rising from ¥87.5 (FY3/19) to ¥97.5 (FY3/26), with the FY3/27 forecast held at ¥97.5.
Dividend history bar chart with policy text
Segment ROIC FY26e: Mobility 3.2%, Retail 15.0%, Real Estate 3.5%, Travel 19.6%; 2030 targets Mobility 2-4% and Life Services plus Infrastructure about 6%.
Segment ROIC table with target column
FY2025 actual, FY2026 initial forecast and FY2030 target: operating income 1,980 / 1,650 / 2,300; EBITDA 3,759 / 3,530 / 4,700; ROIC 5.0% / 3.9% / 4%; ROE 10.8% / 8.1% / 9%; net debt/EBITDA 3.7x / - / 6x.
Three-column KPI table
Inclusion score 6.66 to 7.0, female managers 4.3% / 14.0% to 10% / 20%, and GHG reduction 24% to 50%.
Compact KPI table with current and target values
Agenda repeated with the Appendix section highlighted.
Same agenda layout with third item emphasized
Gantt-style roadmap from 2026 to 2031 and beyond for Mobility, Life Services, Infrastructure Solutions and digital platforms.
Gantt-style table with rows by business and columns by year
Final results of the previous plan: operating income 1,980 vs target 1,850, EBITDA 3,759, ROE 10.8% and net debt/EBITDA 3.7x.
Target vs actual table
No passenger fatality accidents; platform doors 62% / 31%, level crossings 85% / 30%, quake measures 95% / 89% / 98%; all on track.
Progress table with status indicators
Matrix of KPIs and targets linked to each of the five company-wide strategies.
Matrix table by strategy
Segment operating income targets: Mobility 1,125, Retail 215, Real Estate 850, Travel 10, Other 100; total 2,300 (same as page 26).
Segment table with FY3/26 and FY3/31 columns
Diagram mapping the three focus areas to the reporting segments used in financial disclosure.
Mapping diagram with connector lines
Osaka IR (opening around autumn 2030, about 20M visitors a year, about 6M inbound) compared with Expo 2025 (184 days, 25.58M visitors; JR West Expo effect operating income of ¥20.0bn / 200 億円).
Side-by-side comparison panels with figures
Public-private split model: Joetsumyoko-Kanazawa 168.6km (2015) and Kanazawa-Tsuruga 125.2km (2024), with lease fees of 80 and 93 (億円); travel time savings and ridership growth.
Route map with data table and growth charts
Low-density lines (19 lines, 32 sections) and cases: Johana and Himi (transfer), Mine Line (BRT), Geibi, Oito and Kakogawa lines.
Regional map with case callouts
Generative AI chatbots (16,000 hours per month created), ELYZA call center (about 50% less post-call time), mitococa image AI, and station equipment CBM saving ¥0.25bn (2.5 億円) a year.
Four use-case panels with metrics
Opening in FY2029: about 91,500 m2 floor area, about 155m tall, retail about 19,000 m2, hotel about 250 rooms, offices about 7,000 m2.
Large rendering with specification table
Mukomachi (FY2026 passage, FY2028 redevelopment, 47,800 m2) and Nishi-Akashi (station building FY2026, condominium phase I FY2027).
Two project panels with renderings and timelines
Non-consolidated bond redemption schedule from 2027 to 2072 as of 30 September 2026.
Stacked bar chart by year with legend
Disclaimer on forward-looking statements, the IR site URL (westjr.co.jp/company/ir), and a note that Fukuchiyama Line accident compensation is not included.
Text-only disclaimer page
Распространенные вопросы об этом слайде и основном содержании презентации.
It is a Japanese-language earnings briefing (決算説明会資料) published by West Japan Railway Company (JR West, TSE 9021) on 5 November 2026. It was originally released on TDnet, the Tokyo Stock Exchange Timely Disclosure network, and is also available on the JR West IR site. All slide text is in Japanese; the descriptions here are in English.
FY2026 is the fiscal year from April 2026 to March 2027, which JR West labels 2027年3月期 (FY3/2027 or 27.3期). The first half (上期) covers April to September 2026, and 26.3期 is the prior year (FY2025).
H1 operating revenue was ¥879.2bn (8,792 億円, +74) and operating income ¥115.4bn (1,154 億円, down 74), with net income ¥73.7bn (737 億円). The full-year operating income forecast was raised to ¥185.0bn (1,850 億円) from ¥165.0bn (1,650 億円), and the annual dividend of ¥97.5 was maintained.
FY2030 targets are operating income of ¥230.0bn (2,300 億円), of which Life Services and Infrastructure Solutions contribute ¥135.0bn (1,350 億円), EBITDA of ¥470.0bn (4,700 億円), ROIC of about 4%, ROE of about 9% and net debt/EBITDA of about 6x. The plan involves five-year investment of ¥2.62tn (26,200 億円) and a DOE of about 3.5%.
Pages 3 and 58 offer blue-header financial and KPI tables; pages 4 and 5 are operating income waterfall charts; pages 8, 34 and 53 show bar and combo charts; pages 14 and 24 are strategy matrix and Venn layouts; pages 16, 29 and 68 are map layouts with callouts; and pages 30, 47 and 71 are photo-grid pipeline slides.
It covers the whole JR West Group: Mobility (Shinkansen and conventional lines), Retail, Real Estate, Travel and Regional Solutions, and the new Infrastructure Solutions area. Part 1 (pages 3-18) is H1 results, Part 2 (pages 20-59) reprints MTP 2030, and Part 3 (pages 61-73) is the appendix.
The gallery offers the deck as a PDF and as an editable PPTX converted from the PDF. Conversion from PDF may not perfectly preserve complex charts, fonts or photo-heavy layouts, so check slides before reuse.
The deck contains JR West's logos, photos and figures, which belong to the company. Use it as a layout and structure reference, and replace the branding and data with your own when building your presentation. Refer to the official IR site for the original disclosure.
Official IR library where the original Japanese deck is published

Create Your Own Slides
Turn your ideas into professional presentations in seconds with 2slides AI.
Используйте профессиональные дизайны, выберите свой стиль и генерируйте слайды с идеальной отрисовкой текста. На базе Nano Banana—начните создавать свою презентацию прямо сейчас.
Ваш AI-агент для слайдов. Экономьте время, сияйте быстрее с интеллектуальным созданием презентаций.


© 2026 2slides. Все права защищены.