
Входит в коллекцию Примеры презентаций для инвесторов
Itaú Unibanco 3Q26 Institutional Presentation: a 21-slide company overview of Brazil's largest private bank (NYSE: ITUB) covering its history, culture, client ecosystem, digital and AI strategy, ESG goals, long-run value creation and 2026 guidance, updated with third-quarter 2026 data and filed with the U.S. SEC as an exhibit to Form 6-K on November 4, 2026. Figures are in Brazilian reais (R$) unless shown in USD.
Использует обложку этой презентации как образец стиля для слайдов с вашим содержанием. Или выберите любую страницу ниже, чтобы взять за образец её макет.
Быстрая навигация
Теги
Поделиться слайдами
Itaú Unibanco 3Q26 Institutional Presentation: a 21-slide company overview of Brazil's largest private bank (NYSE: ITUB) covering its history, culture, client ecosystem, digital and AI strategy, ESG goals, long-run value creation and 2026 guidance, updated with third-quarter 2026 data and filed with the U.S. SEC as an exhibit to Form 6-K on November 4, 2026. Figures are in Brazilian reais (R$) unless shown in USD.
Подробный просмотр каждой страницы слайда, включая макет, ключевой контент и визуальные элементы.
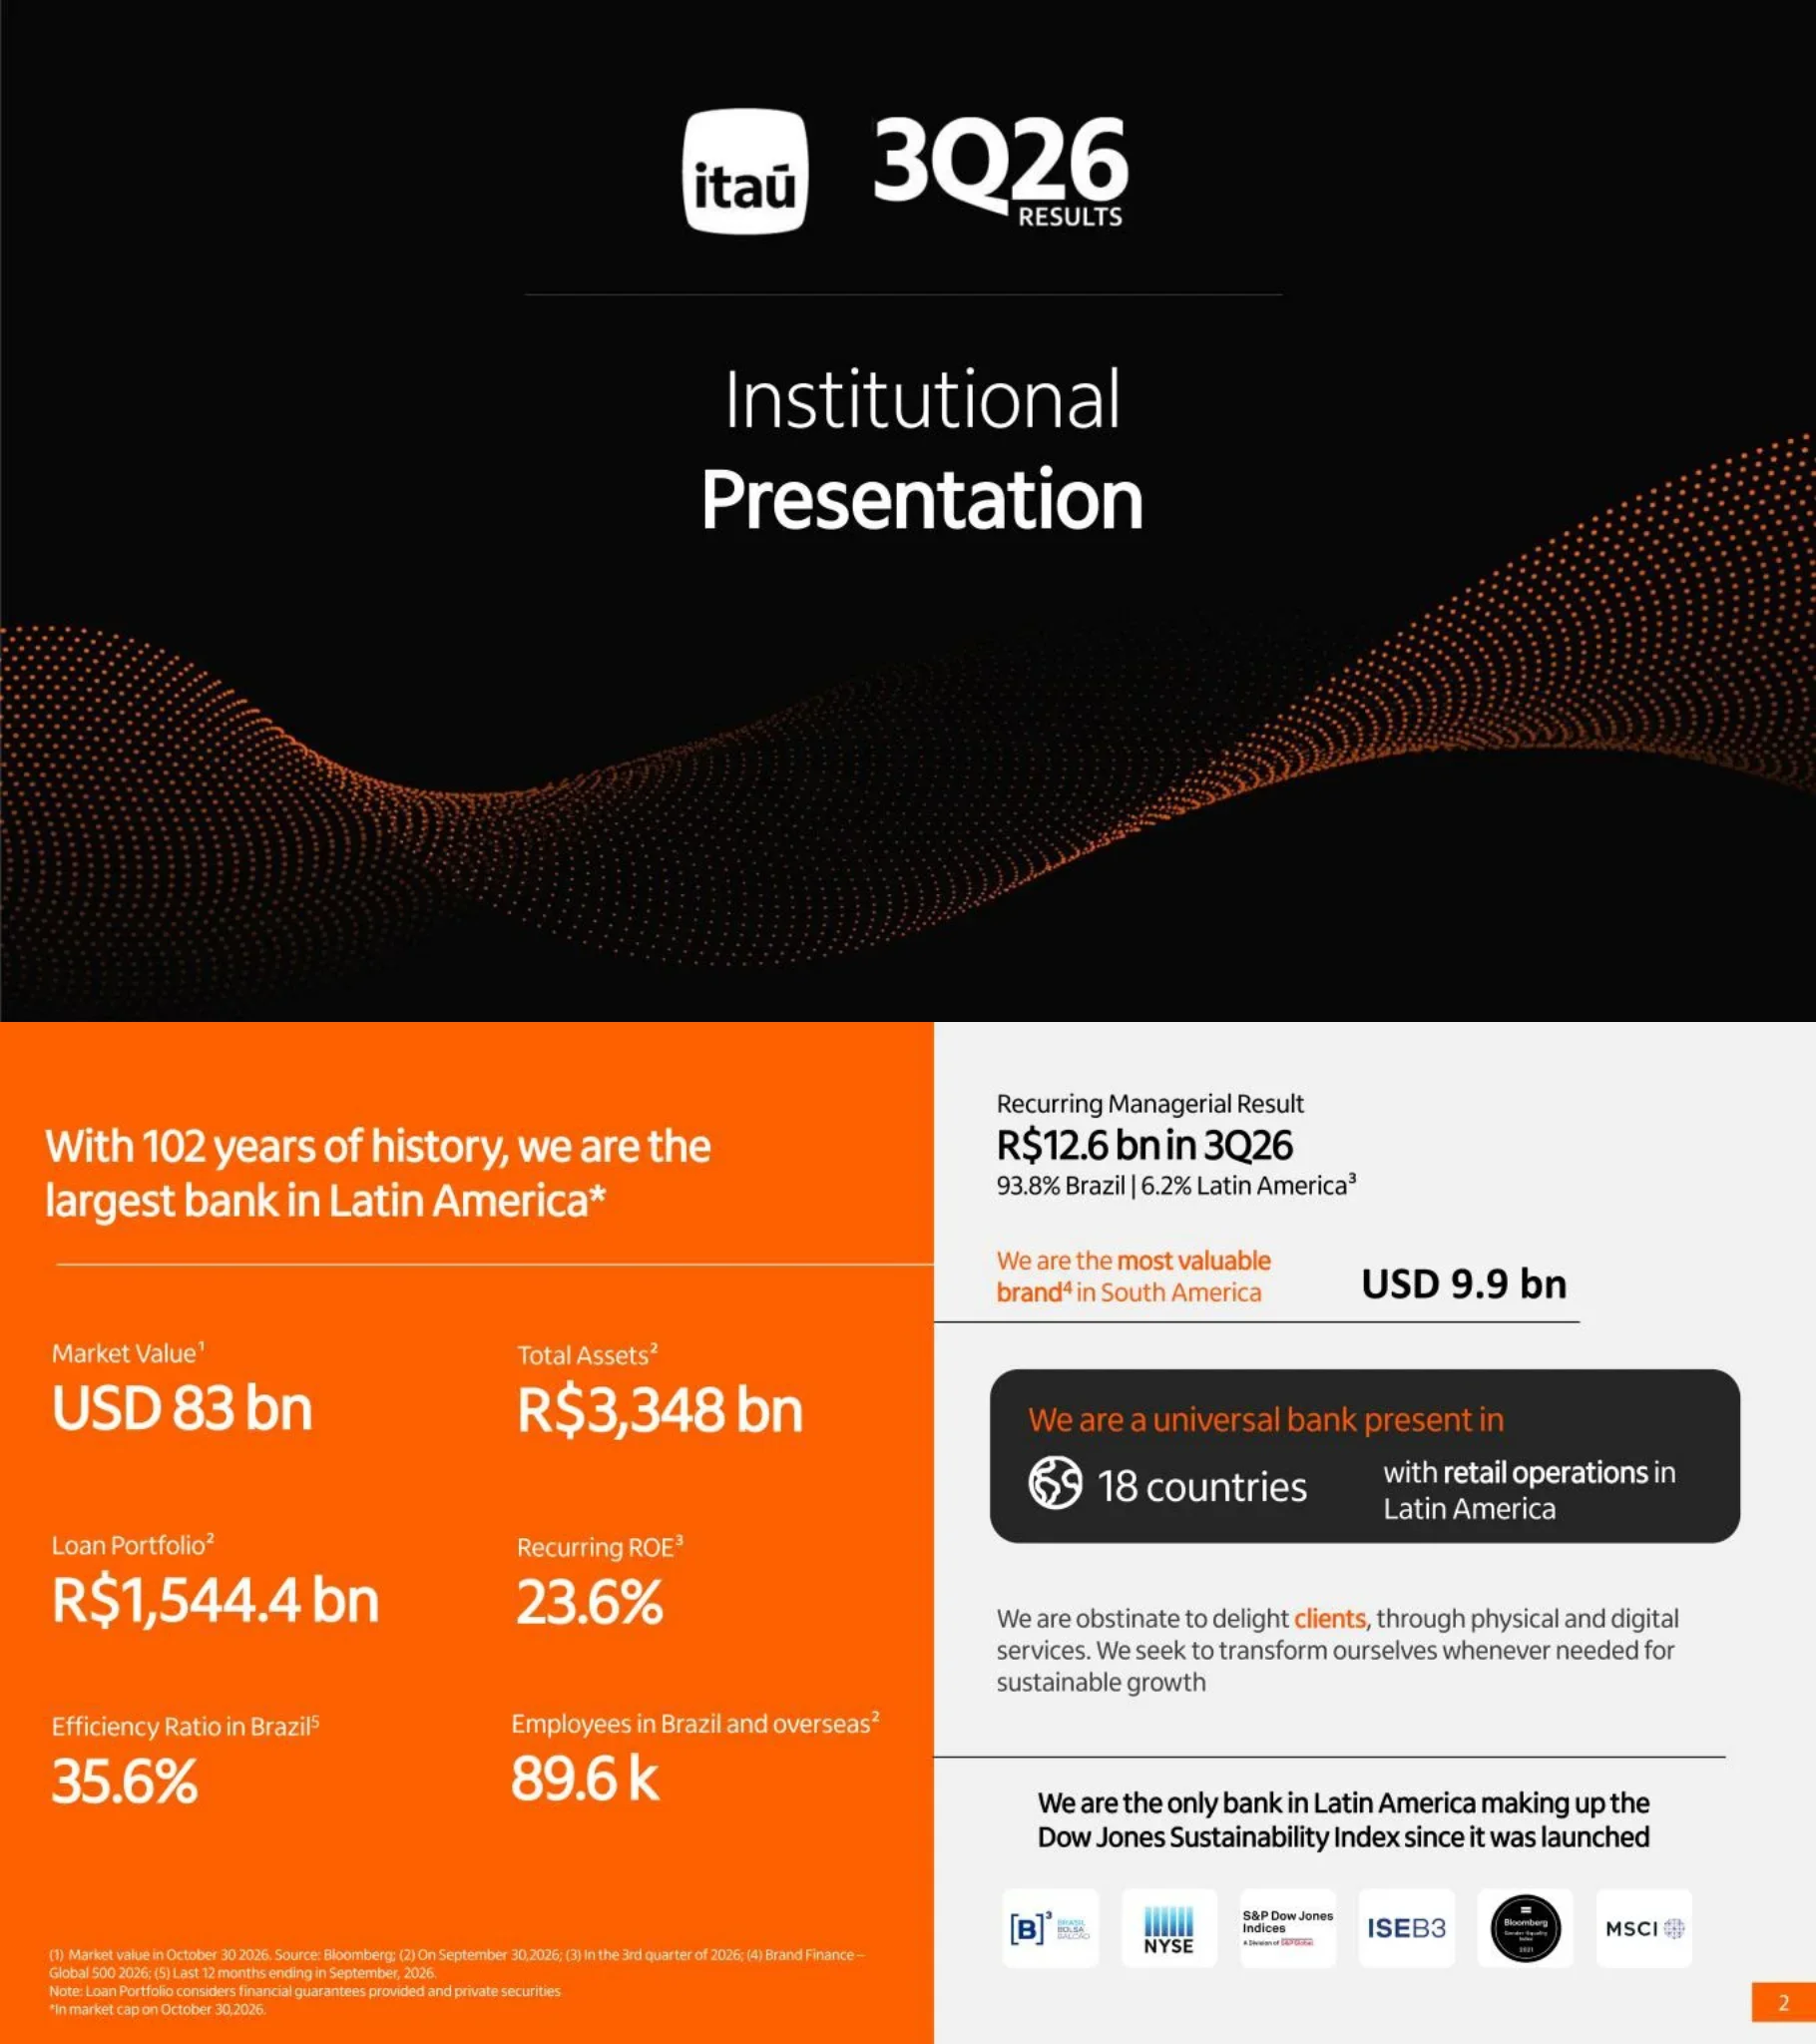
Title slide with the Itaú logo, the '3Q26 Results' wordmark and the heading 'Institutional Presentation'.
Centered logo and quarter badge above a thin divider, title below, on a black background with a flowing orange dot-wave graphic across the lower half.
Key figures: market value USD 83 bn (Oct 30, 2026), total assets R$3,348 bn, loan portfolio R$1,544.4 bn, recurring ROE 23.6%, efficiency ratio in Brazil 35.6% (last 12 months), 89.6k employees; recurring managerial result R$12.6 bn in 3Q26 (93.8% Brazil, 6.2% Latin America); most valuable brand in South America at USD 9.9 bn; presence in 18 countries with retail in Latin America; only Latin American bank in the Dow Jones Sustainability Index since launch.
Split layout: orange left panel with a 2x3 grid of large stat callouts, light right panel with result headline, brand value, a dark rounded 18-countries box, a mission statement and a row of index and exchange logos.
The 'Itubers' culture code in six pillars around a central 'Ethics are non-negotiable' tile: client first, driven by results, don't have all the answers, make choices and decisions, have each other's back, treasure diversity and inclusion, each with three behavior statements.
Full-bleed three-band grid (orange, green, blue) with pillar names on the outer edges, checkmarked behaviors inside, and a white rounded tile in the center.
Timeline from 1924 (Casa Moreira Salles / Unibanco) and 1943 (Banco Central de Crédito / Itaú) through first credit cards (1960), Itautec (1979), first ATM (1983), Banco1.net (2000), the Itaú BBA acquisition (2002), the Itaú–Unibanco merger (2008), ZUP (2019), Pix and Open Finance (2020), Itaú 100 years and One Itaú (2024), Itaú Emps and ICTi (2025), to the ia.i generative AI launch and NeoSpace acquisition (2026).
Serpentine three-row timeline running left to right, right to left, then left to right, with year markers, short captions, icons and brand logos; orange 'Click here for more info' button top right.
Client segments: for individuals, Itaú (monthly income up to R$7k), Uniclass (R$7k–R$15k), Personnalité (over R$15k or R$250k invested) and Private Bank (over R$10 million invested); for companies, Itaú Emps (microentrepreneurs), Itaú Empresas (very small and small companies) and Itaú BBA (middle and large companies); integrated systems and a full digital operation at competitive cost to serve.
White left area with two labelled rows of brand logos and eligibility captions; orange right column with two value statements separated by a rule.
Sixteen product lines with one-line descriptions: acquiring (Laranjinha), credit cards, derivatives, payments, fund administration, payroll loans, mortgage, pension plans and premium bonds, bank account, currency exchange, loans, insurance, investment banking, cash management, asset management (íon) and auto loans.
4x4 grid of orange line icons with product name and short description; orange banner bottom right reading 'And many more solutions for our customers!'.
Remote channels (WhatsApp, e-mail, telephone, chat, click to human, Bankline, mobile banking with 100% of features in the app) and in-person reach of 2.2k branches and 11.4k ATMs in Brazil and other Latin American operations (Chile, Paraguay, Uruguay); digital interactions in 3Q26 were 100% for corporate and 98% for individuals.
Two-column channel list (Remote vs In-Person) on white, with an orange strapline below; dark right panel with two large percentage stats and an orange callout box.
Client-listening programs over the last 12 months: Ituber Entende (+67k leader calls to clients), Papo de Cliente (+61k branch team meetings) and Ituber Visita (+640 remote visits linking leadership and frontline), plus data-driven product offers; right panel stresses NPS measurement, structured feedback and sustainable growth.
Left column of commitments, center 2x2 block of program logos with big numbers, orange right panel with four stacked statements.
Operating model wheel (design, technology, products and data around clients, framed by AI, quality, speed, efficiency and hyper-personalization); Itaú Intelligence and the ia.i conversational AI across Pix on WhatsApp, Wealth Specialist, Itaú Emps, Laranjinha+ and customer service; 92% more generative AI initiatives in use (9M26 vs 9M25); 99% fewer high-impact UX incidents, 3,008% more change deployments and 47% lower cost of single transactions (all 9M26 vs 9M18); open innovation via ICTi and Cubo.
Left: circular four-quadrant orange diagram inside a blue ring; right: stacked panels for the ia.i product strip, the AI growth stat and a three-box Quality + Speed + Cost equation.
Organization into communities and tribes with more than 21k employees in over 2.9k squads; efficiency ratio trend 3Q25 to 3Q26: quarterly ratio 38.8%, 38.3%, 37.1%, 37.4%, 37.5% (Brazil 37.1% to 35.7%) and trailing 12-month ratio 38.4% to 37.6% (Brazil 36.5% to 35.6%).
Left half text with two orange stat buttons; right dark panel combining a two-line chart (quarterly) over paired bars (trailing 12 months) for five quarters.
ESG strategy built on governance and conduct with three pillars: diversity and development, sustainable finance, and climate transition (resilience and support for clients moving to a low-carbon economy).
Centered four-petal shape (three orange, one grey for governance) with icons, each petal labelled by a heading and paragraph placed around it.
Diversity goals and 2025 results for employees in Brazil: women 53.6% of staff, 36.1% of leadership (goal 35%–40%) and 51.1% of hiring (goal over 50%); Black employees 30.4% of staff, 29.5% of full-time employees (goal 27%–30%) and 38.5% of hiring (goal over 40%); workforce profile of 5% people with disabilities, 10% LGBTI+, age mix 31.4% under 30, 62.3% 30–50, 6.3% over 50, and 51.1% with more than 5 years of tenure (8-year average).
Large orange rounded panel with a 2x3 goal grid and program icons; white right column with a workforce profile stat list; footnotes at the bottom.
Supplier ESG goals with progress: ESG questionnaire answered by 100% of suppliers by 2026 (73% achieved), D&I census at 100% of audited suppliers by 2030 (47%), 80% of suppliers with emissions inventories by 2030 (56%), ESG audits of 100% of sensitive suppliers by 2030 (98%); credit targets by 2030 of R$34.7 bn for women-led businesses (R$23 bn, 66%, by end-2025), R$15.0 bn in microcredit (R$2.8 bn, 19%) and R$67.1 bn for micro and small businesses (R$44.7 bn, 67%).
Orange left panel with four goal statements and 'achieved' sub-bullets; white right column with three stacked 'By 2030, allocate' targets and progress lines.
Net Zero by 2050 commitment; by 2030 cut Scope 1 and 2 operational emissions 50% (11.2% reduction so far to 16,634 tCO2e vs 18,738 tCO2e 2023 baseline) and Scope 3 operational emissions 50% (7.8% reduction to 35,288 tCO2e vs 38,263 tCO2e); 2030 sectoral decarbonization goals: steel 23%, electricity generation 63%, aluminum 19%, transportation 44%, cement 23%, coal phase-out, agriculture 36% corn, 25% soy and 12% livestock.
Orange left panel with a large yellow 'Net Zero by 2050' headline and two emission-target columns; white right side with a sector list in bold percentages.
Goal of R$1 trillion in financing for sectors with positive impact by end-2030 (from 2020); R$629.2 bn allocated between Jan-20 and Aug-26, with progress of 33.3% (Dec-23), 44.6% (Dec-24), 56.5% (Dec-25) and 62.9% (Aug-26).
Orange left panel with a very large yellow 'R$ 1 trillion' figure; right side with the allocated amount headline and four horizontal progress bars.
ROE versus average cost of capital from 2013 to 2025 and 9M25 vs 9M26 (ROE 24.1% vs cost of capital 14.7% in 9M26); stacked bars in R$ billion split recurring managerial result into cost of capital and value creation, rising from R$15.8 bn in 2013 to R$46.8 bn in 2025, with 9M26 at R$37.3 bn (value creation R$15.8 bn, up 19% vs 9M25).
Top: two-line chart across 13 years plus a separate 9M pair; bottom: stacked bar chart with an orange-outlined 9M comparison box on the right.
3Q26 KPI tiles with quarter-on-quarter and year-on-year change and 3Q22–3Q25 history: clients NII R$33.3 bn (+2.2% QoQ, +6.6% YoY), market NII R$1.3 bn (+42.3%, +46.9%), cost of credit R$10.4 bn (+2.7%, +10.2%), commissions and insurance R$14.1 bn (-0.2%, +0.2%), non-interest expenses R$17.1 bn (+2.4%, +1.7%) and recurring managerial result R$12.6 bn (+1.7%, +6.2%).
2x3 grid of KPI cards, each with an orange value block, up/down change arrows and a rounded strip of four historical values.
September 2026 risk and balance-sheet metrics with Sep-22 to Sep-25 history: credit portfolio R$1,544 bn (+1.4% QoQ, +10.2% YoY), 90-day NPL including securities 2.0%, Tier I capital ratio 14.2% (+0.4 p.p. QoQ, -0.6 p.p. YoY), funding R$1,779 bn (+3.5%, +13.3%), LCR 205.8% and NSFR 123.7%.
Same KPI-tile system as page 17: three tiles on a white top band and three on a black bottom band, with detailed footnotes.
Growth avenues: for individuals, more engagement and primary-bank focus through One Itaú, corporate development and beyond-banking offers (iPhone pra Sempre, Itaú Shop, Samsung no Itaú); for companies, a larger base of lower-revenue clients via the digital Itaú Emps offer; insurance growth with more than 20 products and over 15 partners on an open platform; and continued leadership in large-corporate credit and capital markets.
White left area with two icon-led sections, three text columns and partner logos; orange right column with Insurance and Corporate blocks.
Previous versus new 2026 guidance: total credit portfolio growth 5.5%–9.5% (Brazil 6.5%–10.5%), financial margin with clients growth 5.0%–9.0%, financial margin with the market R$2.5 bn–R$5.5 bn, cost of credit R$38.5 bn–R$43.5 bn, commissions, fees and insurance growth 2.0%–5.0% and non-interest expenses growth 1.5%–5.5% are all maintained; effective tax rate revised from 29.5%–32.5% to 28.0%–29.0%.
Three-column table (metric, previous, new) with the 'New' column shaded light blue and orange highlights on ranges.
Closing slide with the Itaú and 3Q26 Results marks and Investor Relations contact details: phone, e-mail and the English IR website.
Mirror of the cover: centered logos at top, contact line in the middle, orange dot-wave across the bottom on black.
Распространенные вопросы об этом слайде и основном содержании презентации.
It is Itaú Unibanco Holding's (NYSE: ITUB) company overview deck, updated with third-quarter 2026 data. It covers the bank's history, culture, client segments and products, distribution channels, technology and AI strategy, ESG goals, long-term value creation, quarterly KPIs and 2026 guidance. Itaú filed it with the U.S. Securities and Exchange Commission as an exhibit to a Form 6-K on November 4, 2026.
The earnings presentation (https://2slides.com/gallery/itau-unibanco-q3-2026-earnings-presentation) is the results-call deck that walks through the quarter's income statement, credit quality and segment results in detail. This institutional presentation is the bank's standing overview for investors who want to know who Itaú is: it adds the 102-year timeline, culture code, client segments, product grid, channels, AI and ESG strategy and a 2013–2026 ROE versus cost-of-capital history, and it summarizes the quarter in just a few KPI slides plus the 2026 guidance table. Read this one first for context, then the earnings deck for the quarterly detail.
Most figures are in Brazilian reais (R$), the currency Itaú reports in. A few headline numbers are in US dollars and are labelled as such, such as the USD 83 bn market value and the USD 9.9 bn brand value on page 2.
According to the deck, recurring managerial result was R$12.6 bn in 3Q26 with a recurring ROE of 23.6%. The loan portfolio was R$1,544.4 bn and total assets R$3,348 bn at September 30, 2026; the 90-day NPL ratio including securities was 2.0% and the Tier I capital ratio 14.2%.
Only the effective tax rate changed, lowered from 29.5%–32.5% to 28.0%–29.0%. Guidance for credit portfolio growth, financial margin with clients and with the market, cost of credit, commissions and insurance, and non-interest expenses was maintained (page 20).
Net Zero by 2050; a 50% cut in Scope 1 and 2 and in Scope 3 operational emissions by 2030; 2030 decarbonization goals for steel, power generation, aluminum, transportation, cement, coal and agriculture; R$1 trillion of sustainable-economy financing by 2030 (62.9% reached by Aug-26); and diversity, supplier and credit-allocation goals with progress to date.
Yes. You can view all 21 slides on this page and download the PDF and an editable PPTX converted from it. The content belongs to Itaú Unibanco, so use it for research and reference; the layout patterns (key-stat cover, values grid, serpentine timeline, product grid, KPI tiles and guidance table) work well as a model for your own institutional presentation.
Partly. The slides in the SEC exhibit are images, so the PPTX was produced with text recognition: most text is in editable text boxes, but some characters and numbers were misread (for example a digit read as a letter). Check every figure against the PDF or the slide images on this page before reusing it.
The institutional presentation was filed as an exhibit to Form 6-K on November 4, 2026.
Official IR site listed on the deck's closing slide, with results materials and reports.

Create Your Own Slides
Turn your ideas into professional presentations in seconds with 2slides AI.
Используйте профессиональные дизайны, выберите свой стиль и генерируйте слайды с идеальной отрисовкой текста. На базе Nano Banana—начните создавать свою презентацию прямо сейчас.
Ваш AI-агент для слайдов. Экономьте время, сияйте быстрее с интеллектуальным созданием презентаций.


© 2026 2slides. Все права защищены.