
Входит в коллекцию Примеры презентаций для инвесторов · Примеры презентаций для инвесторов из Индии
IndiGo (InterGlobe Aviation Ltd.) Q2 FY27 Earnings Presentation — results for the quarter ended 30 September 2026, filed with BSE/NSE on October 29, 2026
Использует обложку этой презентации как образец стиля для слайдов с вашим содержанием. Или выберите любую страницу ниже, чтобы взять за образец её макет.
Быстрая навигация
Теги
Поделиться слайдами
IndiGo (InterGlobe Aviation Ltd.) Q2 FY27 Earnings Presentation — results for the quarter ended 30 September 2026, filed with BSE/NSE on October 29, 2026
Подробный просмотр каждой страницы слайда, включая макет, ключевой контент и визуальные элементы.
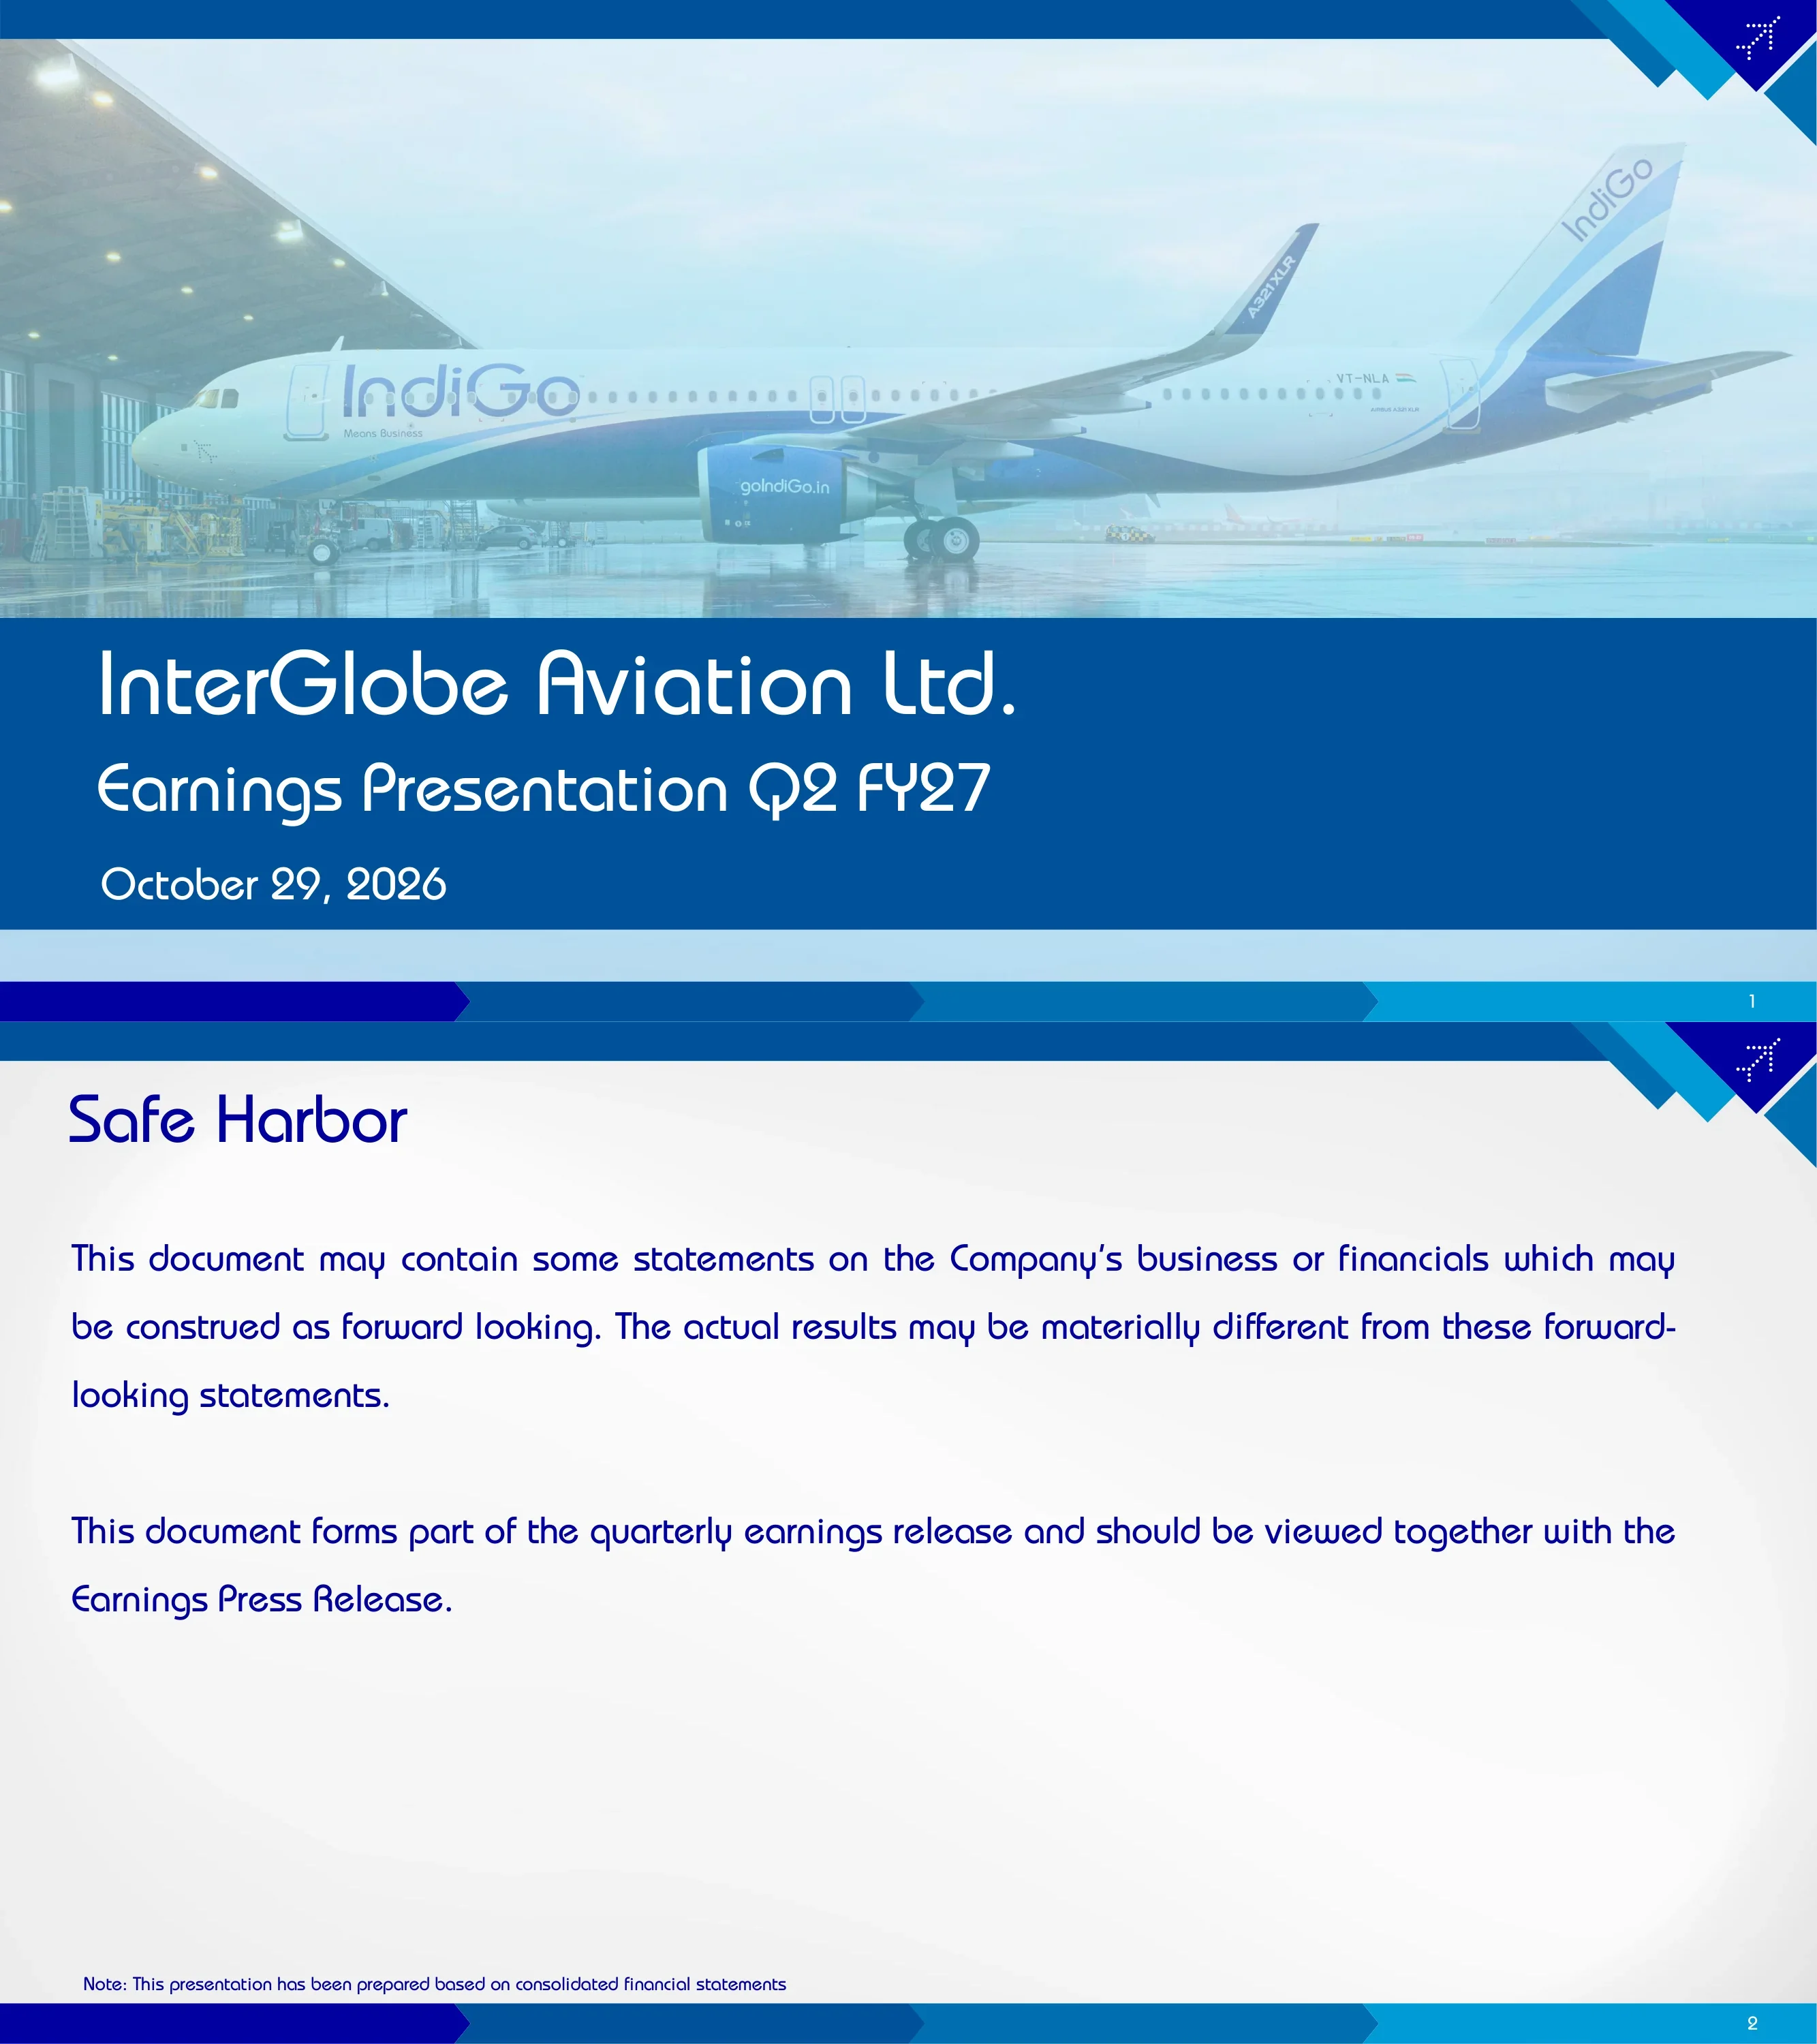
Cover slide for InterGlobe Aviation Ltd.'s Q2 FY27 earnings presentation dated October 29, 2026, featuring an IndiGo Airbus A321XLR (registration VT-NLA) parked outside a hangar.
Full-bleed aircraft photograph in the upper two-thirds with a solid blue title band below carrying the company name, deck title and date; segmented blue chevron footer.
Forward-looking statements disclaimer noting actual results may differ materially, that the document forms part of the quarterly earnings release and should be read with the Earnings Press Release, and that the presentation is prepared on consolidated financial statements.
Single-column text slide with a large heading, two short paragraphs and a footnote line.
Route map of India and international destinations from London and Amsterdam to Jakarta, Nairobi and Mauritius, with Q2'27 KPIs versus Q2'26: ASKs 40.8 billion (-1.0%), RPKs 32.8 billion (-3.7%), closing aircraft 442 (+25, including 3 A321 freighters and 5 B787 damp leases), 97 domestic destinations (+3) and 42 international destinations (+1, including 7 non-operational in the quarter); services to 98 further international destinations via strategic partnerships.
Full-slide map with colour-coded destination dots, a KPI scorecard of five metric boxes at top right, a legend at left and footnotes along the bottom.
Closing fleet of 442 aircraft at 30 Sep 2026 versus 432 at 30 Jun 2026 and 417 at 30 Sep 2025. By type: 41 owned, 66 finance lease, 330 operating lease and 5 damp lease. Owned/leased mix: 174 A320neo, 26 A320ceo, 186 A321neo, 4 A321 XLR, 44 ATR and 3 A321 freighters; damp-leased: 5 B787 (A321neo, A320ceo and B777 damp leases now at zero).
Three-column comparison table (Sep 2026, Jun 2026, Sep 2025) split into rounded panels for closing fleet, fleet type, owned/leased aircraft family and damp lease, with rotated section labels on the left.
Section divider introducing the quarterly financial highlights comparing Q2 FY27 with Q2 FY26.
Centered single-line heading on a plain light background.
Quarter ended Sep'26 vs Sep'25 (INR million): total income 243,119 vs 195,995 (+24.0%); RASK ₹5.76 vs ₹4.55 (+26.4%); total expenses 261,884 vs 220,812; CASK ₹6.22 vs ₹5.16; CASK ex fuel ₹3.77 vs ₹3.71; EBITDAR 24,599 vs 11,143 (+120.8%, margin 10.5% vs 6.0%); EBITDAR ex-forex 36,153 vs 38,003 (margin 15.5% vs 20.5%); PBT (18,765) vs (24,817); PAT (18,791) vs (25,821), margin (8.0%) vs (13.9%); PAT ex-forex (7,237) vs 1,039.
Two-part table: metric labels in a left rounded panel and Sep'26 / Sep'25 / favorable-(adverse) columns in a right panel, alternating grey bands for key lines, footnotes on finance income and forex hedging gains.
Revenue from operations ₹233,638 million vs ₹185,553 million (+25.9%); other income 9,481 vs 10,442 (-9.2%); total income 243,119 (+24.0%). ASK 40.8 billion (-1.0%), RPK 32.8 billion vs 34.0 billion (-3.7%), load factor 80.3% vs 82.5% (-2.2 pts), yield ₹6.30 vs ₹4.69 (+34.3%) and RASK ₹5.76 vs ₹4.55 (+26.4%); operational metrics include non-scheduled operations.
Label panel and value panel table with two blocks — revenue lines and operating metrics — separated by whitespace, with shaded subtotal rows.
RASK reconciliation: total revenue ₹243,119 million less finance income 8,220 gives 234,899 (Sep'25: 195,995 less 8,294 = 187,701); divided by ASK of 40,797 million (41,220 million) yields RASK of ₹5.76 (₹4.55).
Step-by-step reconciliation table with lettered formula labels (A, B, C=A/B) and shaded result rows.
Expense lines (INR million, Sep'26 vs Sep'25): supplementary rentals and aircraft repair and maintenance 35,809 vs 32,630; depreciation and amortization 30,742 vs 26,405; finance costs 16,578 vs 14,649; aircraft and engine rentals 4,264 vs 3,200; airport fees 16,582 vs 15,155; employee costs 22,737 vs 20,448; stock in trade 1,470 vs 1,127; other expenses 20,702 vs 18,659; total excluding fuel and forex 148,884 vs 132,273 (-12.6%). Aircraft fuel 99,668 vs 59,618 (-67.2% adverse); forex loss 13,332 vs 28,921 (53.9% favorable); total expenses 261,884 (-18.6%). CASK ex fuel ex forex ₹3.45 vs ₹3.01; average USD/INR 95.09 vs 87.06; closing 95.85 vs 88.79.
Dense three-block table — operating costs, fuel and forex, then unit-cost and exchange-rate metrics — with shaded subtotal bands.
CASK reconciliation: total expenses ₹261,884 million less finance income 8,220 = 253,664 (212,518 a year earlier); over ASK 40,797 million gives CASK ₹6.22 (₹5.16); fuel cost per ASK ₹2.44 (₹1.45) leaves CASK ex fuel ₹3.77 (₹3.71); forex cost per ASK ₹0.33 (₹0.70) leaves CASK ex fuel ex forex ₹3.45 (₹3.01).
Lettered reconciliation table (A through G) with formulas in the row labels and alternating shaded rows.
EBITDAR bridge from PBT of ₹(18,765) million: add finance cost 16,578, less finance income 8,220, add depreciation 30,742 and aircraft and engine rentals 4,264 to reach EBITDAR 24,599 (Sep'25: 11,143); adding forex of 11,554 (26,860) gives EBITDAR ex-forex 36,153 (38,003). On revenue from operations of 233,638, EBITDAR margin is 10.5% (6.0%) and ex-forex margin 15.5% (20.5%).
Bridge-style reconciliation table with lettered results (A–E), shaded result rows and a footnote on forex hedging gains of ₹1,778 million and ₹2,061 million.
Total cash ₹526,854 million at Sep-26 vs ₹535,152 million at Sep-25 (-1.6%): free cash 399,290 (+3.7%) and restricted cash 127,564 (-14.9%). Total debt ₹873,031 million vs ₹748,138 million (+16.7%): capitalized operating lease liability 551,592 (+11.1%) and debt excluding lease liability 321,439 (+27.7%).
Two side-by-side framed panels, each with a two-bar stacked column chart comparing Sep-25 and Sep-26, total labels above bars and legends beneath.
Four-year Q2 trends (INR million): total revenue 155,029 (Q2 FY24), 177,590, 195,995 and 243,119 (Q2 FY27); total expenses 153,138, 186,661, 220,812 and 261,884; EBITDAR 24,465 (16.4% margin), 24,340 (14.3%), 11,143 (6.0%) and 24,599 (10.5%); PAT 1,889 (1.3%), (9,867) (-5.8%), (25,821) (-13.9%) and (18,791) (-8.0%).
2×2 grid of framed column charts with value labels above each bar and grey margin pills under the EBITDAR and PAT charts.
Glossary defining ASK, CASK, CASK ex fuel, CASK ex fuel ex forex, EBITDAR, EBITDAR margin, load factor, PAT margin, RASK, RPK and yield (passenger ticket revenue per RPK).
Two-column term/description table with a blue header row.
Распространенные вопросы об этом слайде и основном содержании презентации.
It is InterGlobe Aviation Ltd.'s 14-slide results deck for the quarter ended 30 September 2026. It covers network presence, the fleet breakup, a financial summary, revenue and cost breakups, reconciliations for RASK, CASK and EBITDAR, cash and debt, four-year Q2 trend charts and a glossary.
Yes. IndiGo is the airline brand of InterGlobe Aviation Ltd., the listed company that files results with BSE and NSE (ticker INDIGO). This presentation was filed with the exchanges on October 29, 2026 alongside the earnings press release.
Indian companies use an April–March fiscal year, so FY27 runs from April 2026 to March 2027 and Q2 FY27 is July to September 2026. Comparisons in the deck are against Q2 FY26 (July–September 2025).
Total income rose 24.0% to ₹243,119 million and revenue from operations 25.9% to ₹233,638 million, helped by a 34.3% rise in yield to ₹6.30. EBITDAR was ₹24,599 million (10.5% margin), and the net loss narrowed to ₹18,791 million from ₹25,821 million a year earlier.
Much of IndiGo's lease liability is in US dollars, so rupee moves create large foreign-exchange gains or losses. The average USD/INR rate was 95.09 versus 87.06 a year earlier; excluding the ₹13,332 million forex loss, PAT would have been ₹(7,237) million and EBITDAR margin 15.5%.
The closing fleet was 442 aircraft at 30 September 2026, up from 417 a year earlier. It includes 186 A321neo, 174 A320neo, 26 A320ceo, 4 A321 XLR, 44 ATR, 3 A321 freighters and 5 damp-leased B787s.
Yes. The page offers the original PDF and an editable PPTX converted from it, so you can reuse the table, reconciliation and chart layouts. The PPTX is a machine conversion, so check fonts and spacing before presenting.
The original PDF is available from the BSE corporate filings site, and InterGlobe Aviation also publishes results materials on its investor relations pages. The version here has the exchange cover letter removed.
Original exchange filing of this presentation, October 29, 2026

Create Your Own Slides
Turn your ideas into professional presentations in seconds with 2slides AI.
Используйте профессиональные дизайны, выберите свой стиль и генерируйте слайды с идеальной отрисовкой текста. На базе Nano Banana—начните создавать свою презентацию прямо сейчас.
Ваш AI-агент для слайдов. Экономьте время, сияйте быстрее с интеллектуальным созданием презентаций.


© 2026 2slides. Все права защищены.