
Faz parte de Exemplos de apresentações para investidores · Exemplos de apresentações para investidores da Austrália
Westpac Banking Corporation (ASX: WBC) 2026 Full Year Results Presentation and Investor Discussion Pack, a 154-page investor deck lodged with the ASX on 2 November 2026 covering FY2026, the 12 months ended 30 September 2026. Westpac's financial year runs October to September, so FY26 is 1 October 2025 to 30 September 2026, with halves 1H26 (Oct-Mar) and 2H26 (Apr-Sep). All amounts are in Australian dollars (A$) unless stated, with New Zealand figures in NZD where marked. Following its index page, the deck opens with the results presentation by CEO Anthony Miller and CFO Nathan Goonan (pages 3-41), then the Investor Discussion Pack (from page 42) with sections on earnings drivers, the UNITE transformation program, supporting customers, segment performance, credit quality and provisions, capital, funding and liquidity, ESG, economics, an appendix, investor relations contacts and the disclaimer. Headline FY26 results: net profit excluding Notable Items of A$6,992m (flat), statutory net profit of A$6,813m (down 1%), net interest margin of 1.87%, CET1 ratio of 12.5%, and ordinary dividends of 154 cents per share, fully franked.
Usa a capa desta apresentação como referência de estilo para slides criados a partir do seu próprio conteúdo. Ou escolha qualquer página abaixo para usar o layout dela como referência.
Navegação Rápida
Tags
Compartilhar os slides
Westpac Banking Corporation (ASX: WBC) 2026 Full Year Results Presentation and Investor Discussion Pack, a 154-page investor deck lodged with the ASX on 2 November 2026 covering FY2026, the 12 months ended 30 September 2026. Westpac's financial year runs October to September, so FY26 is 1 October 2025 to 30 September 2026, with halves 1H26 (Oct-Mar) and 2H26 (Apr-Sep). All amounts are in Australian dollars (A$) unless stated, with New Zealand figures in NZD where marked. Following its index page, the deck opens with the results presentation by CEO Anthony Miller and CFO Nathan Goonan (pages 3-41), then the Investor Discussion Pack (from page 42) with sections on earnings drivers, the UNITE transformation program, supporting customers, segment performance, credit quality and provisions, capital, funding and liquidity, ESG, economics, an appendix, investor relations contacts and the disclaimer. Headline FY26 results: net profit excluding Notable Items of A$6,992m (flat), statutory net profit of A$6,813m (down 1%), net interest margin of 1.87%, CET1 ratio of 12.5%, and ordinary dividends of 154 cents per share, fully franked.
Visualização detalhada de cada página de slide, incluindo layout, conteúdo principal e elementos visuais.
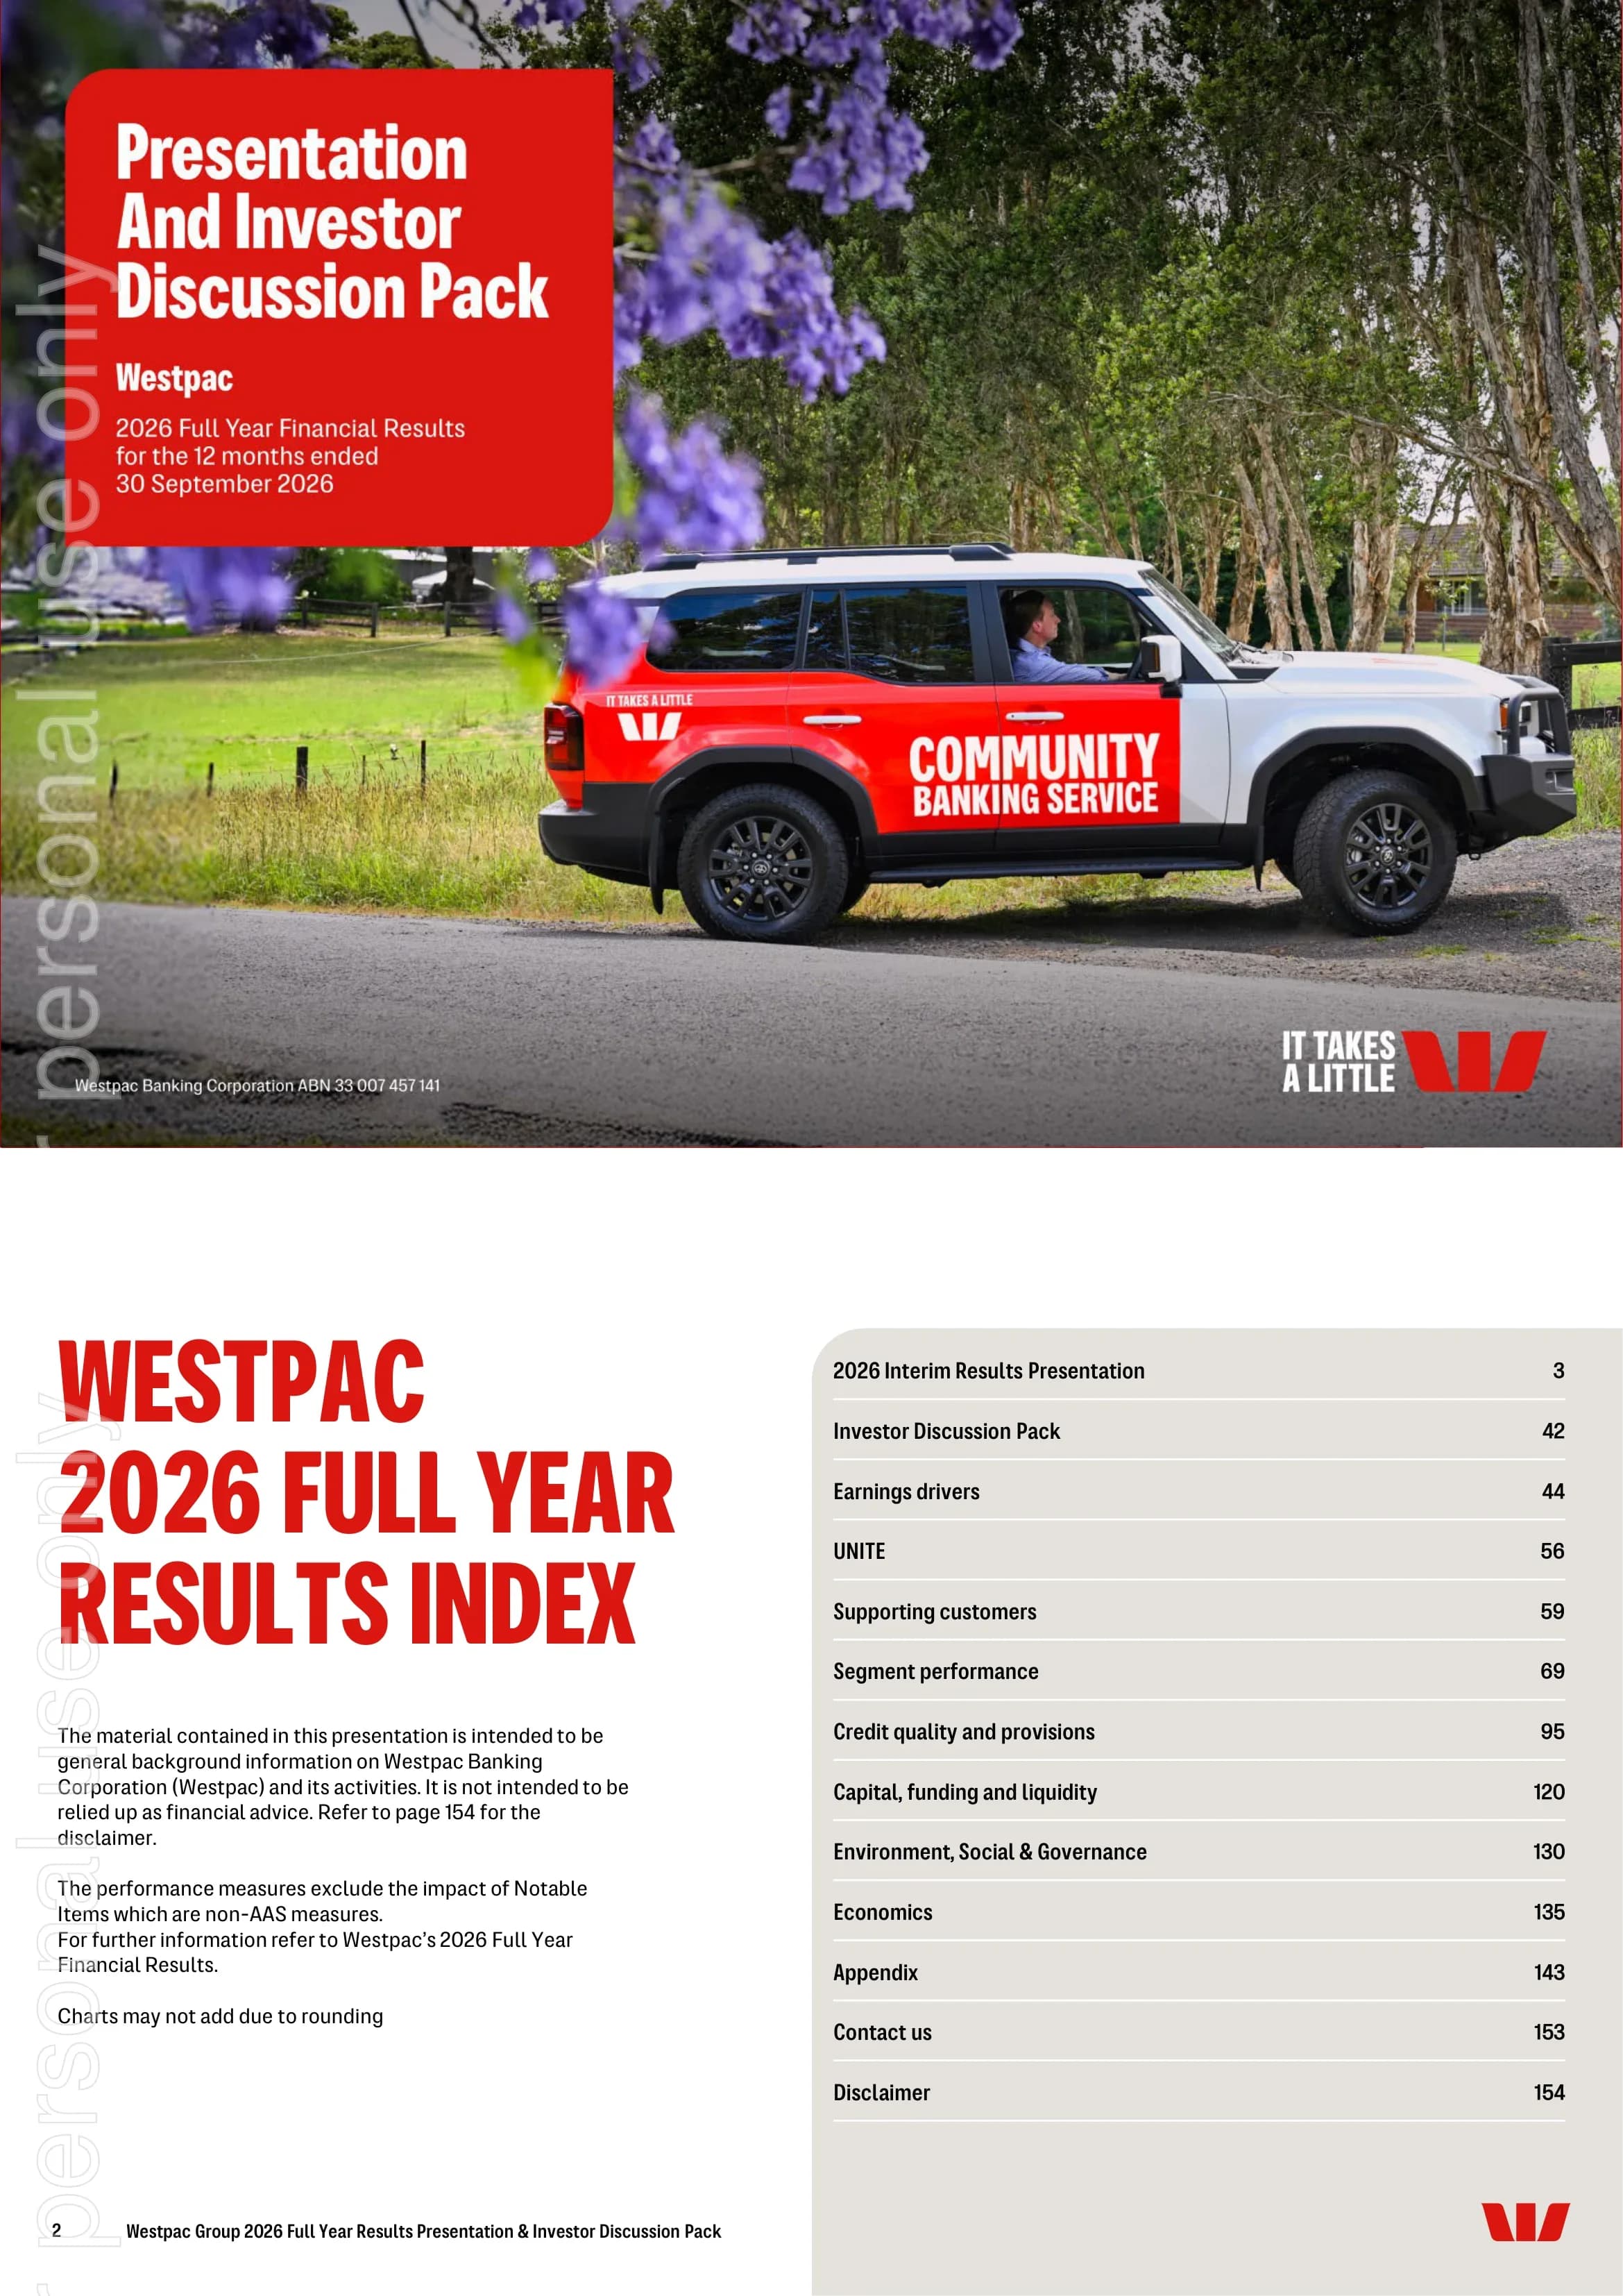
Cover of Westpac's 2026 Full Year Financial Results for the 12 months ended 30 September 2026, titled Presentation and Investor Discussion Pack.
Full-bleed photo of a red and white Westpac Community Banking Service vehicle under jacaranda trees, with a red rounded title panel in the top left.
Index listing the results presentation (page 3), Investor Discussion Pack (42), Earnings drivers (44), UNITE (56), Supporting customers (59), Segment performance (69), Credit quality and provisions (95), Capital, funding and liquidity (120), ESG (130), Economics (135), Appendix (143), Contact us (153) and Disclaimer (154). It notes that performance measures exclude Notable Items, which are non-AAS measures.
Two-column layout with a large red headline and disclaimer text on the left and a grey rounded table of contents with page numbers on the right.
Section divider introducing CEO Anthony Miller's part of the results presentation, which compares FY26 with FY25 for profit and loss items.
Solid red full-slide background with the speaker's name and title centred in white.
Thematic slide setting out the three messages of the result: balance sheet strength, operating momentum and investing for returns.
Dark red background with a 3D red ribbon graphic on the left and three stacked white headings separated by pink rules on the right.
Business investment is now the key source of economic activity (5.9% annual growth by Jun-26 versus 1.9% for government demand). Fuel spending in the Westpac cards tracker rose 23.9% in the latest period, and the forecast housing slowdown (10.9% house price decline) is in line with past cycles.
Four-quadrant chart grid on a light grey background: clustered bar charts for economic activity, the cards tracker, business cashflows by industry and housing cycle comparisons.
FY26 net profit ex Notable Items of A$7.0bn (flat), pre-provision profit of A$10.9bn (up 4%), deposit growth of 6% to A$766bn, ordinary dividends of 154cps (up 1%), ROTE of 11.1% (up 14bps), cost-to-income ratio of 51.9% (down 116bps), loan growth of 5% to A$901bn, and CET1 of 12.5% (19.3% internationally comparable).
Grid of eight KPI tiles in two rows of four, each with a large red figure, a label and a white comparison box with an up or down arrow.
Growth by division: Consumer balance sheet up 7%, revenue up 2% and pre-provision profit up 5%; Business & Wealth up 7%, 7% and 11%; Institutional up 16%, 6% and 8%; New Zealand balance sheet up 5%, revenue flat and pre-provision profit down 5% (in NZD).
Table-style matrix with four division rows and three metric columns, each cell showing a circled arrow and a large percentage in dark red.
Consumer has a 15.5% MFI share, 619 branches and 33% of pre-provision profit; Business & Wealth has a 19.2% MFI share, about 1,700 bankers and 34% of PPP; Institutional has a 33% public sector deposit share, ranks #1 in AUD bonds and ABS, and contributes 21%; New Zealand has a 17% lending share, a 17% deposit share and contributes 12%.
Four vertical columns in graduated red shades, each topped by an icon and division name and followed by three stacked large statistics.
More than 190k customers were helped to buy a new home, Westpac set a A$100bn 2030 housing target, and it provided about 42,000 hardship and disaster relief packages, A$183m in community investment and about A$4m in education grants. Customer scam losses fell 23% versus FY25.
Three-by-three grid of white tiles on a light grey background, each with a large red or dark red statistic and caption, plus one typographic Supporting Grassroots Sport tile.
Westpac's strategic framework of Performance, Customer, People, Risk and Transformation, linked to five priorities: strong balance sheet and growth, customer service and advocacy, deposits and proprietary lending, whole of bank to the customer, and transform and simplify.
Five-segment pie wheel in magenta, red, purple and dark red around a central Westpac logo, with five white pill-shaped priority labels stacked on the right.
CET1 capital ratio of 12.5% (up 3 ppts over 10 years) and a deposit-to-loan ratio of 85.5% (up 15 ppts). Lending grew 7% in housing, 12% in business and 18% in institutional, while deposits grew 7% in household, 4% in business and 14% in institutional.
Left grey panel with paired bar charts for capital and deposit funding; right side with two bar charts for lending momentum and deposit growth by segment.
Engaged workforce with an employee engagement score of 81 and 195 processes simplified; future skills with #1 Copilot adoption in Australia and 95% of employees using AI tools monthly; and a 4% increase in frontline bankers, supported by targeted banker learning.
Three horizontal red bands of graduated shades, each with a large heading and chevron, a white rounded description box and two statistics columns.
The ADAPT data platform provides one governed data foundation, Westpac Intelligence connects data and AI for 5x faster model build and deployment, and smarter experiences deliver 6x faster activation of customer insights across the mobile app, digital banker and digital contact centre.
Three-column flow with icons and headings (ADAPT, Westpac Intelligence, Smarter experiences) linked by chevron arrows, each anchored by a red statistic box at the bottom.
Time to open a Choice account was halved and there were 100,000+ Book a Banker appointments since Feb-26. Digital customers are 4x more active, 35% more likely to be MFI customers and 65% cheaper to serve; Consumer NPS rose 4 points (rank #2), Business 4 points (rank #3) and Institutional RSI 12 points.
Upper left list of simpler-banking stats, upper right four circular KPI cards, and a bottom Stronger advocacy band with three red score boxes.
Westpac grew high-quality deposits by 30% since Sep-22, ahead of peers at 18%, 20% and 8%. Consumer digital sales reached 81%, 87% earned the behavioural savings bonus rate, Business transaction balances were 44% of deposits, and Institutional operational deposits grew 20%.
Left vertical bar chart comparing WBC with three peers; right grid of nine statistic tiles grouped by Consumer, Business & Wealth and Institutional, each with a white pill label.
Mortgage balances grew 7% from A$497bn (2H25) to A$532bn (2H26), with the system multiple moving from 0.8x to 1.0x. Proprietary flow rose to 37.2% for the Group and 42.4% for the Westpac brand, and proprietary customers hold 3.3 products versus 2.8 for third-party customers.
Left bar chart with a system multiple line overlay and a products-per-customer bar chart; right grey panel with a bulleted focus-areas list and a dual line chart.
74% of new business lending came from existing customers, new proprietary lending rose 2ppts to 55%, lending revenue grew 8%, Global Investment Services FUA rose 18% and FX clients grew 7%. BizEdge has processed A$20.3bn of applications with 45% faster decisions, and the program completes in FY29 at a total investment of about A$300m.
Top row of five KPI figures; bottom left horizontal bar chart of target-sector growth; bottom right BizEdge progress shown as a row of coloured circle badges.
81% of new Institutional lending came from existing customers, 82% is investment grade, lending revenue grew 13%, Debt Capital Markets income rose 27% and FX clients grew 10%. Loan growth was led by Resources (34%) and Infrastructure (32%). Westpac One payments integration is complete and the program completes in FY28 at about A$300m.
Top row of five KPI figures; bottom left horizontal bar chart of loan growth by sector; bottom right Westpac One progress panel with three line icons.
Four risk pillars: credit risk (disciplined underwriting, resilient credit quality), operational risk (simplified processes, more automated controls), responsible AI (safe deployment with embedded governance) and cyber (ongoing investment in resilience and customer protection).
Four equal columns with large headings and descriptions on grey, each anchored by a red or dark red outcome block at the bottom.
UNITE objectives: products reduced by more than 70%, more than 700 processes simplified and more than 180 applications decommissioned. Of the initiatives, 9 are complete and 47 remain; FY26 progress was 59% of Simplify milestones, 31% of Implement milestones and 19% of apps decommissioned.
Objectives tiles at top left, FY26 achievements and a traffic-light status bar at top right, and four donut charts by project stage along the bottom.
Migrating St.George data to ADAPT with AI-accelerated logic migration, more than 2 years ahead of plan. The initiative now costs about A$35m (down from about A$70m) and delivers direct benefits of about A$15m a year, with decommissioning planned for FY27.
Three red banner blocks across the top and an Expected outcomes panel below with three icon-led columns of bullet points.
Catalyst moves from yearly funding, slow execution and siloed teams to persistent funding, faster speed to market and teams closer to customers, through 21 new end-to-end delivery units that aim to improve service, reduce reliance on third parties and support a lower cost-to-income ratio.
Three before-and-after rows with pink left blocks and dark red right blocks joined by angled arrows, plus a right-side grey panel with bulleted Delivery Units and Objectives.
Section divider introducing CFO Nathan Goonan's financial review, which compares 2H26 with 1H26 unless otherwise stated.
Solid red full-slide background with the speaker's name and title centred in white.
Statutory net profit of A$6,813m (down 1%) after A$179m of Notable Items; net profit ex Notable Items of A$6,992m (flat); EPS of 205c; revenue of A$22.7bn (up 1%); expenses of A$11.8bn (down 1%, or up 1% excluding the FY25 restructuring charge); pre-provision profit of A$10.9bn (up 4%); and impairment charges of 10bps of average loans versus 5bps.
Clean three-column comparison table (FY25, FY26, Change) with the FY26 column shaded grey and thin red rules.
Net profit ex Notable Items rose 1% from A$3,483m in 1H26 to A$3,509m in 2H26: net interest income added A$161m and impairment A$22m, offset by non-interest income (A$21m), expenses (A$121m) and tax (A$15m). Pre-provision profit was flat.
Waterfall chart with dark red start bars, red and pink movement bars and a red ending bar, with grey arrows labelled Down 1% and Up 1%.
Customer deposits grew 3% from A$745.2bn at Mar-26 to A$766.2bn at Sep-26, with term deposits adding A$10.1bn, savings A$5.6bn, mortgage offsets A$3.4bn and transaction A$3.3bn, partly offset by New Zealand (A$1.4bn) in A$ terms.
Waterfall chart from Sep-25 to Sep-26 with grey callout boxes breaking down each movement by segment.
Loans excluding RAMS rose 3% in the half from A$871.7bn to A$901.3bn, driven by mortgages (A$14.2bn), business (A$8.9bn) and institutional (A$7.1bn), with New Zealand down A$0.5bn in A$ terms (up NZ$2.5bn) and personal down A$0.2bn.
Waterfall chart with dark red opening bars, movement bars and a red closing bar, plus grey arrows showing 4% and 3% growth.
Operating income rose 1% from A$11,284m in 1H26 to A$11,424m in 2H26, with balance sheet growth adding A$341m, core NIM reducing it by A$111m, fees and wealth adding A$35m, NZD movement reducing it by A$60m and Treasury and Markets by A$65m. Income was up 2.3% excluding NZD and T&M.
Waterfall chart with grey callout boxes for fee and Treasury details and an annotation bracket.
Group NIM declined from 1.89% in 1H26 to 1.86% in 2H26, with core NIM down from 1.78% to 1.75% and Treasury & Markets steady at 0.11%; loans cost 4bps and deposits 1bp. Sensitivities: a 25bps RBA rise adds about 1bp annualised on unhedged deposits and capital.
Stacked-bar NIM waterfall with grey callout boxes above, and a grey panel below with Key considerations 1H27 and Sensitivities bullet lists.
Investment rose to 9.4% of revenue in FY26 (from 8.1% in FY24), with cash investment spend of A$2.5bn versus a peer average of A$2.0bn. Productivity savings stepped up from A$400m (FY25) to A$581m (FY26), targeting more than A$600m in FY27.
Bullet list at top left, investment spend bar chart at bottom left, and a right grey panel with two bar charts for investment as a percentage of revenue and productivity savings.
Expenses rose 1% from an adjusted A$11,643m (after removing the A$273m FY25 restructuring charge) to A$11,781m, driven by staff costs (A$347m), technology (A$95m) and investments (A$273m), offset by A$581m of productivity. FY27 cost growth is expected to be similar to FY26.
Expense waterfall with grey callout boxes above and a grey Key considerations FY27 panel with two bullet columns below.
Investment spend rose 11% from A$1,918m to A$2,135m, with 68% expensed (60% in FY25), the capitalised software balance down to A$2,135m and amortisation of A$1,006m. For FY27 Westpac expects about A$2.1bn of spend, about 70% expensed, and UNITE spend of A$850m to A$950m.
Left comparison table (FY25 vs FY26) with an FY27 considerations box; right stacked bar chart by category (Risk & regulatory, Growth & productivity, UNITE).
Stressed exposures were 1.17% of TCE at Sep-26 (1.28% at Sep-25), Australian mortgage 90+ day delinquencies were 0.67% and 30+ day delinquencies 1.24%, and stressed exposures are shown by industry sector.
Top left stacked bar chart of stressed exposures, top right line chart of mortgage delinquencies since Sep-21, and a bottom clustered bar chart by industry sector.
Total provisions were A$5,198m at Sep-26 (A$5,199m at Mar-26), including A$347m of overlays (up A$65m) and an IAP of A$658m. Provisions to gross loans were flat at 0.58%, CAP to credit RWA was 1.27%, and the base case assumes 1.5% GDP growth and 4.7% unemployment in 2026.
Stacked bar chart of provisions by stage with magenta pointer labels on the left; right grey panel with key movement bullets, arrow icons and a base-case versus downside forecast table.
LCR averaged 137% in 4Q26 and NSFR was 113%, both above the 100% regulatory minimum. The deposit-to-loan ratio rose to 85.5%, LCR deposits totalled A$588bn, and Westpac raised A$40bn of new long-term funding in FY26.
Left panel with bullet summary and a three-bar deposit-to-loan chart; right side with an LCR/NSFR bar chart with a dashed minimum line and a donut chart of LCR deposit mix.
CET1 moved from 12.42% at Mar-26 to 12.46% at Sep-26: net profit added 74bps and the RAMS sale 23bps, offset by the 1H26 dividend (57bps), RWA (28bps), IRRBB (5bps) and other (3bps). The share buyback represents 22bps.
CET1 waterfall chart with a callout for RWA drivers and a grey bottom panel with Other considerations and Sensitivities.
Westpac's target CET1 ratio is above 11.25% and it holds A$2.9bn of capital above target after the 2H26 dividend. The 2H26 payout ratio was 75.0% (target range 65-75%), FY26 ordinary dividends were 154 cents (77c interim and 77c final), the dividend yield was 4.4% (6.3% fully franked), the on-market buyback was extended and the DRP neutralised.
Left six-tile grid of capital metrics on beige and grey; right stacked bar chart of dividends per share from FY23 to FY26.
Section divider returning to CEO Anthony Miller for progress measures, the macroeconomic outlook and priorities.
Solid red full-slide background with the speaker's name and title centred in white.
Sep-29 targets compared with Sep-26 status: Consumer NPS #2 (target #1), Business NPS #3 (#1), Institutional RSI #3 (#1), UNITE spend to date of A$1,744m, employee engagement of 81 (target top decile), cost-to-income 4.5ppts above peers (target below the peer average) and ROTE 1.8ppts below peers (target above).
Scorecard table with three coloured left-side category blocks (Service Excellence, One Best Way, Perform) and Metric, Sep-26 and Sep-29 Target columns.
Business investment is strong on the back of the energy transition and data centres, and households are resilient. The current housing cycle (Mar-26 to 2027f) implies a 10.9% house price decline and a 25% fall in turnover; housing credit growth is forecast at 3.8% in FY27 and 5.3% in FY28, and business credit at 7.0% and 6.3%.
Bullets at top left, real capital expenditure line chart with shaded investment cycles at bottom left, and housing cycle and credit forecast tables in a right grey panel.
FY27 focus areas to drive value creation: UNITE milestones, cost discipline to support investment, service excellence to improve advocacy, proprietary growth and deposits, and momentum in Business and Institutional.
Five-segment strategy wheel with the Westpac logo on the left and five white pill-shaped focus areas under a red headline on the right.
Divider opening the Investor Discussion Pack, which compares 2H26 with 1H26 for profit and loss items unless otherwise stated.
Solid red background with very large white condensed title text.
Net profit ex Notable Items of A$7.0bn, statutory A$6.8bn, NIM of 1.87% (1.94% in FY25), expense-to-income of 51.9% and ROTE of 11.1%. Deposits grew A$43bn and loans A$45bn; the deposit-to-loan ratio was 85.5%, CET1 12.5% and LCR 137%. Impairment charges were 10bps, stressed assets 1.17% of TCE and mortgage 90+ day delinquencies 0.67%.
Three-column panel (Solid financial performance, Strong balance sheet, Sound credit quality) with metric rows and white value boxes showing current and prior figures.
Section divider for the Earnings drivers section of the Investor Discussion Pack.
Solid red background with large white title and a small 3D ribbon graphic at the bottom.
Net profit rose 1% from A$3,483m to A$3,509m, as net interest income added A$161m on 3% AIEA growth while core NIM fell 3bps, and expenses rose A$121m on wage and technology inflation and UNITE investment.
Waterfall chart with grey callout boxes explaining each driver and a grey Up 1% arrow.
FY26 net profit was flat at A$6,992m versus A$6,972m: net interest income added A$214m (AIEA up 5%, core NIM down 5bps), non-interest income A$30m, expenses A$135m and tax A$81m, offset by higher impairment charges (A$440m) from the revised economic outlook and new IAPs.
Year-on-year waterfall chart with grey callout boxes and a Flat arrow.
Statutory net profit of A$6,813m in FY26 (A$3,414m in 1H26 and A$3,399m in 2H26) is reconciled to A$6,992m ex Notable Items, after A$179m of Notable Items (A$104m of large items and A$75m of hedging items). Statutory EPS was 199.3c and EPS ex Notables was 204.5c.
Left policy bullets and a Notable Items table; right reconciliation table with the FY26 column shaded.
Loans grew to A$901bn (66% housing; 60% Consumer by segment) and customer deposits to A$766bn (28% term, 33% savings, 18% transaction; 51% Consumer by segment).
Two rows, each with a three-period bar chart followed by two donut charts by type and by segment with centre totals.
Balances paying 401bps or more rose to A$395bn at Sep-26 from A$252bn at Sep-25, while balances paying 201-400bps fell to A$67bn from A$158bn. By division, Consumer holds A$210bn in the 401bps+ band and Institutional & GBU A$129bn.
Two clustered bar charts stacked vertically: Group balances by rate band over three periods and divisional balances by rate band.
The Group capital hedge is A$56bn over 3 years (Sep-26 spot rate 3.96%), the domestic deposit hedge A$92bn over 5 years (3.92%) and the WNZL hedge NZ$13bn. Hedge income grew from A$1.0bn in FY2022 to A$5.6bn in FY2026, with indicative outcomes of A$6.0bn in FY2027 and A$6.5bn in FY2028.
Left hedge summary table and a bar-plus-line chart of hedge income; right panel with hedge rate tables and two line charts against BBSW and BKBM.
Treasury and Markets income was A$889m in 2H26 versus A$954m in 1H26 and a five-year average of A$933m, comprising Treasury A$411m and Markets A$478m. Markets income included A$331m from FX, commodities and carbon.
Four stacked bar charts in a two-by-two grid: by segment, by type, Treasury income and Markets income.
Fees were A$888m in 2H26 (A$864m in 1H26), wealth management A$262m and trading and other income A$350m (down from A$409m). Institutional non-interest income was A$681m and Business & Wealth A$383m.
Clustered bar chart by type at top left, net fee income waterfall by segment at top right and clustered bar chart by segment along the bottom.
Expenses rose 2% from A$5,830m in 1H26 to A$5,951m in 2H26, with staff costs adding A$236m, technology A$44m, volume A$28m and investments A$136m, offset by A$323m of productivity savings. 1H26 had been 6% lower than 2H25 (2% excluding restructuring).
Waterfall chart with grey callout boxes above each driver and two grey arrows.
Investment spend rose to A$1,216m in 2H26 (A$919m in 1H26), with UNITE A$536m; A$814m was expensed and A$402m capitalised. Investments through the P&L totalled A$1,293m, and the capitalised software balance is A$2.1bn, compared with three peers.
Two-by-two grid of stacked bar charts plus a multi-line peer comparison chart of capitalised software balances.
2H26 impairment charges of A$421m (A$443m in 1H26) comprised new IAPs of A$264m, IAP write-backs of A$115m, net CAP charges of A$378m and recoveries of A$106m. The impairment charge was 10bps of average loans and stressed exposures were 117bps of TCE.
Top row of five small grouped bar charts with coloured headings; bottom grey panel with a dual-axis line chart from 2010 to 2026.
Section divider for UNITE, Westpac's technology simplification program.
Dark red background with large white UNITE title and a magenta ribbon accent.
330 invoice finance facilities were migrated to a new platform, completed in 2H26, with a 24/7 self-serve portal, drawdowns in under about 15 minutes and up to about 50% faster applications. The initiative cost about A$10m and delivers direct benefits of about A$3m a year.
Three red banner blocks across the top and an Expected outcomes panel with three icon-led columns.
Five initiatives complete in FY29: mortgage simplification (about A$290m cost, about A$70m in benefits), digital banker (about A$165m), AssistNow collections (about A$130m, about A$40m), One Commercial Bank (about A$230m, about A$40m, migrating about 75,000 accounts) and debit card simplification (about A$45m, about A$15m, reducing 34 products to 2).
Dense table with red row headers for each initiative, objective, outcome and achievement columns, and red and dark red cost and benefit tiles on the right.
Section divider for the Supporting customers section.
Dark red background with very large white title and a red ribbon accent in the corner.
Westpac spent about A$330m supporting access to cash, has Australia's largest fee-free ATM network (more than about 6,350 ATMs) and 619 branches plus 3,300 Bank@Post locations, and prevented A$360m of potential scam losses. It has 13m customers and 6m digitally active customers, and ranks #2 for Consumer and Business MFI.
Four text columns with large headings on grey, and a Key highlights band of four red-shaded statistic tiles below.
Personalised deposit offers reached 500k customers in 2 weeks with more than 2x account uptake, smart digital leads drove 20k conversations and a 4.5x increase in settlements, and a personalised intelligence pilot with 60 bankers has 100% support for expansion.
Three rounded grey cards, each with a description and two large red statistics.
AI use cases: home loan document automation (about 100k banker hours), consumer finance payslip automation (about 50k hours), an AI website search engine (75% more first-result selections), AI-enabled data migration (2 years faster), AI-assisted BizEdge development (68% higher productivity) and Instant Answers (43% fewer escalations).
Two-by-three grid of grey tiles, each with a red heading, description, chevron and a white rounded result pill.
Westpac reports 6.8M daily customer logins, 1.2M customers using money management tools and A$147M rewarded to customers. There were 1.1bn mobile wallet payments, 81% of sales originated digitally, and digital customers are 4x more active.
Top band of three red statistic banners, left mobile app screenshots and right pink panels with circular engagement stats and digital payment figures.
Consumer digital sales rose to 81% in FY26 (51% in FY24) and Business digital sales to 54% (26%), with Online Banking NPS up 13 and Mobile App NPS up 23 under an integrated service model running from digital self-service to face-to-face.
Left inverted funnel diagram of service tiers with volume arrows; right line chart of digital sales and two circular NPS badges.
Westpac's security tools: SafeCall (available to about 1.1 million customers), Verify (A$5.7m of scam losses averted), SaferPay (more than 1.2m transfers challenged, A$135m averted), SafeBlock (more than 490,000 blocks) and the JESS AI assistant (about 1,200 calls a day).
Five vertical columns in graduated grey shades, each with a red line icon, product name, subtitle and bullet details.
Customer-reported scam losses were 23% lower than FY25 and 57% lower than FY23, with prevention saving A$360m in FY26, including A$55m from behavioural tools and A$136m from blocking more than 945k online merchant incidents.
Dual line chart of scam cases and net losses from Sep-24 to Sep-26 annotated with milestone labels, above three icon-led statistic columns.
Westpac's layered cyber model covers employees, customers and suppliers around core security and system security protecting data, all supported by 24/7 monitoring, AI-driven anomaly detection and threat intelligence partnerships.
Central semicircular layered diagram (Customers, Employees, Suppliers, Core Security, System Security, Data) flanked by descriptive cards on both sides.
Responsible AI principles embedded through three layers: educate (Board, executive and employee training), govern at scale (use-case visibility, automated risk assessment with human accountability) and protect and defend (data controls, cyber and third-party risk monitoring).
Left stacked bullet sections; right large nested-circle diagram in three red shades.
Section divider for segment results across Consumer, Business & Wealth, Institutional and New Zealand.
Solid red background with large white two-line title and a ribbon accent.
Focus areas for each division, with contributions to pre-provision profit: Consumer 33%, Business & Wealth 34%, Institutional 21% and New Zealand 12%.
Four columns with icons and bullet focus areas on graduated grey backgrounds, each anchored by a red contribution percentage band.
The Consumer division has about 10m customers, more than 3,650 bankers, 619 branches and about 6,400 ATMs (the largest fee-free network). It ranks #2 for MFI, NPS and brand consideration, and 81% of its sales are digital.
Two-by-four grid of white tiles with large red statistics and captions.
Consumer pre-provision profit rose 7% to A$1,836m while net profit fell 1% to A$1,117m. The cost-to-income ratio improved 260bps to 57.0%, NIM fell 9bps to 1.72%, and impairment charges rose to A$238m (9bps).
Four-quadrant chart page: profit bars, cost-to-income bars, NIM bars and an impairment bar-and-line chart, each with grey trend arrows.
Consumer MFI share was 15.5% at Sep-26. New-arrival transaction sales rose 3%, youth and family sales 20%, affluent customers with 3+ products 16%, and small business NPS gained 4 points from FY25 to FY26.
Left panel with an NPS line chart and MFI bars; right four mini bar charts with arrows and a red callout tile.
Consumer deposits grew to A$390bn at Sep-26 (from A$365bn), transaction accounts rose 6% to 8,749k, savings reached A$192bn, and 87% of behavioural savers earned the bonus rate.
Four charts: clustered bars of household deposit system multiples, transaction account bars, stacked deposits by type and a savings mix bar-and-line chart.
The mortgage book grew to A$532bn (A$311bn first party, A$221bn third party). The system multiple was 1x in 2H26 and the RBA owner-occupier variable margin 1.89%, with proprietary median time to decision of 3.9 days and Westpac-brand first-party flow at 42.4%.
Four charts: stacked mortgage balance bars, system multiple bars with a margin line, proprietary flow line chart and time-to-decision clustered bars.
FTE per 1,000 customers fell 10%, digital sales rose 76% to 0.81m (81% of total sales), settlements per banker rose 3%, and digitally active customers grew 5% to 6.0m.
Four bar charts in a two-by-two grid with large white or grey trend arrows.
Business Banking has 1.0m customers, A$128bn of loans and A$145bn of deposits, and ranks #3 for NPS and #2 for MFI. Wealth has 378k customers and A$171bn of FUA, and Pacific has 320k customers and A$2bn of loans.
Three-panel red layout (Business Banking, Wealth, Pacific) with white rank tiles, icons and large statistics.
Business & Wealth pre-provision profit rose 13% to A$1,913m and net profit 12% to A$1,230m. Cost-to-income fell 3ppts to 42.3%, NIM was 4.60%, and impairment charges fell to A$156m (25bps).
Four-quadrant chart layout covering profit, cost-to-income, NIM and impairment, with trend arrows.
Business NPS ranks #1 in SME and #3 in small business and commercial. Westpac Group's business MFI share is 19.2% versus peers at 26.7%, 18.7% and 17.3%, and average needs met per connection range from 3.5 to 4.8.
Customer advocacy panel with an NPS line chart and rank badges, a customer depth bar chart and a bottom bar chart of needs met.
Business & Wealth deposits grew 3% to A$157bn (45% transaction, 36% term, 19% savings) and new transaction account sales rose 33% to 158k in FY26.
Bar charts for account sales and deposit growth plus two donut charts by type and by segment.
Business lending balances rose 12% to A$128bn and revenue 8% to A$1,261m, the first-party mix rose 2ppts to 55%, and target sectors grew strongly: agriculture 21%, health 16% and professional services 13%.
Left stacked channel mix bars and balance and revenue bars; right two horizontal bar charts for sub-segment and sector growth.
BT Panorama FUA rose 19% to A$158.3bn, including A$16.2bn migrated from Asgard, and Global Investment Services FUA rose 18% to A$12.8bn. Managed accounts penetration reached 22.5% and cost per FUA improved 23%.
Two panels (BT Panorama and Private wealth), each with a bar chart and a grid of icon-led award and metric cards.
Average time to decision was 6.1 days in 2H26, first-time-right rose to 73%, business lending cost per deal fell 6%, and lending per banker rose 11% while deposits per banker rose 3%.
Grey left panel with two bar charts and a right side with cost-per-deal and banker productivity bar charts with arrows.
Institutional operational deposits rose 20%, lending 18% and Debt Capital Markets income 27%, with Westpac One live in pilot. The division ranks #1 in public sector deposits, project finance and renewables, AUD bonds and ABS, and economics and research.
Two rows of four white tiles with large red figures and captions.
Institutional pre-provision profit rose 5% to A$1,196m and net profit 12% to A$895m. Cost-to-income was 42.3%, NIM ex markets was 1.84%, and there was an A$9m impairment benefit (1bp).
Four-quadrant chart layout with profit bars, cost-to-income bars, NIM bars with a risk-adjusted margin line, and impairment bars and line.
Institutional lending rose 18% to A$138bn and net interest income 17% to A$840m. Compound annual lending growth was 15% over 5 years, 81% of new lending was with existing customers and 82% was investment grade.
Left stacked list of three highlighted statistics and bar charts; right portfolio mix donut and horizontal sector growth bars.
Institutional deposits rose to A$150bn (from A$131bn) and operational deposits grew 20% to 68%. Westpac ranks #1 in public sector deposits, superannuation deposits rose more than 200%, and it was first to offer real-time processing for super.
Left highlight list and operational deposits bar chart; right stacked deposit bars and horizontal sector growth bars.
Westpac ranks #1 bond house in Australia and New Zealand, and #1 in institutional FX and corporate derivatives. Debt Capital Markets income rose 27% to A$138m, markets income was A$478m in 2H26, and Westpac led AUD bond issuance (A$33bn) and AUD securitisation (A$15bn).
Rank list rows, a stacked markets income chart, a DCM income bar with an arrow and two league-table bar charts.
Account opening time fell by more than 50%, FX client activation time by 32% and change velocity rose 27%. Revenue per banker was A$5.6m, lending per banker A$186m and deposits per banker A$201m.
Left highlighted list rows and a lending-per-banker bar chart; right grey panel with revenue and deposits per banker bar charts.
Westpac NZ has about 1.5m customers and about 1,600 bankers, ranks 2nd in Corporate NPS, has migrated 100% of business customers to Westpac One Business, grows at 1.3x system in household deposits and 1.0x in business lending, scores 80 for employee engagement and lifted strategic investment 62%.
Two rows of four rounded red tiles with white icons and large statistics in graduated shades.
In NZD, pre-provision profit fell 13% to NZ$747m and net profit 19% to NZ$542m. Cost-to-income rose 4ppts to 50.8%, NIM fell 22bps to 2.17%, and there was a NZ$4m impairment benefit.
Four-quadrant chart layout covering profit, cost-to-income, NIM and impairment, with trend arrows.
Westpac NZ's consumer NPS was 15 at Sep-26 versus peers between 25 and 39, and business blended NPS was 25. Consumer channel rankings are #3 for ATM, #4 for website and #5 for contact centre, and relationship management ranks #2 Institutional, #2 Corporate and #4 Agribusiness.
Two clustered bar charts comparing Westpac with peers, above two ranked lists with red rank badges.
NZ net loans rose 2% to NZ$112.0bn (67% mortgage) and customer deposits 1% to NZ$84.4bn (49% term deposits; 61% consumer).
Two waterfall-style bar charts on top and three donut charts by loan type and deposit composition below.
NZ highlights: 77% digital adoption, SME onboarding cut from 17 days to about 1 day, mortgage turnaround from 8+ days to same day, 50% fewer major technology incidents, and 83% of calls answered within SLA.
Four columns (Digital Adoption, Customer Experience, Productivity, AI and Automation) with icons and divided text rows on graduated grey.
Section divider for credit quality and provisions.
Dark red background with large white title and a magenta ribbon accent.
Reported probability-weighted ECL of A$5,198m compares with A$3,153m under a 100% base case and A$7,471m under a 100% downside, putting provisions A$2.0bn above base case. Scenario weights are 2.5% upside, 50.0% base and 47.5% downside, and overlays rose A$65m for energy-intensive and discretionary sectors.
Scenario bar chart, scenario weighting donut, provision movement waterfall and base case forecast table.
Provisions to gross loans held at 58bps, IAP coverage was 56%, and CAP to credit RWA was 127bps. Stage 2 stressed provisioning rose to 11.49% of TCE, and stage 1 exposures are 90.37% of TCE.
Left stacked 100% bars by stage with callout boxes; right key ratios table and provisioning-to-TCE table.
Total committed exposure was A$1,353,380m at 30 September 2026 (86% Australia), of which 49% is mortgages and 19% is rated AAA to AA-. Top 10 institutional exposures were 1.1% of TCE.
Full-width TCE table by risk grade and region at top; bottom panels with a top-10 exposure bar chart and horizontal bars by rating.
Stressed exposures were 1.17% of TCE at Sep-26 (1.45% at Sep-24), with stress moving from 116bps to 117bps over the half. New and increased individually assessed exposures were A$497m in 2H26, driven by single names in utilities, agriculture and transport.
Stacked bar chart with callout boxes, a segment movement waterfall and a stacked bar chart of new IAP exposures.
Sector TCE and stress at Sep-26: finance and insurance A$162.1bn (0.1% stressed), property A$102.6bn (1.8%), construction A$16.0bn (4.1%), wholesale and retail trade A$38.0bn (3.8%) and manufacturing A$27.5bn (3.7%).
Grey clustered bar chart of stressed exposures by sector over three periods above a detailed sector table.
Transport and storage TCE was A$25.4bn (1.88% of Group) with A$16.4bn of lending; 2.87% is graded stressed and 0.49% individually assessed. 61% is fully secured and 71% is in NSW and ACT.
Metrics table with the Sep-26 column shaded, plus three donut charts for security, sub-sector and geography.
Agriculture TCE was A$31.6bn (2.34% of Group) with A$27.4bn of lending; 3.37% is stressed and 0.20% individually assessed. 89% is fully secured, with dairy at 22% and beef and sheep at 27%.
Metrics table plus three donut charts for security, sub-sector and geography.
Construction TCE was A$16.0bn with A$9.5bn of lending; stress improved to 4.15% from 5.49% a year earlier, while 0.28% is individually assessed. 57% is fully secured and 46% is in NSW.
Metrics table plus three donut charts for security, sub-sector and geography.
Utilities TCE was A$31.4bn with A$15.4bn of lending; the stressed share rose to 0.85% from 0.10% and individually assessed exposures to 0.29%. 77% is electricity, gas and water supply.
Metrics table plus three donut charts for security, sub-sector and geography.
Manufacturing TCE was A$27.5bn with A$14.6bn of lending; 3.66% is stressed and 0.40% individually assessed. 45% is unsecured (mostly Institutional) and food and beverage is the largest sub-sector at 26%.
Metrics table plus three donut charts for security, sub-sector and geography.
Commercial property TCE was A$102.6bn (7.6% of TCE) with A$83.6bn of lending and a median risk grade of BB; 1.78% is stressed, the Australian secured portfolio has a weighted average LVR below 50%, and 84% is fully secured.
Bullet list, a bar chart of exposure share since Sep-24, sub-sector, borrower and region donuts, and a credit quality table.
Accommodation, cafes and restaurants TCE was A$15.3bn with A$13.4bn of lending; 3.28% is stressed and 0.17% individually assessed. 85% is fully secured and 60% is in NSW.
Metrics table plus three donut charts for security, sub-sector and geography.
Retail trade TCE was A$15.5bn with A$10.6bn of lending; stress improved to 3.85% from 5.65% and individually assessed exposures fell to 0.28% from 0.77%. Personal and household goods retailing is 45% of the sector.
Metrics table plus three donut charts for security, sub-sector and geography.
Finance and insurance TCE was A$162.1bn (12.0% of Group) with A$49.0bn of lending and 0.10% stressed. Institutional exposure is mainly securitisation (A$49bn) and subscription finance (A$15bn), all investment grade.
Metrics table, two donut charts by segment and sub-sector, and a bullet list on Institutional exposure.
The Australian mortgage portfolio (ex RAMS) grew to A$531.9bn: 66.5% owner-occupied, 32.8% investor, 13.1% interest-only, 41.6% proprietary and 12.3% first home buyers, with an average loan size of A$365k. 86% of accounts are ahead on repayments.
Left detailed portfolio and flow table; right clustered bar chart by product type and a bar chart by year of origination.
Mortgage 90+ day delinquencies were 67bps at Sep-26 (62bps at Mar-26), 30+ day delinquencies 124bps and hardship 60bps. Properties in possession rose to 172, and the annual mortgage loss rate was 0.7bps.
Left delinquency table with the Sep-26 column shaded; right line chart of delinquencies since Sep-21 and a vintage curve chart.
The portfolio by state is 41% NSW/ACT, 27% VIC/TAS and 16% QLD. Debt-to-income lending of 6x or more at origination fell to 5.9% from 21.7% at Sep-22, and 90+ day delinquencies are tracked by state.
State donut chart, 90+ delinquency line chart by state, DTI bar chart and income band clustered bars.
Weighted average LVR at origination was 70% and dynamic LVR 49%, with new loans at 69%. Offset balances grew to A$81bn from A$52bn at Sep-22, and serviceability is assessed with a 3.0% buffer or a 5.05% floor rate.
LVR band clustered bar chart, serviceability bullet panel, LVR table and offset balance bar chart.
The buffer-to-balance ratio rose to 21.5% at Sep-26 (20.2% at Sep-22); 37% of accounts are more than 2 years ahead, and changes in owner-occupier buffers over 12 months are tracked by balances.
Buffer ratio bar chart, buffer change line chart, accounts-ahead donut, balance-band clustered bars and on-time stacked bars.
Underwriting policy: verified income with shading for less certain income, HEM-based expense floors across 17 categories, serviceability at the customer rate plus 3.0% or a 5.05% floor, 7x DTI referral where LVR is above 80%, a 5% genuine savings requirement and LMI above 80% LVR.
Full-width two-column table with grey row labels (Income, Credit Score, Expenses, Serviceability, Savings, Security, LMI) and bullet text.
Hardship balances were 0.60% of the portfolio, average dynamic LVR was 49% with 0.4% in negative equity, 62% of new hardship accounts received temporarily reduced repayments, and 85% of the portfolio does not require insurance.
Hardship bar chart since Sep-22, dynamic LVR line with negative equity area, and two donut charts.
The interest-only portfolio is A$70bn (13% of mortgages), with I/O expiry spread mostly over 5 years. Investment property loans grew to A$174bn with a dynamic LVR of 49%, an average loan of A$398k and 90+ day delinquencies of 61bps; 72% of investors hold one property.
Stacked bar chart by LVR and income, I/O expiry bar chart, properties-per-customer donut and IPL portfolio table.
Consumer finance lending was A$8.2bn (A$6.3bn credit cards and A$1.9bn personal loans), 0.9% of Group loans, with 90+ day delinquencies improving to 0.91% from 1.13%. Credit card accounts paying the minimum fell to 3.2%.
Portfolio table, delinquency line chart by product, clustered bars by product and a bar chart of minimum-repayment accounts.
The NZ mortgage portfolio was NZ$74.5bn with 90+ day delinquencies of 0.42% and 89% at LVR below 80%. Unsecured consumer 90+ delinquencies were 0.94%, and business stressed exposures were 1.9% of business TCE.
Left mortgage portfolio table; right two delinquency line charts, an LVR bar chart and stacked business stress bars.
Section divider for capital, funding and liquidity.
Dark red background with large white three-line title and a ribbon accent.
Level 2 CET1 was 12.46% at Sep-26. Key ratios: Tier 1 14.3%, total capital 21.5%, RWA A$462bn, leverage 5.0% and Level 1 CET1 12.8%; on an internationally comparable basis CET1 is 19.3% and leverage 5.4%.
Left CET1 waterfall chart with a callout box; right key capital ratios table with the Sep-26 column shaded.
RWA rose A$3.8bn (0.8%) to A$462.1bn: lending added A$11.4bn, offset by the RAMS sale (A$7.5bn) and data refinement (A$3.5bn), while credit RWA rose A$1.1bn. IRRBB RWA was A$49bn under the revised APS 117.
RWA waterfall with a dashed box around credit drivers, a stacked IRRBB bar chart and a dual-axis embedded loss line chart.
The APRA CET1 ratio of 12.5% reconciles to 19.3% on an internationally comparable basis, mainly through IRRBB (1.9), residential mortgages (1.6), the RWA scaling factor (0.9) and property finance (0.7); Tier 1 is 21.9% and total capital 32.0%.
Red introductory statement followed by a full-width three-column reconciliation table with item, explanation and percentage-point adjustment.
From 1 January 2027 AT1 is phased out, with CET1 requirements rising from 10.25% to 10.50% and the minimum leverage ratio falling from 3.50% to 3.25%. APRA consultations on credit, liquidity and market risk begin in 2027, and RBNZ reforms from 1 October 2026 set a 12% CET1 requirement.
Three-row table with Implementation, Change and Details columns separated by red rules.
Total capital of 21.5% against an 18.25% requirement (CET1 12.5%, AT1 1.84%, Tier 2 7.2%), with an AT1 and Tier 2 call profile peaking at A$11.8bn beyond FY33. Tier 2 outstanding is 79% callable and 52% USD by currency.
Stacked total capital bars with annotations, a maturity profile bar chart, Tier 2 issuance stacked bars and two donut charts.
Customer deposits are 69% of total funding (74% excluding equity), with a further 20% from long-term wholesale and equity. NSFR was steady at 113%, and the balance sheet movement chart shows A$43bn of customer deposit growth funding A$45bn of loan growth.
Stacked 100% funding mix bars by maturity, an NSFR waterfall and a balance sheet movements waterfall.
The September 2026 quarterly average LCR was 137%, with A$192bn of HQLA against A$140bn of net cash outflows. HQLA is 55% Australian government and semi-government bonds, and stable retail and SME deposits rose 44% to A$214bn since Sep-22.
LCR bar chart, LCR movement waterfall, HQLA donut and stacked deposit quality bars with growth labels.
Indicative wholesale funding spreads are shown by tenor for AUD and USD. The long-term back book is 52% senior bonds, 23% covered bonds and 20% Tier 2, and the short-term book is 48% certificates of deposit and 45% commercial paper, with AUD and USD each at 35% of the long-term book.
Line chart of funding costs by tenor and three horizontal bar charts of back book composition.
Term debt issuance was A$40bn in FY26 (53% senior bonds, 43% AUD, 50% at 5 years), with a weighted average maturity of 5.5 years versus 4.9 years for FY23-25, and maturities of A$31bn in FY27.
Stacked issuance and maturity bar chart split by a dashed line, above three donut charts by program, currency and tenor.
Section divider for ESG.
Solid red background with large white title and a ribbon accent.
Westpac's sustainability strategy covers climate transition (remained #1 financier to renewable projects in Australia), housing affordability (A$100bn housing finance target by 2030) and regional prosperity (branch moratorium extended to 2030, community banking expanded to a further 14 communities).
Red banner headline, vertical What, Focus areas and Progress labels on a dark red side strip, three columns and pill links to material topics.
Westpac has 13 financed emissions sector targets: for example, power generation is down 50% against a 62% target, thermal coal mining is down 100%, and commercial real estate is down 28% against a 59% target. Sustainable finance lending reached A$46.5bn and bond facilitation A$32.0bn against 2030 targets of A$55bn and A$40bn.
Left emissions targets table; right customer climate transition plan ratings table and sustainable finance bar chart.
Westpac's housing target is to finance A$100 billion by 2030 to increase housing supply in Australia, across social and affordable housing, opportunities for renters and pathways to home ownership.
Two red headline boxes at top and a housing continuum diagram of circular red icons with curved arrows and three category labels.
Employee engagement was 81 as at July 2026 (91% participation, top quartile globally). Women make up 46% of the Executive Team and 40% of Senior Leaders, the like-for-like gender pay difference is 2% and the median gender pay gap is 26.5%.
Three text columns with a large 81 callout, bullet sections and a gender diversity table.
Section divider for the economics section.
Dark red background with large white title and a ribbon accent.
Average monthly mortgage applications fell 15% to 28k in 4Q26 from 33k in 4Q25 (up 4% on the 27k five-year average), and real housing credit growth is slowing as real house prices weaken.
Bar chart with arrows, a multi-year monthly line chart and a long-run dual-axis line chart with shaded periods.
System deposits reached about A$3.5 trillion at Sep-26 (51% households), with household deposits growing A$65bn in 2H26, alongside annual deposit system growth by sector.
Stacked bar chart of system composition, clustered bars of half-yearly growth and a multi-line annual growth chart.
Westpac forecasts an Australian cash rate of 4.85% at end-2026 falling to 4.35% in 2027, GDP growth of 1.5% in 2026, unemployment of 4.7% and CPI of 4.6%. Housing credit growth is forecast at 4.0% in 2027, and the NZ official cash rate at 3.00% in 2026.
Full-width quarterly forecast table, a credit growth table and a credit growth line chart with a forecast divider.
The current cycle (Mar-26 to Mar-27) is forecast to see a 10.9% price fall and a 25% turnover decline over 12 months, compared with past cycles of 5.5% to 8.6%. Westpac forecasts 2026 dwelling prices down 12% in Sydney and 8% nationally.
Long-run line chart with shaded correction periods above two tables of historical cycles and capital city forecasts.
NZ nationwide dwelling prices are down 1% over 12 months and 13% over 5 years (Auckland down 19%, Wellington down 28%), with a forecast of +2% in 2027.
Combo sales and price chart, regional index line chart, annual growth combo chart and dwelling prices table.
Real per capita disposable income is expected to grow 0.2% in 2026-27F versus 0.4% for consumer spending. The household savings ratio is 6.5%, alongside consumer sentiment and saving buffers by state.
Four charts: clustered bars of income and spending, a sentiment line chart, a savings ratio line and buffer lines by state.
Westpac Business Signal shows commercial cashflows starting to soften and SME cashflow conditions deteriorating through 2026, with quarterly income-to-expense contributions from 2022.
Indexed line chart with annotation boxes above a diverging bar chart with a total line and year bands.
Section divider for the appendix.
Dark red background with large white title and a ribbon accent.
2H26 net interest income was A$9,924m, non-interest income A$1,500m, operating income A$11,424m, expenses A$5,951m, pre-provision profit A$5,473m, impairment A$421m and net profit A$3,509m (up 1% on 1H26).
Income statement table with 2H25, 1H26 and 2H26 columns (2H26 shaded) and a percentage change column.
2H26 net profit by segment: Consumer A$1,117m, Business & Wealth A$1,230m, Institutional A$895m, New Zealand A$447m (in A$) and Group Businesses a loss of A$180m, with half-on-half percentage changes.
Two stacked tables: segment P&L in A$m and 2H26 versus 1H26 percentage changes.
FY26 net profit by segment: Consumer A$2,301m (up 4%), Business & Wealth A$2,367m (up 8%), Institutional A$1,630m (up 3%), New Zealand A$915m (down 16%) and Group Businesses a loss of A$221m.
Two stacked tables: segment P&L in A$m and FY26 versus FY25 percentage changes.
Credit ratings: S&P AA- (senior) and A- (subordinated), Moody's Aa2 and A3 (hyb), and Fitch AA- and A-, all with stable outlooks. ESG ratings: MSCI AA (8.57), Sustainalytics Low Risk (12.7) and ISS ESG C+ (61.31).
Two columns of pink rating cards for the three credit agencies and grey cards for the three ESG raters.
Definitions of expected credit loss provisions, collectively and individually assessed provisions, stage 1 to 3 ECL, stressed exposures, total committed exposures and watchlist and substandard.
Two-column glossary tables with grey term cells and definition text.
Definitions of the segments (Consumer, Business and Wealth, WIB, Westpac NZ), AIEA, NIM, core NIM, pre-provision profit, capital ratios, HQLA, internationally comparable ratios, leverage ratio, LCR, NSFR and RWA.
Two-column glossary layout with grouped tables under red subheadings.
Definitions and sources for digitally active customers, digital sales, mobile wallet payments, MFI share and rank (Roy Morgan, RFI Global), NPS (RFI Atlas) and Coalition Greenwich Voice of Client rankings.
Two-column glossary tables under red subheadings.
Definitions for Westpac NZ relationship management scores, the Relationship Strength Index, consumer channel satisfaction, and digitally active and active customers.
Two-column glossary tables with grey term cells.
NZ NPS methodology and sources for consumer, corporate, small business, agribusiness and institutional NPS, and the business blended NPS weighting (30% corporate, 30% SME, 20% agri, 20% institutional).
Single full-width glossary table with grey label cells.
Westpac investor relations contacts led by Justin McCarthy (General Manager, Investor Relations), plus investor relations and share registry contact details and the westpac.com.au/investorcentre website.
Grey panel with a two-column list of team names in red, a laptop screenshot of the investor centre, and contact details with icons below.
Disclaimer covering general information, the statement that all amounts are in Australian dollars unless otherwise indicated, credit rating distribution limits, forward-looking statements and climate and sustainability statement limitations.
Dense full-width text page with bold subheadings and the Westpac logo in the footer.
Perguntas comuns sobre este slide e o conteúdo da apresentação subjacente.
It is Westpac Banking Corporation's (ASX: WBC) 154-page 2026 Full Year Results Presentation and Investor Discussion Pack, lodged with the ASX on 2 November 2026. It covers FY26, the 12 months ended 30 September 2026; Westpac's financial year runs from 1 October to 30 September. It contains the CEO and CFO results presentation (pages 3-41), followed by the Investor Discussion Pack covering earnings drivers, UNITE, customers, segments, credit quality, capital, funding and liquidity, ESG, economics and an appendix.
Net profit excluding Notable Items was A$6,992m, flat on FY25's A$6,972m. Statutory net profit was A$6,813m, down 1% from A$6,916m, after A$179m of Notable Items. Revenue was A$22.7bn, expenses A$11.8bn and pre-provision profit A$10.9bn (up 4%). EPS excluding Notable Items was 204.5 cents.
Group NIM was 1.87% for FY26, down from 1.94% in FY25. In the second half, NIM was 1.86% (1.89% in 1H26), with core NIM of 1.75% and a Treasury and Markets contribution of 0.11%.
Ordinary dividends for FY26 totalled 154 cents per share (77c interim plus 77c final), fully franked, up from 153c in FY25. The 2H26 payout ratio was 75.0%, at the top of the 65-75% target range, and the deck cites a 4.4% dividend yield (6.3% grossed up for franking) based on the 30 September 2026 share price of A$35.07.
Westpac's Level 2 CET1 capital ratio was 12.46% at 30 September 2026 (12.5% rounded), or 19.3% on an internationally comparable basis. That is A$2.9bn above its target of more than 11.25% after the 2H26 dividend. LCR averaged 137% and NSFR was 113%.
All amounts are in Australian dollars (A$) unless otherwise indicated. New Zealand division figures on some slides, such as the NZ financial performance and balance sheet pages, are shown in NZD where marked.
The original PDF as lodged with the ASX is available on this page. Where a PowerPoint (PPTX) version is offered, it was converted from the PDF and checked slide by slide against the original. Westpac's own results materials are also published on its investor centre at westpac.com.au/investorcentre.
Yes. The deck is a good reference for financial results layouts: KPI tile grids (page 6), profit, NIM and capital waterfall charts (pages 25-36), segment four-quadrant performance pages (pages 72, 78, 85 and 91), sector deep-dives built from donut charts and tables (pages 101-109) and scorecard tables (page 39). Adapt the layouts with your own data and branding rather than copying Westpac's logo or figures.

Create Your Own Slides
Turn your ideas into professional presentations in seconds with 2slides AI.
Referencie designs profissionais, escolha seu estilo e gere slides com renderização de texto perfeita. Alimentado por Nano Banana—comece a criar sua apresentação agora.
Seu Agente IA para slides. Economize tempo, brilhe mais rápido com criação inteligente de apresentações.


© 2026 2slides. Todos os direitos reservados.