
Faz parte de Exemplos de apresentações para investidores · Exemplos de apresentações para investidores da Índia
Tata Motors Commercial Vehicles Q2 FY27 earnings presentation (quarter ended September 30, 2026): the investor deck filed with BSE/NSE on 23 October 2026 by Tata Motors Limited (formerly TML Commercial Vehicles Ltd., ticker TMCV), the commercial-vehicles company created by the 2025 Tata Motors demerger. It reports Q2 wholesales of 135.1K units (up 42% YoY), standalone revenue of ₹23.9K Cr (up 42%), EBITDA of ₹2.8K Cr, PBT (bei) of ₹2.7K Cr and free cash flow of ₹4.6K Cr, plus an IVECO tender-offer update, VAHAN market share, industry trends and Q3 priorities. The design is a clean corporate investor-deck style: white slides with a blue corner tab, the Tata Motors Commercial Vehicles 'Better Always' logo, navy and sage-grey bar charts, KPI tiles, waterfall bridges and dense P&L tables, with vehicle photography on cover and section dividers.
Usa a capa desta apresentação como referência de estilo para slides criados a partir do seu próprio conteúdo. Ou escolha qualquer página abaixo para usar o layout dela como referência.
Navegação Rápida
Tags
Compartilhar os slides
Tata Motors Commercial Vehicles Q2 FY27 earnings presentation (quarter ended September 30, 2026): the investor deck filed with BSE/NSE on 23 October 2026 by Tata Motors Limited (formerly TML Commercial Vehicles Ltd., ticker TMCV), the commercial-vehicles company created by the 2025 Tata Motors demerger. It reports Q2 wholesales of 135.1K units (up 42% YoY), standalone revenue of ₹23.9K Cr (up 42%), EBITDA of ₹2.8K Cr, PBT (bei) of ₹2.7K Cr and free cash flow of ₹4.6K Cr, plus an IVECO tender-offer update, VAHAN market share, industry trends and Q3 priorities. The design is a clean corporate investor-deck style: white slides with a blue corner tab, the Tata Motors Commercial Vehicles 'Better Always' logo, navy and sage-grey bar charts, KPI tiles, waterfall bridges and dense P&L tables, with vehicle photography on cover and section dividers.
Visualização detalhada de cada página de slide, incluindo layout, conteúdo principal e elementos visuais.
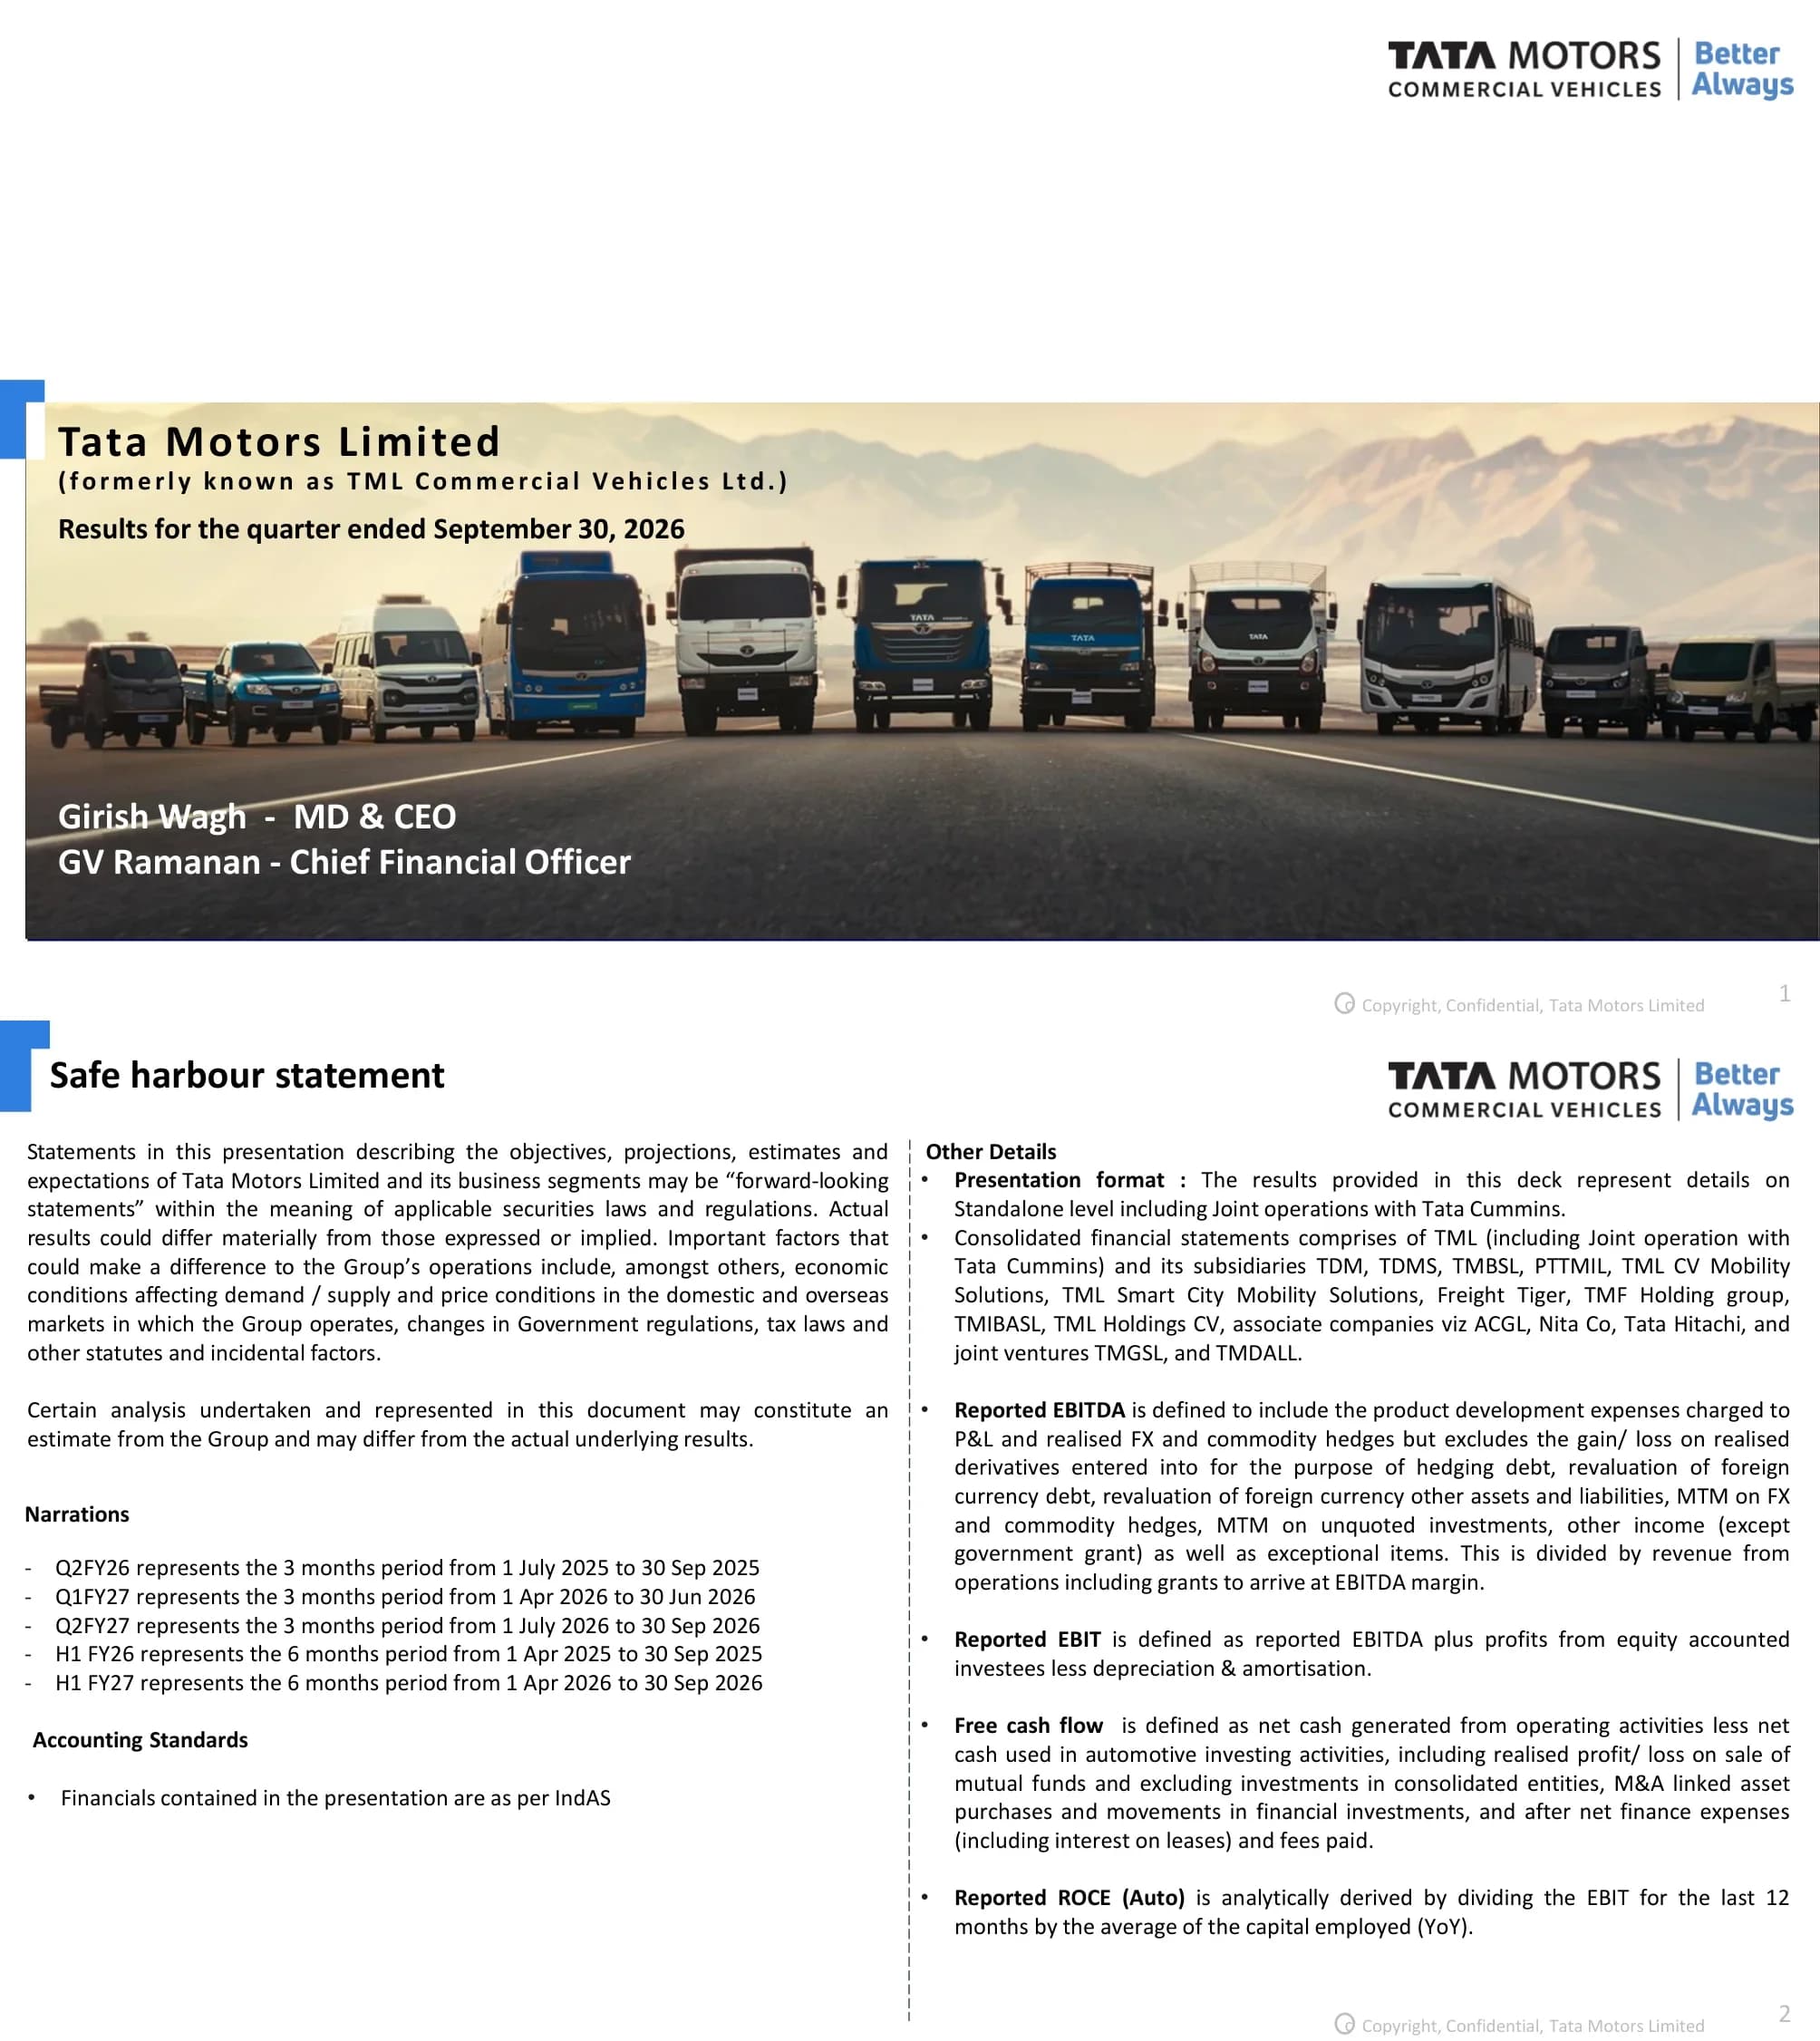
Title slide for Tata Motors Limited (formerly known as TML Commercial Vehicles Ltd.) with results for the quarter ended September 30, 2026. Presenters named: Girish Wagh, MD & CEO, and GV Ramanan, Chief Financial Officer.
White slide with logo top right; a full-width photo band across the lower half carries the title text at top-left and presenter names at bottom-left.
Forward-looking statements disclaimer, period narrations (Q2FY27 = 1 Jul to 30 Sep 2026; H1 FY27 = 1 Apr to 30 Sep 2026), IndAS basis, presentation format (standalone including Tata Cummins joint operations), consolidation scope, and definitions of reported EBITDA, EBIT, free cash flow and Auto ROCE.
Two text columns separated by a dashed vertical line: disclaimer, narrations and accounting standards on the left; 'Other Details' definitions on the right.
Six milestones: next-generation passenger mobility solutions at Prawaas 5.0 with new Ultra Prime and Starbus Prime range; next-generation aggregates portfolio at Bauma CONEXPO India 2026; 'Best Truck of the Year' at the Logistics & Transport Award 2026 in the UAE; MoU with Drivn for leasing and financing of electric commercial vehicles; Petronas collaboration on a used-oil recycling pilot; partnership with Welspun Renewable Energy on an 86 MW wind-solar hybrid project.
Two rows of three image cards, each with a short caption beneath. Top row uses event and award photos; bottom row uses partner logo pairs.
IVECO offer acceptance period 7 Sep to 26 Oct 2026, with 35% of shares tendered as of 22 October 2026. Timeline: regulatory clearances obtained; acceptance period opens 7 September; offer price raised from €14.10 to €14.40 on 9 October due to a slight delay; IVECO EGM approves all offer-related resolutions on 16 October; acceptance period closes 26 October; offer settlement 30 October 2026.
Left panel with IVECO photo and two stat boxes; right panel with a vertical timeline, the last two milestones highlighted in light-blue bands.
Q2 FY27 wholesales of 135.1K versus 95.0K in Q2 FY26 and 108.7K in Q1 FY27; H1 FY27 wholesales 243.8K versus 181.0K (up 35%). Segments in Q2: HCV 33.8K (+41%), ILMCV 20.8K (+24%), SCV PU 44.0K (+27%), CV Passenger 15.4K (+31%), International Business 21.1K (+177%). H1 YoY growth per segment: 32%, 20%, 30%, 26% and 114%.
Top band with two large KPI blocks and bar charts (Q2 and H1, the latter in a dotted frame); bottom row of five segment panels each with a three-bar chart and an H1 summary strip.
Section title slide introducing the standalone financial results.
Centered heading above a row of three equal photos.
Revenue ₹23.9K Cr (up 42% YoY; 16.9, 19.3, 23.9 across Q2 FY26, Q1 FY27, Q2 FY27); EBITDA margin 11.7% (down 90bps YoY, flat QoQ; EBITDA 2.1, 2.3, 2.8); PBT (bei) ₹2.7K Cr (up 51%); FCF ₹4.6K Cr (up ₹2.4K Cr YoY). EBIT 9.7% (₹2.3K Cr) versus 10.2%; net cash ₹11.3K Cr versus ₹7.5K Cr in March 2026; Auto ROCE 65% versus 68% in Q1FY27; investment spend ₹0.6K Cr versus ₹0.7K Cr.
Four chart cards in the top row and four KPI cards in the bottom row; headline and subtitle about operating leverage and commodity headwinds above.
PBT (bei) waterfall from ₹1,757 Cr (Q2 FY26) to ₹2,660 Cr (Q2 FY27): volume and mix +1,159, realisation (net) +1,017, variable costs (1,416), other costs (214), FX and others +356. EBIT margin bridge: 10.2% to 9.7% (2.3% from volume and realisation, (5.9)% variable costs, 2.8% other costs, 0.3% FX and others). Call-outs detail other costs and other income, finance cost, forex and PLI.
Full-width waterfall chart with navy end bars and grey-green floating bars, two dashed call-out bubbles, and an EBIT % strip along the bottom.
H1 FY27 free cash flow bridge: PBT (bei) 4,717, non-cash and other 636, tax (1,262), cash profit after tax 4,091, capex (1,036), working capital changes 2,447, finance expense (net) and dividend 219, FCF 5,721. Q2 FY27 FCF is 4,606 versus 2,210 in Q2 FY26. Working capital call-out: trade receivables (622), payables and others 4,786, inventories (1,717).
Waterfall chart across the upper area with a call-out bubble, and a two-row comparison table (Q2 FY27 and Q2 FY26) aligned under the chart columns.
H1 FY27 investment: capitalized R&D 358, expensed R&D 258, total R&D 616, capital and other investments 496, total spending 1,112 (₹ Cr). Q2 FY27 totals 597 versus 686 in Q2 FY26 (R&D 339 versus 442; capital and other 258 versus 244).
Dotted-frame waterfall chart of five columns above a two-row comparison table.
Section title slide introducing the consolidated financial results.
Centered heading above a row of three equal photos.
Consolidated revenue ₹25.3K Cr (up 36%; 18.6, 20.7, 25.3); EBITDA margin 10.9% (down 40bps YoY; EBITDA 2.1, 2.3, 2.8); PBT (bei) ₹1.8K Cr (up 423%; (0.6), 3.0, 1.8) with Tata Capital MTM gain/(loss) of (2.0), 1.1, (0.7). EBIT 8.9% (₹2.3K Cr) versus 8.7%; free cash flow ₹3.0K Cr versus ₹2.0K Cr; net cash ₹15.9K Cr versus ₹13.7K Cr in March 2026.
Three chart cards on top and three KPI cards below, mirroring the standalone slide layout.
Section title slide for the business updates section.
Left-aligned heading above a large full-width photo.
Domestic CV market share: FY26 35.1%, Q1 FY27 36.8%, Q2 FY27 35.7%, H1 FY27 36.2%. By segment (H1 FY27): HCV 55.7% (+50bps), ILMCV 36.3% (down 170bps), SCV PU 27.6% (+130bps), CV Passenger 41.1% (+500bps). Footnotes explain VAHAN data basis and restated prior periods.
Top panel with the large 36.2% figure and four-bar chart; four segment panels below, each with a four-bar chart and a dashed separator before H1 FY27.
Fleet utilization (Jan'23 to Sep'26): HCV Cargo 72.2% to 76.4%, HCV Tipper 71.6% to 62.1%, MCV Cargo 60.2% to 67.2%, ICV trucks 65.8% to 66.6%, LCV 60.1% to 62.9%, Buses 51.1% to 69.3%. Operating economics (indexed to 100): freight rates 106.4, transporter profitability 98.4. Sources: internal study and Crisil Research.
Two rounded panels: left with a 2x3 grid of line-chart tiles, right with two stacked index line-chart tiles.
Industry: offtake TIV up 28% YoY, TML volumes up about 30%, robust freight activity after July monsoon slowdown. Businesses: trucks +34%, passenger carriers +31%, SCVPU about +27%, parts and services steady, International Business +177% on an Indonesia order, e-bus uptime 95%+, digital renewals improved. Sustainability: EV volumes +143%, 4.4K+ SCV EV retails (2.9X YoY), 64+ Cr green kms by e-buses.
Three columns (Industry, Businesses, Sustainability) with coloured underlined headings and arrow bullets; Ace EV photo at lower right.
Priorities: overall disciplined pricing, costs and supply; trucks productivity, payload and TCO; CV passenger and electric buses; small commercial vehicles and pickups growth and EV adoption; parts and services uptime and reach; International Business diversification amid geopolitical volatility; Iveco consolidation to begin next quarter.
Bulleted list on the left with bold category labels; large tipper truck image on the right.
Closing slide inviting questions through the Q&A textbox, asking participants to mention their name and organisation.
Three equal photos across the middle with 'Q&A session' and 'Thank You' headings and instruction text below.
Appendix divider labelled 'Additional Details, Results for the quarter ended September 30, 2026'.
White slide with a full-width dark navy band holding the white title and a light-blue subtitle.
Standalone P&L in ₹ Cr (Q2 FY26, Q1 FY27, Q2 FY27, H1 FY26, H1 FY27 and changes): revenue from operations 16,861 / 19,329 / 23,930; EBITDA 2,137 / 2,264 / 2,806; EBIT 1,725 / 1,817 / 2,334; PBT (bei) 1,757 / 2,057 / 2,660; PAT (1,021) / 1,528 / 2,138; H1 FY27 EBITDA 5,070 and PAT 3,666; FCF 2.2 / 1.1 / 4.6 K Cr; EBITDA margin 11.7% and EBIT margin 9.7% in Q2 FY27.
Full-slide table with light-blue header, navy highlighted subtotal rows and variance columns (Q2 vs Q2, Q2 vs Q1, H1 vs H1) on the right.
Consolidated P&L in ₹ Cr: revenue from operations 18,585 / 20,667 / 25,338 (Q2 FY26 / Q1 FY27 / Q2 FY27); EBITDA 2,113 / 2,257 / 2,770; EBIT 1,630 / 1,773 / 2,274; PBT (bei) (551) / 3,049 / 1,780; PAT (867) / 2,556 / 1,253; H1 FY27 PAT 3,809; fair value changes on investments at FVTPL (2,027) / 1,135 / (708); FCF 2.0 / 0.4 / 3.0 K Cr; EBITDA margin 10.9% and EBIT margin 8.9% in Q2 FY27.
Same table format as the standalone P&L, with extra rows for equity-accounted investees and FVTPL gains, and an FVTPL footnote.
Perguntas comuns sobre este slide e o conteúdo da apresentação subjacente.
It is the results deck of Tata Motors Limited, the commercial-vehicles company (formerly TML Commercial Vehicles Ltd.) that emerged from the 2025 Tata Motors demerger and trades as TMCV on BSE and NSE. It covers the quarter ended September 30, 2026 and was filed with the exchanges on 23 October 2026.
Wholesales were 135.1K units (up 42% YoY). On a standalone basis including Tata Cummins joint operations, revenue was ₹23.9K Cr (up 42%), EBITDA ₹2.8K Cr at an 11.7% margin, PBT (bei) ₹2.7K Cr (up 51%) and free cash flow ₹4.6K Cr. Consolidated revenue was ₹25.3K Cr.
Yes. Slides 7 to 10 present standalone results including the Tata Cummins joint operation, slide 12 gives the consolidated summary, and slides 20 and 21 contain full standalone and consolidated P&L tables in ₹ crore under IndAS.
Slide 4 shows the IVECO offer timeline: acceptance period 7 September to 26 October 2026, offer price raised from €14.10 to €14.40 on 9 October, all EGM resolutions approved on 16 October, settlement on 30 October, and 35% of shares tendered as of 22 October 2026. Slide 17 notes that Iveco consolidation is expected to begin next quarter.
This page offers the original PDF as filed with BSE/NSE plus an editable PPTX that has been converted from the PDF. The PPTX is handy for reusing slide layouts and tables, though a conversion from PDF may need minor formatting touch-ups, and charts may not be native editable objects.
Slide 5 gives wholesales by segment (HCV, ILMCV, SCV PU, CV Passenger and International Business) and slide 14 gives VAHAN domestic market share, which was 36.2% in H1 FY27, up 110bps versus FY26.
Slide 8 bridges PBT (bei) from ₹1,757 Cr to ₹2,660 Cr across volume, realisation, variable costs and other items. Slide 9 bridges H1 FY27 PBT (bei) to free cash flow of ₹5,721 Cr, and slide 10 builds up H1 investment spending of ₹1,112 Cr.
It uses a clean corporate style: white slides, a blue corner tab, the Tata Motors Commercial Vehicles logo, navy and sage-grey charts, KPI cards, waterfalls and banded tables. The structure (highlights, KPIs, bridges, market share, outlook, appendix tables) works well as a reference for an earnings presentation, but the Tata branding and figures are the company's own, so replace them before reuse.

Create Your Own Slides
Turn your ideas into professional presentations in seconds with 2slides AI.
Referencie designs profissionais, escolha seu estilo e gere slides com renderização de texto perfeita. Alimentado por Nano Banana—comece a criar sua apresentação agora.
Seu Agente IA para slides. Economize tempo, brilhe mais rápido com criação inteligente de apresentações.


© 2026 2slides. Todos os direitos reservados.