
Faz parte de Exemplos de apresentações para investidores · Exemplos de apresentações para investidores do Japão
Nitto Denko H1 FY2026 Earnings Presentation (fiscal year ending March 2027, Q2 results) - a 28-page Japanese-language results deck published on TDnet, the Tokyo Stock Exchange timely disclosure system, on October 27, 2026, covering first-half revenue of ¥558.4 billion (5,584億円, +8.7%) and operating profit of ¥105.8 billion (1,058億円, +12.0%), segment results, a maintained full-year outlook, a dividend increase and a new share buyback.
Usa a capa desta apresentação como referência de estilo para slides criados a partir do seu próprio conteúdo. Ou escolha qualquer página abaixo para usar o layout dela como referência.
Navegação Rápida
Tags
Compartilhar os slides
Nitto Denko H1 FY2026 Earnings Presentation (fiscal year ending March 2027, Q2 results) - a 28-page Japanese-language results deck published on TDnet, the Tokyo Stock Exchange timely disclosure system, on October 27, 2026, covering first-half revenue of ¥558.4 billion (5,584億円, +8.7%) and operating profit of ¥105.8 billion (1,058億円, +12.0%), segment results, a maintained full-year outlook, a dividend increase and a new share buyback.
Visualização detalhada de cada página de slide, incluindo layout, conteúdo principal e elementos visuais.
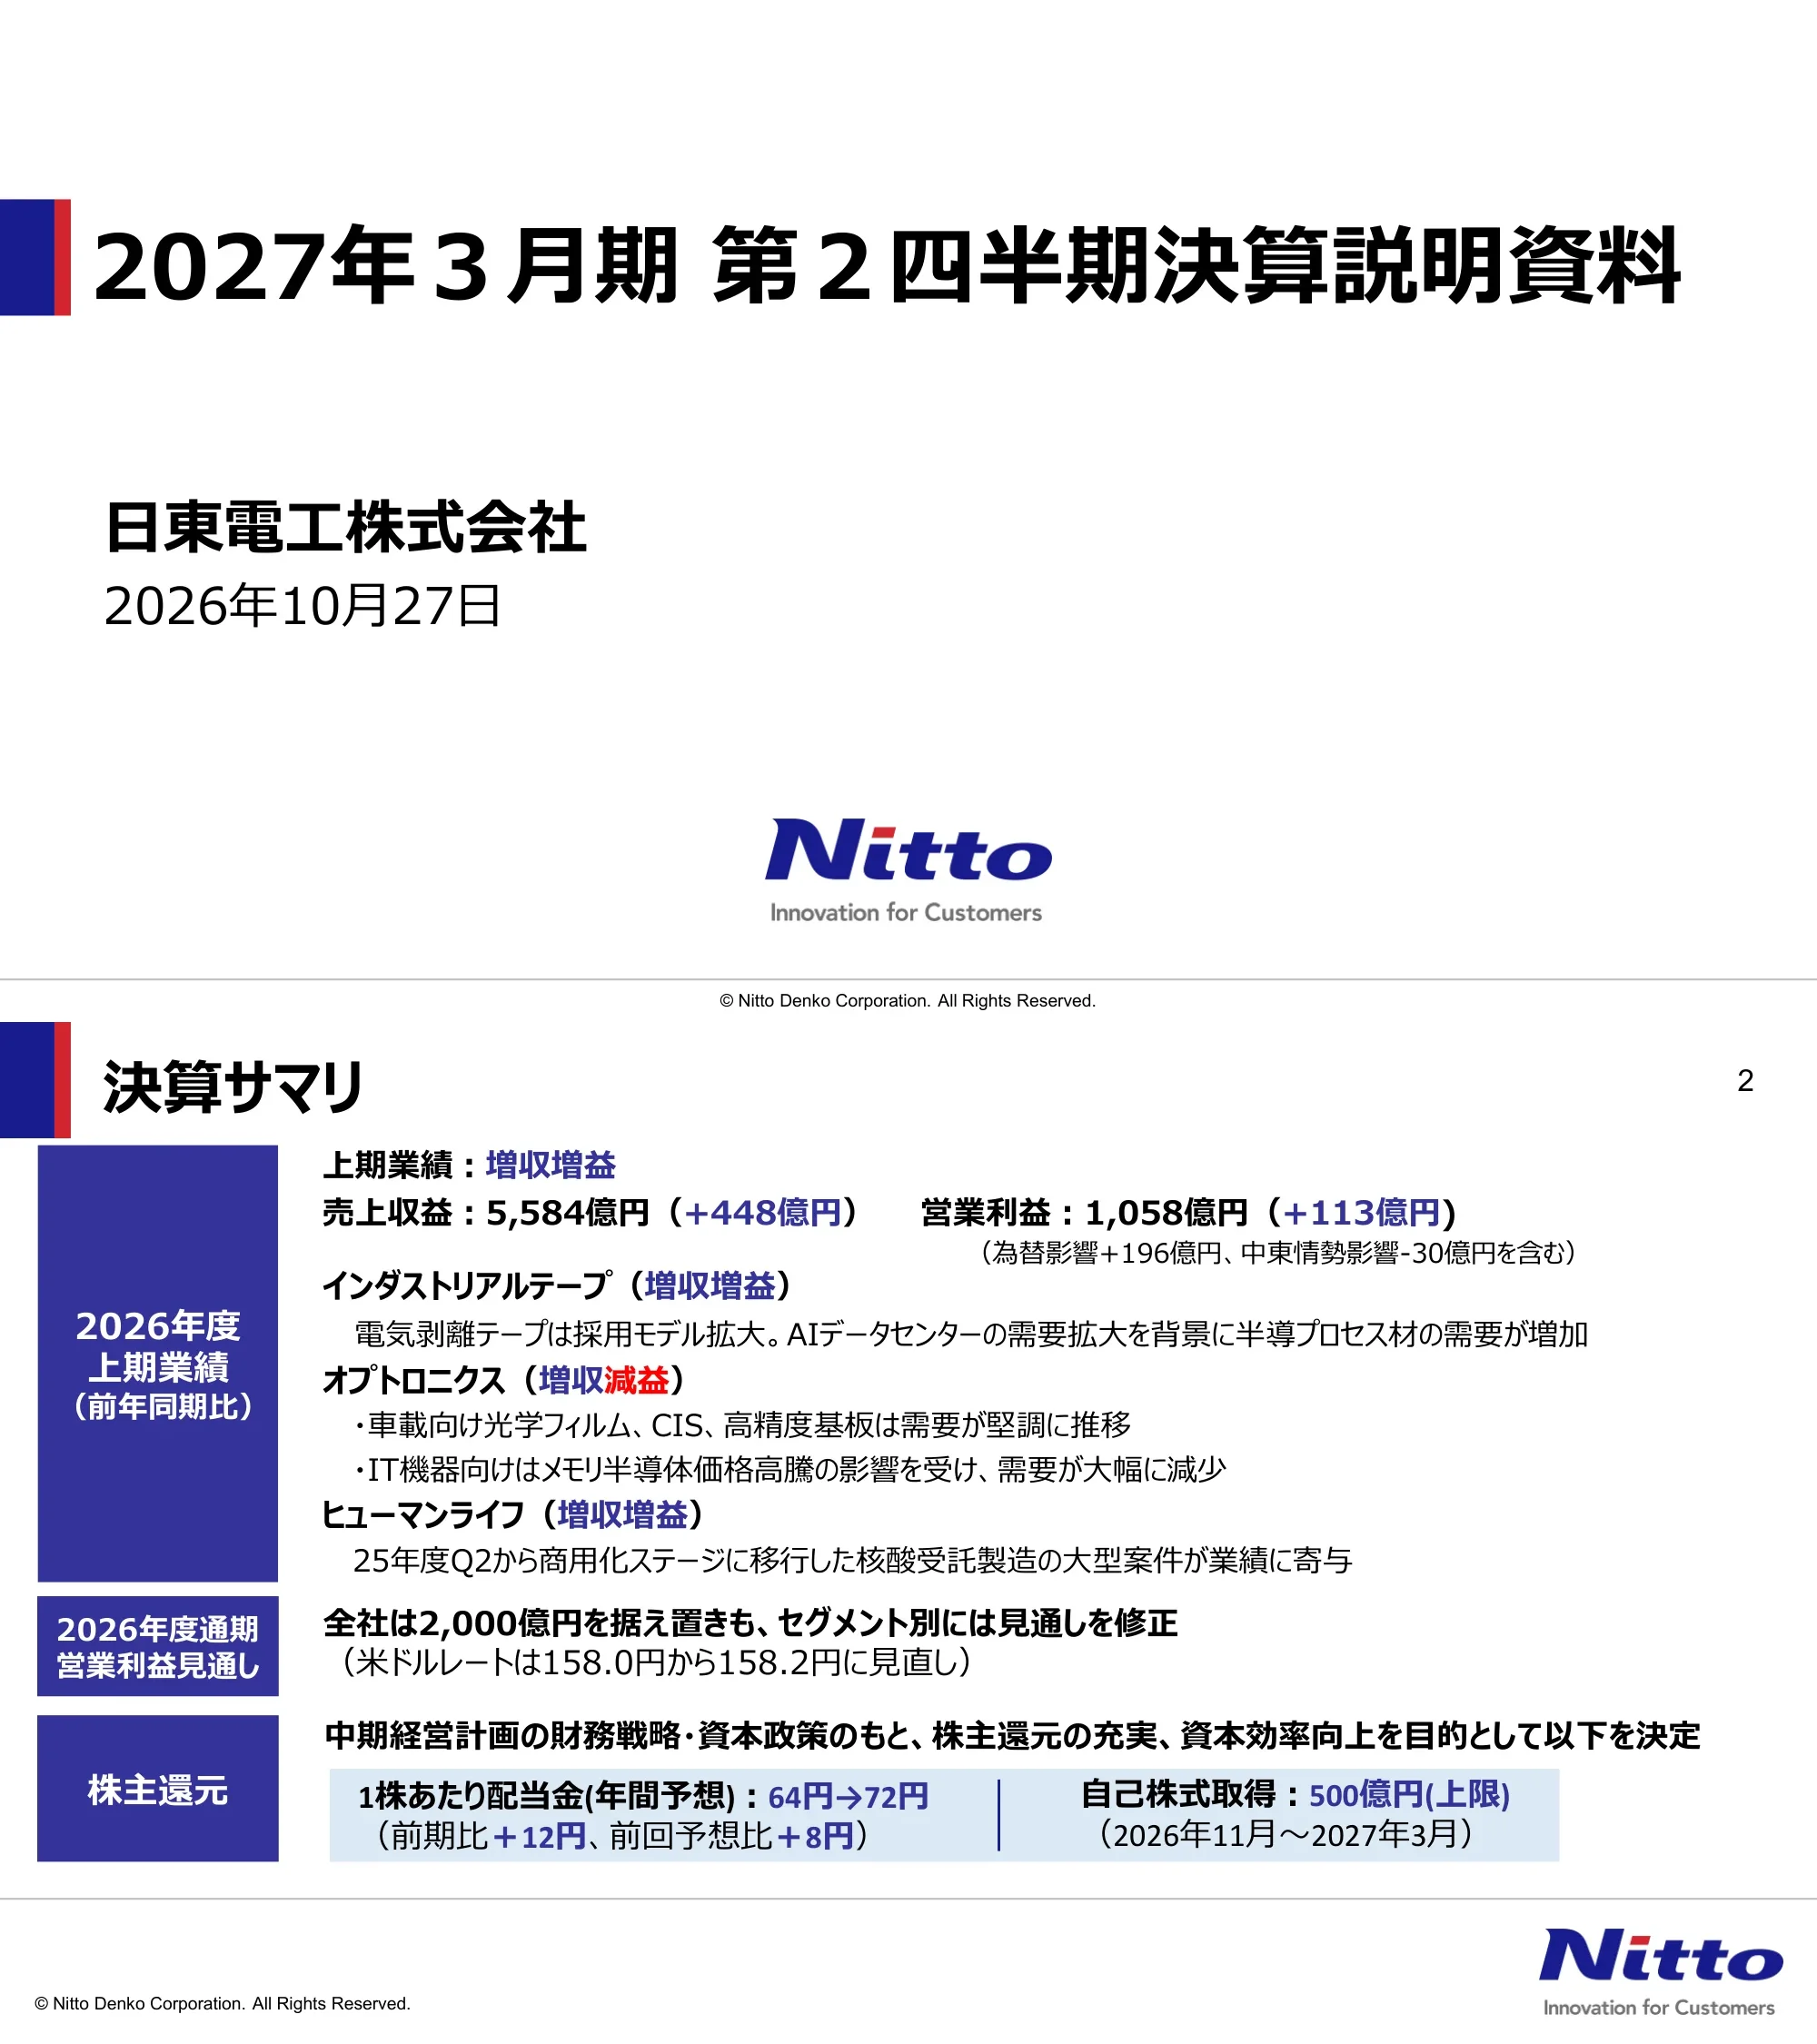
Title page for Nitto Denko Corporation's second-quarter earnings briefing for the fiscal year ending March 2027 (2027年3月期 第2四半期決算説明資料), dated October 27, 2026.
White background with a navy-and-red vertical accent bar beside a large bold Japanese title, company name and date at left, and the Nitto 'Innovation for Customers' logo centered below.
H1 FY2026 revenue rose to ¥558.4 billion (5,584億円, +¥44.8 billion) and operating profit to ¥105.8 billion (1,058億円, +¥11.3 billion), including a +¥19.6 billion FX effect and a -¥3.0 billion Middle East impact. Industrial Tape grew on wider adoption of electrically debondable tape and AI data center demand for semiconductor process materials; Optronics saw higher revenue but lower profit as IT-device demand fell sharply on soaring memory prices, while automotive optical film, CIS and high-precision boards held firm; Human Life gained from a large oligonucleotide contract manufacturing project. The full-year operating profit outlook of ¥200 billion (2,000億円) is maintained with segment revisions (USD rate revised from ¥158.0 to ¥158.2). Shareholder returns: annual dividend forecast raised from ¥64 to ¥72 per share (+¥12 year on year) and a share buyback of up to ¥50 billion (500億円) from November 2026 to March 2027.
Three navy label blocks down the left (H1 results, full-year outlook, shareholder returns) each paired with text on the right; the shareholder return row ends in a light-blue callout box split into dividend and buyback halves.
Agenda with three sections: Q2 results for the fiscal year ending March 2027 (p.4), full-year outlook (p.12) and supplementary materials (p.18).
Three horizontal bars, each with a navy numbered square on the left and a grey band holding the section name and page reference.
Section divider introducing the first-half and second-quarter results.
Single centered divider bar with a navy number box and grey title band on an otherwise blank slide.
Year-on-year table in ¥100 million: revenue 5,136 to 5,584 (+448, +8.7%); operating profit 945 to 1,058 (+113, +12.0%); operating margin 18.4% to 19.0% (+0.6pt); profit before tax 952 to 1,064 (+11.8%); interim profit attributable to owners of the parent 689 to 765 (+76, +11.0%); average USD rate ¥146.4 to ¥160.5.
Full-width financial table with navy column headers; the current-period column is shaded lavender and outlined in red; the FX rate row is separated at the bottom.
Estimated bridge from ¥94.5 billion to ¥105.8 billion (+113億円): selling/purchase price and rationalization 0 (including a -30 Middle East impact), sales volume -15, fixed costs -140, royalty 0, special factors +45 (reversal of last year's site consolidation and asset disposal costs +35, gains on sale of fixed assets and land this year +10), product mix and other +27, FX +196 (¥146.4 to ¥160.5 per dollar).
Waterfall chart with grey start and end columns, navy positive bars and red negative bars, annotation boxes for the Middle East impact and special factors, and a light-blue arrow labeled 113 across the base.
Bridge from Q1 operating profit of 492億円 to Q2 566億円 (+74): price/purchase/rationalization +20 (including +10 Middle East effect), sales volume +50, fixed costs -30, royalty 0, product mix +25, FX +9 (¥159.3 to ¥161.6 per dollar).
Same waterfall format as the previous page with grey endpoints, navy and red bars, a callout box and a light-blue arrow labeled 74.
Segment revenue and operating profit (¥100 million): Industrial Tape 1,792 to 2,081 (+16.1%), OP 237 to 358 (+51.3%); Optronics 2,699 to 2,707 (+0.3%), OP 771 to 740 (-4.1%), with Information Fine Materials 2,001 to 1,737 (-13.2%) and Circuit Materials 698 to 970 (+39.1%); Human Life 696 to 843 (+21.0%), OP -16 to 10, with Life Science 250 to 328 (+31.3%), Membrane 167 to 183 (+9.6%) and Personal Care Materials 279 to 331 (+18.8%); total 5,136 to 5,584 revenue and 945 to 1,058 operating profit.
Dense two-line-per-segment table with color-coded segment labels (green for Industrial Tape, blue for Optronics, pink for Human Life, grey for other) and a red-outlined current-period column; negative changes in red.
Revenue ¥208.1 billion (+16.1%) and operating profit ¥35.8 billion (+51.3%), margin up from 13.2% to 17.2%. Electronics: battery-fixing electrically debondable tape adopted in more high-end smartphone models. Semiconductor process materials: AI data center demand lifted process materials for memory chips. Other: price optimization in general industrial and automotive materials to offset raw material inflation.
Left column with two small green bar charts (revenue; operating profit with a red margin line); right side has a two-row KPI box above bullet commentary grouped by product area.
Revenue ¥270.7 billion (+0.3%) and operating profit ¥74.0 billion (-4.1%), margin 28.6% to 27.3%. Information Fine Materials: optical film for automotive displays steady, but film for high-end notebooks and tablets fell sharply as customers cut production amid soaring memory prices. Circuit Materials: new high-precision boards for high-end smartphones added revenue, and CIS (Circuit Integrated Suspension) for high-capacity data center HDDs was strong on generative AI demand.
Left column with stacked blue bar chart (Information Fine Materials and Circuit Materials) and operating profit bars with margin line; right side KPI box and bullet commentary with a CIS footnote.
Revenue ¥84.3 billion (+21.0%) and operating profit ¥1.0 billion versus a ¥1.6 billion loss a year earlier. Life Science: a large oligonucleotide contract manufacturing project that entered commercial stage in Q2 FY2025 drove growth, and oligonucleotide materials grew as customers' commercial drugs expanded globally. Membrane: tighter wastewater rules in emerging markets, led by India, raised demand for polymer separation membranes. Personal Care Materials: new diaper products and eco-friendly products contributed.
Left column with pink-and-grey stacked revenue bars for three sub-segments and an operating profit chart moving from a negative pink bar to a positive one; right side KPI box and bullets.
Section divider introducing the full-year forecast.
Centered navy number box with grey title band on a blank slide.
Full-year forecast (¥100 million): revenue 10,282 to 11,100 (+818, +8.0%); operating profit 1,836 to 2,000 (+164, +8.9%); operating margin 17.9% to 18.0%; profit before tax 1,850 to 2,000 (+8.1%); profit attributable to owners of the parent 1,335 to 1,420 (+6.4%); assumed USD rate ¥150.2 to ¥158.2.
Same financial table design as page 5 with the forecast column outlined in red and shaded lavender.
Weaker Information Fine Materials conditions are offset by other segments, so the company-wide forecast of ¥1.11 trillion revenue and ¥200 billion operating profit is unchanged; the Middle East impact is now expected to shrink from -¥10.0 billion to -¥4.5 billion. Versus the July forecast: Industrial Tape revenue 4,060 to 4,170 and OP 665 to 710; Information Fine Materials 3,680 to 3,460 (-6.0%); Circuit Materials 1,785 to 1,865 (+4.5%); Optronics revenue 5,465 to 5,325 and OP 1,480 to 1,425; Human Life revenue 1,670 to 1,705 and OP 10 to 17.
Blue headline text above a color-coded segment table comparing the July and October forecasts with change columns; decreases in red.
Full-year segment forecast versus FY2025 actual (¥100 million): Industrial Tape revenue 3,666 to 4,170 (+13.7%), OP 517 to 710 (+37.4%); Information Fine Materials 3,862 to 3,460 (-10.4%); Circuit Materials 1,416 to 1,865 (+31.7%); Optronics revenue 5,278 to 5,325 (+0.9%), OP 1,499 to 1,425 (-4.9%); Life Science 540 to 645 (+19.4%); Membrane 334 to 375 (+12.2%); Personal Care Materials 563 to 685 (+21.7%); Human Life revenue 1,437 to 1,705 (+18.6%), OP -50 to 17.
Color-coded segment table matching page 8, with FY2025 actual, FY2026 forecast (red outline) and year-on-year change columns.
Under the medium-term plan's financial and capital policy, the annual dividend forecast for the fiscal year ending March 2027 is raised from ¥64 to ¥72 per share (interim ¥36, year-end forecast ¥36; previous forecast ¥32 + ¥32; prior year ¥30 + ¥30 = ¥60). A new buyback of up to ¥50 billion (500億円) runs from November 4, 2026 to March 24, 2027, bringing FY2026 buybacks to ¥100 billion including the ¥50 billion already executed.
Blue headline, then two navy label blocks on the left (dividend revision, share buyback) with a dividend comparison table and buyback text on the right; the revised row is highlighted in light cyan.
Disclaimer that forecasts and forward-looking statements are based on information available at the time and involve risks and uncertainties, and that amounts and percentages are rounded to the nearest display unit.
Text-only slide with a bracketed heading and two numbered paragraphs.
Section divider introducing the appendix.
Navy number box and grey title band placed in the upper-middle of the slide.
On top of steady cloud data center growth, AI data center demand is rising, so Nitto Denko will invest about ¥28 billion (約280億円) in capex through FY28. CISFLEX is the suspension component that carries HDD read/write heads. JEITA data shows the data center product market growing from $686.0 billion in FY25 to $1,234.8 billion in FY28 and $1,690.7 billion in FY30 (CAGR about 20%, including HDDs and AI server GPUs). Capacity plan: about 15% expansion under way, about 20% expansion at Vietnam Plant 5 decided in FY26 Q1, and further investment under consideration.
Blue headline over a two-column layout: left shows an HDD photo with magnified CISFLEX part and a small market-size bar chart; right shows a factory photo and rising capacity bars with arrow callouts.
Bridge from Q2 FY2025 operating profit of 519億円 to 566億円 (+48): price/purchase/rationalization +20 (including -10 Middle East impact), sales volume -55, fixed costs -70, royalty 0, special factors +35 (reversal of prior-year site consolidation and disposal costs +30, land sale gains +5), product mix +9, FX +109 (¥146.9 to ¥161.6 per dollar).
Waterfall chart in the same style as pages 6 and 7 with annotation boxes and a light-blue arrow labeled 48.
Three-year trends (¥100 million): capex 930 (FY2024), 868 (FY2025), 1,200 (FY2026 forecast); depreciation 656, 707, 790; R&D expense 468, 480, 500.
Three side-by-side bar charts under rounded navy header pills, with navy bars for actuals and light-blue bars for forecasts.
H1 cash flows (¥100 million): operating CF 750 to 1,088 (+338); investing CF -563 to -626; free cash flow 187 to 463 (+276); financing CF -830 to -743; FX and other 42 to 6; net change in cash -602 to -274; cash and equivalents at period end 3,032 to 3,324 (+292).
Financial table with navy headers, red negative figures and a red-outlined current-period column; period-end cash shown in a separated bottom row.
Ten quarters from Q1 FY2024 to Q2 FY2026 of revenue, operating profit, profit before tax and quarterly profit attributable to owners, with operating margin on a secondary axis. Revenue peaks at 2,867億円 in Q2 FY2026 with operating profit of 566 (19.8% margin); the low was Q4 FY2024 at 2,356 revenue and 13.9% margin.
Clustered column chart with blue revenue, pink operating profit, grey pre-tax profit and yellow net profit bars, plus a red operating margin line on the right axis, grouped by fiscal year.
With ¥100 billion of buybacks and a higher dividend, the FY2026 total return ratio is expected to exceed 100%. Dividends per share rose from ¥30 in FY2016 to ¥60 in FY2025 and a planned ¥72 in FY2026; the FY2026 payout ratio is 33.3% and total return ratio 103.4%. Green labels mark past buybacks of 478億円, 500億円, 500億円, 300億円, 800億円 and 1,000億円 for FY2026.
Blue headline above a bar chart of dividends per share from FY2016 to FY2026 with a grey payout ratio line and red total return ratio line; green tags above the bars show buyback amounts; the FY2026 bar is pale to mark a forecast.
Revenue mix excluding adjustments: FY2024 actual ¥1,013.9 billion (10,139億円, ¥152.9/$) with Industrial Tape 34%, Optronics 53%, Human Life 13%; FY2025 actual 10,282億円 (¥150.2/$) at 35% / 51% / 14%; FY2026 forecast 11,100億円 (¥158.2/$) at 37% / 48% / 15%, other below 1%.
Three pie charts in a row connected by grey chevron arrows, with a segment color legend at top.
Operating profit mix excluding adjustments and loss-making segments: FY2024 actual 1,857億円 with Industrial Tape 21% and Optronics 79%; FY2025 actual 1,836億円 at 26% / 74%; FY2026 forecast 2,000億円 at 33% / 66%, with Human Life below 1%.
Three pie charts with chevron arrows, mirroring the previous page.
Shows how reporting segments changed: April 2022 (Industrial Tape; Optronics with Information Fine Materials and Printed Circuits; Human Life with Life Science and Membrane; Other/new businesses), July 2022 (Personal Care Materials added to Human Life), and the April 2023 update renaming Printed Circuits to Circuit Materials.
Three side-by-side color-blocked segment trees with headings, plus a column of small product photos on the right.
Closing slide with the Nitto logo and the tagline 'Innovation for Customers'.
Large centered logo on a white background.
Perguntas comuns sobre este slide e o conteúdo da apresentação subjacente.
It is Nitto Denko's 28-page briefing on first-half results for the fiscal year ending March 2027 (April-September 2026). It covers revenue of ¥558.4 billion (+8.7%) and operating profit of ¥105.8 billion (+12.0%), profit bridges, results for the Industrial Tape, Optronics and Human Life segments, the full-year outlook, shareholder returns and appendix data.
The original deck is in Japanese (決算説明資料, earnings briefing material). It was published on October 27, 2026 on TDnet, the Tokyo Stock Exchange's timely disclosure system. The page-by-page summaries on this page are written in English, with amounts kept in yen and the deck's ¥100 million (億円) units.
Nitto Denko's fiscal year runs from April to March, and the company calls the year from April 2026 to March 2027 'FY2026' (2026年度). The deck's formal title refers to the second quarter of the fiscal year ending March 2027, which is the same period as the first half of FY2026.
The company kept its forecast of ¥1.11 trillion revenue and ¥200 billion operating profit (18.0% margin), with profit attributable to owners of ¥142 billion at an assumed ¥158.2 per US dollar. A weaker outlook for Information Fine Materials is offset by higher forecasts for Industrial Tape, Circuit Materials and Human Life.
The annual dividend forecast was raised from ¥64 to ¥72 per share, and a new buyback of up to ¥50 billion was set for November 4, 2026 to March 24, 2027. Together with the ¥50 billion already executed, FY2026 buybacks total ¥100 billion and the total return ratio is expected to exceed 100%.
Yes. The original PDF is available, along with an editable PPTX converted from that PDF. The PPTX is a conversion, not Nitto Denko's original source file, so some fonts, chart objects and Japanese text spacing may need adjusting.
The profit-bridge waterfall charts (pages 6, 7 and 20), the color-coded segment tables (pages 8, 14 and 15), the segment pages that pair small bar charts with bullet commentary (pages 9-11) and the dividend history chart with buyback tags (page 24) adapt well to other earnings decks.

Create Your Own Slides
Turn your ideas into professional presentations in seconds with 2slides AI.
Referencie designs profissionais, escolha seu estilo e gere slides com renderização de texto perfeita. Alimentado por Nano Banana—comece a criar sua apresentação agora.
Seu Agente IA para slides. Economize tempo, brilhe mais rápido com criação inteligente de apresentações.


© 2026 2slides. Todos os direitos reservados.