
Faz parte de Exemplos de apresentações para investidores · Exemplos de apresentações para investidores do Japão
Nippon Ham (NH Foods Ltd.) H1 FY2026 earnings presentation: first-half results for the six months to September 2026 and the revised full-year plan for the fiscal year ending March 2027 (labeled FY2027/3 in the deck). This is a Japanese-language deck published on TDnet, the Tokyo Stock Exchange's timely disclosure system, on November 2, 2026. H1 net sales rose 6.5% to ¥769.4 billion (¥7,694 億円) while business profit fell 20.7% to ¥28.8 billion (¥288 億円); the full-year business profit forecast was cut from ¥61.0 billion to ¥50.0 billion on weaker Australian beef and processed-foods margins.
Usa a capa desta apresentação como referência de estilo para slides criados a partir do seu próprio conteúdo. Ou escolha qualquer página abaixo para usar o layout dela como referência.
Navegação Rápida
Tags
Compartilhar os slides
Nippon Ham (NH Foods Ltd.) H1 FY2026 earnings presentation: first-half results for the six months to September 2026 and the revised full-year plan for the fiscal year ending March 2027 (labeled FY2027/3 in the deck). This is a Japanese-language deck published on TDnet, the Tokyo Stock Exchange's timely disclosure system, on November 2, 2026. H1 net sales rose 6.5% to ¥769.4 billion (¥7,694 億円) while business profit fell 20.7% to ¥28.8 billion (¥288 億円); the full-year business profit forecast was cut from ¥61.0 billion to ¥50.0 billion on weaker Australian beef and processed-foods margins.
Visualização detalhada de cada página de slide, incluindo layout, conteúdo principal e elementos visuais.
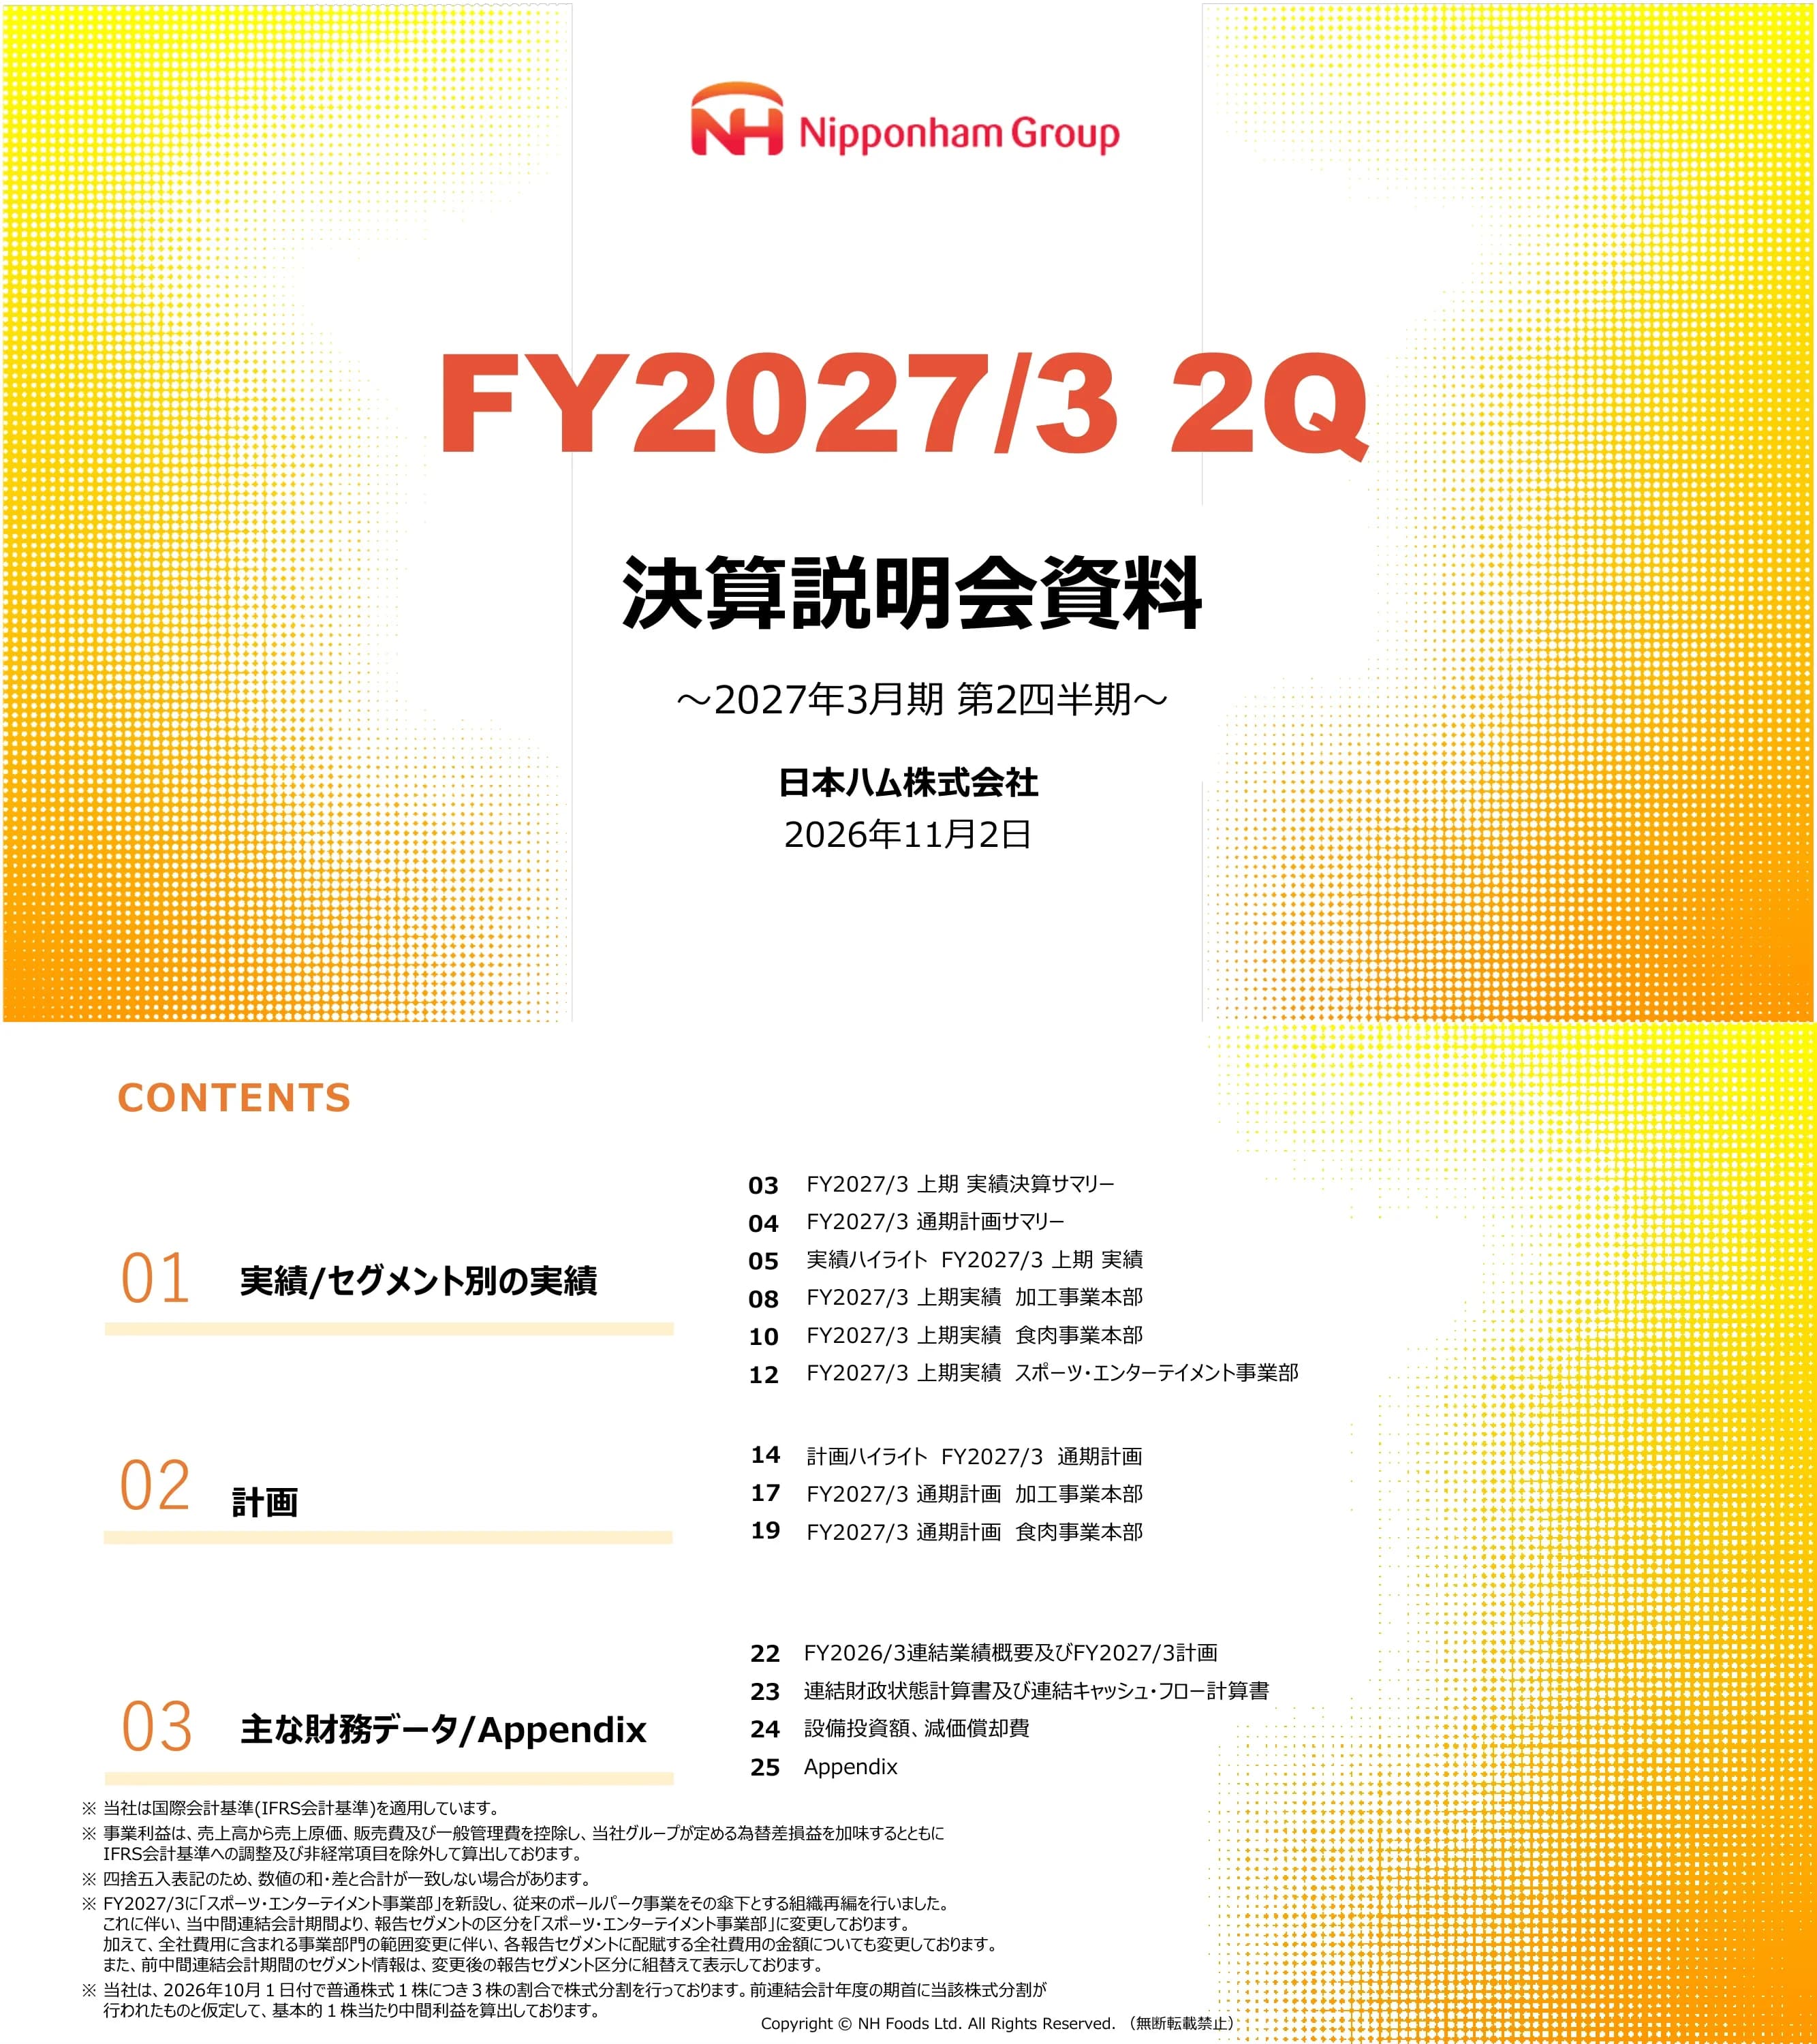
Title slide for Nippon Ham's earnings briefing materials for the second quarter of the fiscal year ending March 2027, issued by NH Foods Ltd. (日本ハム株式会社) on November 2, 2026.
Centered title column with the Nipponham Group logo at top, a large red 'FY2027/3 2Q' headline, Japanese title and date below, flanked by yellow-orange halftone dot panels on both sides.
Agenda in three sections: 01 results and segment results (pages 3-12), 02 full-year plan (pages 14-19), 03 key financial data and appendix (pages 22-25). Footnotes state the company reports under IFRS; business profit is sales minus cost of sales and SG&A plus the group's defined FX gains/losses, excluding IFRS adjustments and non-recurring items; a new Sports & Entertainment Division was created in FY2027/3 housing the ballpark business, with prior-year segment data restated; and a 3-for-1 stock split took effect October 1, 2026, with EPS calculated as if it had occurred at the start of the prior fiscal year.
Left column of three numbered section headers with underline bars; right column of page numbers and topic titles; footnotes across the bottom; halftone gradient on the right edge.
H1 net sales ¥7,694 億円 (¥769.4 billion), up 6.5% YoY; business profit ¥288 億円, down 20.7%; profit attributable to owners of the parent ¥174 億円, down 25.0%; ROE 3.3% (-1.1 pt), ROIC 2.5% (-0.7 pt), EPS ¥62.3 (-¥16.1). Topics: sales were driven by solid domestic meat volumes and price pass-through, recovery in overseas processing, core brands, dairy and extracts. Business profit fell because, despite a stronger earnings base in meats and Sports & Entertainment and growth in core processed brands, Australian operations deteriorated and processed-foods cost inflation was not offset by the planned volume growth. External factors: high Australian cattle prices with weak selling prices, and rising raw materials, packaging, utilities and feed costs.
Left KPI panel with four stacked rows (sales, business profit, net profit, management indicators) showing large red numbers and YoY changes; right 'Topics' text panel explaining drivers; top tab navigation highlighting the H1 results section.
Revised full-year forecast: net sales ¥15,000 億円 (+2.9%), business profit ¥500 億円 (-26.8%), profit attributable to owners of the parent ¥350 億円 (-0.2%), ROE 6.7% (+0.1 pt), ROIC 4.4% (-1.7 pt), EPS ¥128.7 (+¥8.3). A mini waterfall bridges business profit from ¥683 億円 in FY2026/3 to ¥500 億円: processed foods -12, fresh meats -163, Sports & Entertainment -5, eliminations -5. Processed foods expects higher sales from domestic brand promotion, new products and North America but lower profit as ham/sausage gross profit falls short of cost inflation; fresh meats expects higher sales through timely price pass-through but lower profit on high Australian cattle prices and higher feed and fuel costs. Net profit is held up by fire insurance proceeds; ROE improves 0.1 pt helped by share buybacks reducing equity.
Same KPI-panel layout as page 3 in a pink tone for the plan section, with a Topics panel on the right containing a small waterfall bar chart.
H1 FY2026/3 vs H1 FY2027/3 in ¥100 million: net sales 7,226 to 7,694 (+468, +6.5%); business profit 363 to 288 (-75, -20.7%); business profit margin 5.0% to 3.7% (-1.3 pt); profit before tax 383 to 308 (-74, -19.4%); profit attributable to owners of the parent 232 to 174 (-58, -25.0%).
Clean five-row comparison table with prior-year, current-year (highlighted orange column), change and change-rate columns.
Segment results in ¥100 million (2Q / H1 / YoY change / rate). Sales: Processed Foods 1,382 / 2,704 / +121 / +4.7%; Fresh Meats 2,711 / 5,519 / +452 / +8.9%; Sports & Entertainment 126 / 252 / +24 / +10.6%; eliminations -375 / -781 / -130; consolidated 3,844 / 7,694 / +468 / +6.5%. Business profit: Processed Foods 6 / 13 / -9 / -40.1%; Fresh Meats 50 / 203 / -74 / -26.8%; Sports & Entertainment 47 / 96 / +12 / +14.6%; eliminations -9 / -24 / -4; consolidated 94 / 288 / -75 / -20.7%.
Wide two-block table: sales on the left and business profit on the right, each with 2Q, H1 (boxed in red), change and rate columns; consolidated total row in red text.
Waterfall from H1 FY2026/3 business profit of ¥363 億円 to ¥288 億円: Processed Foods -9 (external environment -24, internal improvement -5, dairy etc. +4, other +9, overseas +7); Fresh Meats -74 (external environment -18, expenses -51, internal improvement +63, Australia -64, other overseas +11, other +11, fire impact -26); Sports & Entertainment +12; eliminations and other -4.
Vertical waterfall bar chart with y-axis 0-400; each segment's change bar sits inside a red outlined box with its driver breakdown listed underneath.
Processed Foods sales ¥2,704 億円 (+121, +4.7%), of which domestic 2,004 (+1.5%) and overseas 699 (+15.3%); business profit 13 (-9, -40.1%), domestic 17 (-48.5%) and overseas -4 (+7); margin 0.5% (-0.4 pt). Sales up on core consumer brands, extracts and dairy, though food-service sales to convenience stores struggled; North America core products solid and Thailand sales to Japan grew. Profit down on raw material and utility costs plus logistics and sales commissions; North America improved on stable chicken costs and manufacturing efficiency, Thailand hit by raw material prices and FX. Consumer sales by category YoY: wiener group 105% (Schau Essen group 106%, other wieners 104%), ham/bacon 97%, consumer total 103%, food service 102%, total 103%; processed products: chilled bakery 105%, Chinese dishes 99%, fried chicken 95%, hamburg/meatballs 101%, consumer 105%, food service 95%, total 101%.
Left financial table (2Q, H1, change, rate) with domestic/overseas sub-rows; right commentary boxes for sales (increase) and business profit (decrease); bottom-right two product-category tables of YoY sales ratios.
Domestic business profit bridge: 33 to 17 (external environment -24, internal improvement -5 consisting of volume/mix +7 and higher expenses -12, dairy/marine/extracts/primary processed +4, other domestic settlement adjustments +9). Overseas: -11 to -4 (+7). Commentary: higher pork and other main raw material costs and packaging and utility costs; brand-focused sales strategy (Schau Essen, Ishigama Kobo) improved mix but food-service gross profit worsened on raw material inflation; logistics and sales commissions rose while fewer production lines cut fixed costs; dairy, extracts and primary processing passed on costs and led profit; North America core sales strong and the acquired plant raised output; Thailand improved efficiency but was hurt by FX and chicken prices.
Left horizontal waterfall split into domestic (green band) and overseas (pink band) panels; right text panel with bracketed driver headings.
Fresh Meats sales ¥5,519 億円 (+452, +8.9%), domestic 4,540 (+7.1%) and Australia 978 (+18.1%); business profit 203 (-74, -26.8%), domestic 189 (-5.5%) and Australia 14 (-64, -81.9%); margin 3.7% (-1.8 pt), Australia 1.4% (-7.9 pt). Sales rose on steady volumes and price pass-through. Profit fell on high Australian cattle prices plus a domestic Australian glut from weak exports, higher feed, labor and logistics costs, and lower chicken output after the fire at the Shiretoko Foods plant. Food sales group YoY by species (volume/value): beef domestic 101%/114%, imported 98%/115%; pork 105%/105% and 97%/101%; chicken 101%/102% and 76%/99%; total 102%/106%, 90%/107%, 98%/106%. Channel volumes: mass retail 100%, food service 107%, other 97% (total volume 99%, value 107%).
Left P&L table with domestic/Australia sub-rows; right commentary boxes; bottom-right species table and a small bar chart of channel volumes.
Business profit bridge from 277 to 203: external environment -18 (higher feed unit prices for domestic pork and chicken), expenses -51 (labor and logistics), internal improvement +63 (chicken productivity, more hogs raised, price pass-through and sales measures), Australia -64 (safeguard tariffs triggered in China and Korea weakened selling prices while cattle prices stayed high; a higher share of premium beef cushioned volatility), other overseas +11 (Chilean and Brazilian pork replacing Spanish pork), other settlement adjustments +11, fire impact -26 (lost chicken output and opportunity loss from the Shiretoko Foods plant fire).
Horizontal waterfall chart on the left; driver commentary on the right with footnotes defining fire impact and SG (safeguard).
Sales ¥252 億円 (+24, +10.6%); business profit 96 (+12, +14.6%); margin 38.2% (+1.3 pt). A close pennant race kept attendance strong and new fan experiences lifted profitability. Hokkaido Ballpark F Village visitors were 3.32 million in H1 versus 3.40 million a year earlier (professional baseball games 2.21 million vs 2.23 million; other 1.11 million vs 1.17 million). Highlights: the Fighters 'Super Summer Festival' events; six farm-team games held in Hokkaido drawing about 55,000 fans including about 19,000 at ES CON FIELD; The Fifty Fifty Club, described as the world's first ballpark restaurant that brews wine; and the Japan Tourism Award 2026 (Commissioner of the Japan Tourism Agency award).
Top-left P&L table, bottom-left stacked bar chart of visitor numbers, right panel with a headline and four captioned photos.
Section divider repeating the contents page with section 02 (full-year plan) highlighted: plan highlights (page 14), Processed Foods plan (page 17), Fresh Meats plan (page 19).
Contents layout with non-active sections greyed out and the active section in full color.
FY2026/3 actual vs FY2027/3 forecast in ¥100 million: net sales 14,574 to 15,000 (+426, +2.9%); business profit 683 to 500 (-183, -26.8%); margin 4.7% to 3.3%; profit before tax 545 to 520 (-25, -4.7%); profit attributable to owners of the parent 351 to 350 (-1, -0.2%); ROE 6.6% to 6.7%; ROIC 6.1% to 4.4%; EPS ¥120.4 to ¥128.7.
Eight-row comparison table with the forecast column highlighted in orange.
Business profit by segment comparing the 1Q-time and 2Q-time forecasts (¥100 million). Processed Foods: 1Q actual 7; H1 forecast 30 vs actual 13 (-17); H2 forecast 90 revised to 47 (-43); full year 120 revised to 60 (-60). Fresh Meats: 1Q 153; H1 240 vs 203 (-37); H2 260 to 247 (-13); full year 500 to 450 (-50). Sports & Entertainment: 1Q 49; H1 95 vs 96 (+1); H2 -55 to -56; full year 40 unchanged. Eliminations: full year -50 unchanged. Consolidated: 1Q 194; H1 340 vs 288 (-52); H2 270 to 212 (-58); full year 610 revised to 500 (-110).
Grid table with grouped headers for 1Q, first half, second half and full year, each with forecast, actual and variance sub-columns.
Waterfall from the 1Q-time full-year business profit forecast of ¥610 億円 to the 2Q-time forecast of ¥500 億円: Processed Foods -60 (external environment +7, internal improvement -68, dairy etc. 0, other +2, overseas -2); Fresh Meats -50 (external environment -13, expenses -10, internal improvement -3, Australia -26, other overseas 0, fire impact 0); Sports & Entertainment 0; eliminations 0.
Vertical waterfall with y-axis 0-700, segment boxes outlined in orange with driver lists.
Processed Foods FY2027/3 2Q-time forecast: sales ¥5,600 億円 (+297, +5.6% vs 5,303), domestic 4,200 (+4.2%), overseas 1,400 (+10.1%); business profit 60 (-12, -16.5% vs 72; 1Q plan was 120), domestic 61 (-35.3%), overseas -1 (+21); margin 1.1%. Sales growth from promoting key brands and new products, large year-end food-service promotions, and new North American channels. Profit lower as domestic topline growth lags; North America gains on volume and Thailand cuts costs through slimming toward profitability. Full-year consumer sales plan YoY: wiener group 106% (Schau Essen 107%), ham/bacon 96%, consumer total 104%, food service 104%, total 104%; processed products total 102% (chilled bakery 105%, Chinese dishes 100%, fried chicken 99%, hamburg/meatballs 100%, food service 98%).
Left table with FY2026/3 actual, 1Q-time plan and 2Q-time forecast columns; right commentary boxes and product-category plan tables.
Domestic business profit bridge for the full year: 94 to 61 (external environment -74, internal improvement +25 consisting of volume/mix +57 and higher expenses -32, dairy/marine/extracts +5, other +10). Overseas: -22 to -1 (+22). Plans include price revisions that absorb external costs above initial assumptions, brand promotion and new products, food-service proposals to new accounts, staffing optimization and line consolidation. North America moves into a volume-expansion phase after completing its production base (full-capacity test runs at the acquired plant); Thailand accelerates restructuring and strengthens domestic sales in collaboration with CPF (Charoen Pokphand Foods).
Horizontal waterfall split into domestic and overseas panels on the left; detailed driver commentary on the right.
Fresh Meats forecast: sales ¥10,450 億円 (+109, +1.1% vs 10,341), domestic 8,690 (+0.6%), Australia 1,760 (+3.2%); business profit 450 (-163, -26.6% vs 613; 1Q plan 500), domestic 416 (-10.5%), Australia 34 (-114, -77.0%); margin 4.3%, Australia 1.9%. Sales up through timely price pass-through; profit down as Australian cattle prices stay high, imported chicken sourcing worsens with soft selling prices, and feed and fuel costs keep rising. A diagram on the Australian beef business shows production (high cattle prices), feeding (grain-fed and premium-grass value strategy) and sales (a geographically diversified global portfolio), with premium-brand processing raised so the brand ratio exceeded 60% in H1.
Left plan table; right commentary boxes plus a three-step flow diagram with icons (price chart, cattle, globe).
Full-year business profit bridge from 613 to 450: external environment -29 (further feed price rises), expenses -106 (labor, logistics, packaging and fuel), internal improvement +119 (efficiency at four chicken plants covering the Shiretoko shortfall, productivity at new pig farms, disease prevention, price pass-through, branded meat and processed sales, route sales reform, logistics efficiency), Australia -114 (selling prices expected to recover in H2 but cattle prices remain high), other overseas +5 (Chilean and Brazilian pork), other 0, fire impact -38.
Horizontal waterfall on the left, structured commentary on production and sales strategies on the right.
Section divider highlighting section 03: FY2026/3 consolidated results and FY2027/3 plan (page 22), balance sheet and cash flow statement (page 23), capex and depreciation (page 24), appendix (page 25).
Contents layout with the third section active and the others greyed out.
Detailed P&L in ¥ million. FY2027/3 H1 actual: net sales 769,358 (+6.5%), cost of sales 647,490, gross profit 121,868 (-6.3%, margin 15.8%), SG&A 97,949, operating profit 23,919 (-32.3%), other income/expenses 8,753, finance -661, equity-method -1,179, profit before tax 30,832 (-19.4%), income taxes 10,564 (tax rate 34.3%), net profit to owners 17,394 (-25.0%), business profit 28,806 (-20.7%). Full-year plan: sales 1,500,000 (+2.9%), gross profit 240,000 (16.0%), SG&A 198,000, operating profit 42,000 (-27.1%), profit before tax 52,000, net profit 35,000 (-0.2%), business profit 50,000 (-26.8%). FY2026/3 full-year actual: sales 1,457,391, operating profit 57,600, net profit 35,066, business profit 68,342. Notes: H1 other income rose mainly on ¥7.2 billion (72億円) of fire insurance proceeds; the full-year plan includes about ¥5.4 billion of FX gains and about ¥1.5 billion of interest expense.
Dense multi-column table: FY2026/3 H1, H2 and full-year actuals on the left, FY2027/3 H1 actual, H2 plan and full-year plan with change rates (red-boxed) on the right, plus a reconciliation from operating profit to business profit at the bottom and a notes column.
Total assets ¥1,023,011 million at H1-end (+25,534, +2.6% vs March 2026); current assets 467,277; non-current assets 555,734; total liabilities 488,626 (+9.6%); total equity 534,385 (-3.1%); D/E ratio 0.56 vs 0.43. Cash fell 21.6% to ¥53.9 billion while inventories rose 19.8% to ¥183.9 billion on higher meat unit prices and volumes; interest-bearing debt rose 26.8% to ¥289.8 billion. H1 cash flows: operating -9,762 (vs +42,463), investing -20,257, financing +15,023, reflecting inventory build, tax payments, ¥30.0 billion of share buybacks and ¥67.4 billion of new short-term borrowings.
Upper balance-sheet table with three period columns plus change, a boxed explanatory note, lower cash-flow table and another boxed note.
H1 capex ¥17,600 million (+44.0% vs 12,219): Processed Foods 4,754, Fresh Meats 8,826 (+59.1%), Sports & Entertainment 276 (-79.6%), eliminations/other 3,744; full-year capex plan ¥60,000 million (Processed Foods 17,200, Fresh Meats 31,700, Sports & Entertainment 3,100, other 8,000). Depreciation H1 15,384 (+1.4%), full-year plan 32,000 (excluding right-of-use assets). Plan: reinforce existing businesses via maintenance and restructuring while accelerating strategic allocation to growth areas, including upstream domestic meat, Australian feedlot expansion, facilities around a new station opening near the ballpark in 2028, brands, overseas expansion, R&D and environment.
Capex and depreciation table by segment with H1 actual highlighted, followed by a red-bordered text box describing the full-year investment plan.
Divider slide introducing the appendix of profit variance tables and market data.
Centered 'Appendix' title with the Nipponham Group logo, flanked by yellow-orange halftone panels, mirroring the cover design.
Ham/sausage and processed products -29 YoY (vs 1Q forecast -19): gross profit -15 (volume +3 from Schau Essen and Ishigama Kobo; unit price -18 consisting of product mix +4 and external environment -22, with main raw materials -12 and packaging -10); expenses -14 (utilities -2, other -12 as logistics, commissions and labor rose despite line cuts). Dairy/marine/extracts/primary processing +4; other domestic adjustments +9 (lower DX/IT costs); overseas +7. Total -9 (vs 1Q forecast -17).
Hierarchical variance table with YoY change, main drivers text, and variance to 1Q forecast; hatched cells where no comment applies.
Ham/sausage and processed products -49 YoY (vs 1Q forecast -60): gross profit -3 (volume +6, unit price -9 with price revisions/mix +51 and external environment -60, main raw materials -28 and packaging -32); expenses -46 (utilities -14, other -32 from brand promotions offset partly by staffing and line consolidation). Dairy/marine/extracts +5; other adjustments +10; overseas +22 (North America volume expansion, Thailand restructuring and CPF collaboration). Total -12 (vs 1Q forecast -60).
Same hierarchical variance table format as page 26 for the full-year plan.
YoY H1 changes (¥100 million): domestic beef and pork +6 (more hogs offset feed and production costs); domestic chicken -33 (Shiretoko fire impact of -26 plus feed and cost inflation); imported meats -1 (domestic import business -12 as overseas purchase prices rose and domestic prices softened; other overseas +11 from Chilean and Brazilian pork); sales (food) and logistics +12 (price pass-through); Australia -64 (safeguards in China and Korea and persistently high cattle prices); other +5. Total -74 (vs 1Q forecast -37).
Variance table with business-line rows, YoY change, drivers and variance to 1Q forecast.
Full-year YoY plan: domestic beef and pork +4 (stable new pig farm operations); domestic chicken -31 (fire impact -38 partly covered by efficiency at four plants); imported meats -30 (domestic import -35 on worse chicken sourcing and soft prices; other overseas +5); sales and logistics +9 (growth-account strategies, route sales, branded meat); Australia -114 (selling prices to recover in H2 but cattle prices remain high); other 0. Total -163 (vs 1Q forecast -50).
Same variance-table format as page 28 for the full-year plan.
Monthly price lines for FY2025/3, FY2026/3 and FY2027/3 (April to September so far): domestic chicken market price (about ¥670-690/kg in FY2027/3, near prior-year levels), domestic pork carcass wholesale price in Tokyo (around ¥600-770/kg, ending September near ¥600), Australian young cattle producer price (A$/kg axis; FY2027/3 roughly A$800-1,000, well above prior years), and Brazilian chicken thigh price in Japan (FY2027/3 starting near ¥770/kg and falling to roughly ¥530-560/kg). Exact values are read from charts and are approximate. A QR code links to the company's market trend data page.
Four line charts in a 2x2 grid, each with a peach title tag and source note; QR code and URL at bottom right.
Monthly price lines: compound feed price (¥/ton; FY2027/3 about ¥91,000 rising to about ¥94,000 in July, above the ¥85,000-89,000 range of prior years), natural casing import price (mainly sheep casings; roughly ¥4,400-5,100/kg, in line with prior years), and seasoned pork (GSP) import price (FY2027/3 about ¥640-670/kg, above prior years). Values are approximate readings from charts; sources are the Agriculture and Livestock Industries Corporation and Ministry of Finance trade statistics.
Three line charts (two top, one bottom-left) with title tags and source notes; empty bottom-right quadrant.
Investor relations contact: NH Foods Ltd. VBM Promotion Office, ThinkPark Tower, 2-1-1 Osaki, Shinagawa-ku, Tokyo; telephone and IR email listed. A cautionary note explains that the materials contain forward-looking statements based on current assumptions and are subject to economic, market and FX conditions, so actual results may differ.
Logo top-left, contact block in the middle, bordered disclaimer box at the bottom, halftone gradient on the right.
Perguntas comuns sobre este slide e o conteúdo da apresentação subjacente.
The original slides are in Japanese. NH Foods Ltd. (日本ハム株式会社) published them as its earnings briefing materials (決算説明会資料) for the second quarter of the fiscal year ending March 2027 on TDnet, the Tokyo Stock Exchange's timely disclosure system, on November 2, 2026. This page summarizes every slide in English; amounts keep the company's own units, mostly ¥100 million (億円).
Japanese companies label a fiscal year by the month it ends, so FY2027/3 is the year from April 2026 to March 2027. Following the common convention for Japanese issuers, this gallery calls that year FY2026, so H1 FY2026 covers April to September 2026.
Net sales rose 6.5% to ¥769.4 billion (¥7,694 億円), business profit fell 20.7% to ¥28.8 billion (¥288 億円), and profit attributable to owners of the parent fell 25.0% to ¥17.4 billion (¥174 億円). EPS was ¥62.3 after the 3-for-1 stock split.
Yes. The full-year business profit forecast was cut from ¥61.0 billion (610 億円) at the first quarter to ¥50.0 billion (500 億円), mainly Processed Foods (-60 億円) and Fresh Meats (-50 億円). Sales guidance is ¥1.5 trillion (15,000 億円) and net profit guidance ¥35.0 billion (350 億円), supported by fire insurance proceeds.
The Australian beef business saw high cattle prices and weak selling prices after China and Korea triggered safeguard tariffs, cutting Australian profit by ¥6.4 billion in H1. Higher feed, labor and logistics costs and lost chicken output after a fire at the Shiretoko Foods plant (-26 億円 in H1) added to the decline.
The KPI summary slides (pages 3-4), the waterfall profit bridges (pages 7, 9, 11, 16, 18, 20) and the guidance revision table (page 15) work well as models for any results presentation. The appendix variance tables (pages 26-29) show how to explain drivers line by line.
Yes, the original PDF of the 32-slide Japanese deck is available from this gallery page. An editable PPTX is not attached for this deck.
Original Japanese-language disclosure dated November 2, 2026; TDnet keeps filings online for a limited period.
Company IR page referenced on slide 30 for additional commodity price data.

Create Your Own Slides
Turn your ideas into professional presentations in seconds with 2slides AI.
Referencie designs profissionais, escolha seu estilo e gere slides com renderização de texto perfeita. Alimentado por Nano Banana—comece a criar sua apresentação agora.
Seu Agente IA para slides. Economize tempo, brilhe mais rápido com criação inteligente de apresentações.


© 2026 2slides. Todos os direitos reservados.