
Faz parte de Exemplos de apresentações para investidores · Exemplos de apresentações para investidores do Japão · Exemplos de apresentações para investidores de semicondutores
MinebeaMitsumi (TSE: 6479) H1 FY2026 earnings presentation for the fiscal year ending March 2027 (April 2026 to March 2027), dated November 6, 2026. This is a Japanese-language deck (original title 2027年3月期第2四半期 決算説明会資料) published on TDnet, the Tokyo Stock Exchange timely disclosure system; all analysis on this page is written in English and amounts are kept in yen as the company reports them, mostly ¥100 million (億円). The 45-page deck reports record first-half results (net sales ¥890.8 billion / 8,908億円, up 14.5%; operating income 581億円, up 30.8%; profit attributable to owners 510億円, up 78.4%), raises the full-year forecast to sales of 1兆7,300億円 and operating income 1,280億円, walks through quarterly trends for all four segments (Precision Technologies, Motor Lighting & Sensing, Semiconductor & Electronics, Access Solutions), and sets out management strategy around AI servers, the 'five growth areas + 1', capacity expansion and a dividend raise to ¥60.
Usa a capa desta apresentação como referência de estilo para slides criados a partir do seu próprio conteúdo. Ou escolha qualquer página abaixo para usar o layout dela como referência.
Navegação Rápida
Tags
Compartilhar os slides
MinebeaMitsumi (TSE: 6479) H1 FY2026 earnings presentation for the fiscal year ending March 2027 (April 2026 to March 2027), dated November 6, 2026. This is a Japanese-language deck (original title 2027年3月期第2四半期 決算説明会資料) published on TDnet, the Tokyo Stock Exchange timely disclosure system; all analysis on this page is written in English and amounts are kept in yen as the company reports them, mostly ¥100 million (億円). The 45-page deck reports record first-half results (net sales ¥890.8 billion / 8,908億円, up 14.5%; operating income 581億円, up 30.8%; profit attributable to owners 510億円, up 78.4%), raises the full-year forecast to sales of 1兆7,300億円 and operating income 1,280億円, walks through quarterly trends for all four segments (Precision Technologies, Motor Lighting & Sensing, Semiconductor & Electronics, Access Solutions), and sets out management strategy around AI servers, the 'five growth areas + 1', capacity expansion and a dividend raise to ¥60.
Visualização detalhada de cada página de slide, incluindo layout, conteúdo principal e elementos visuais.
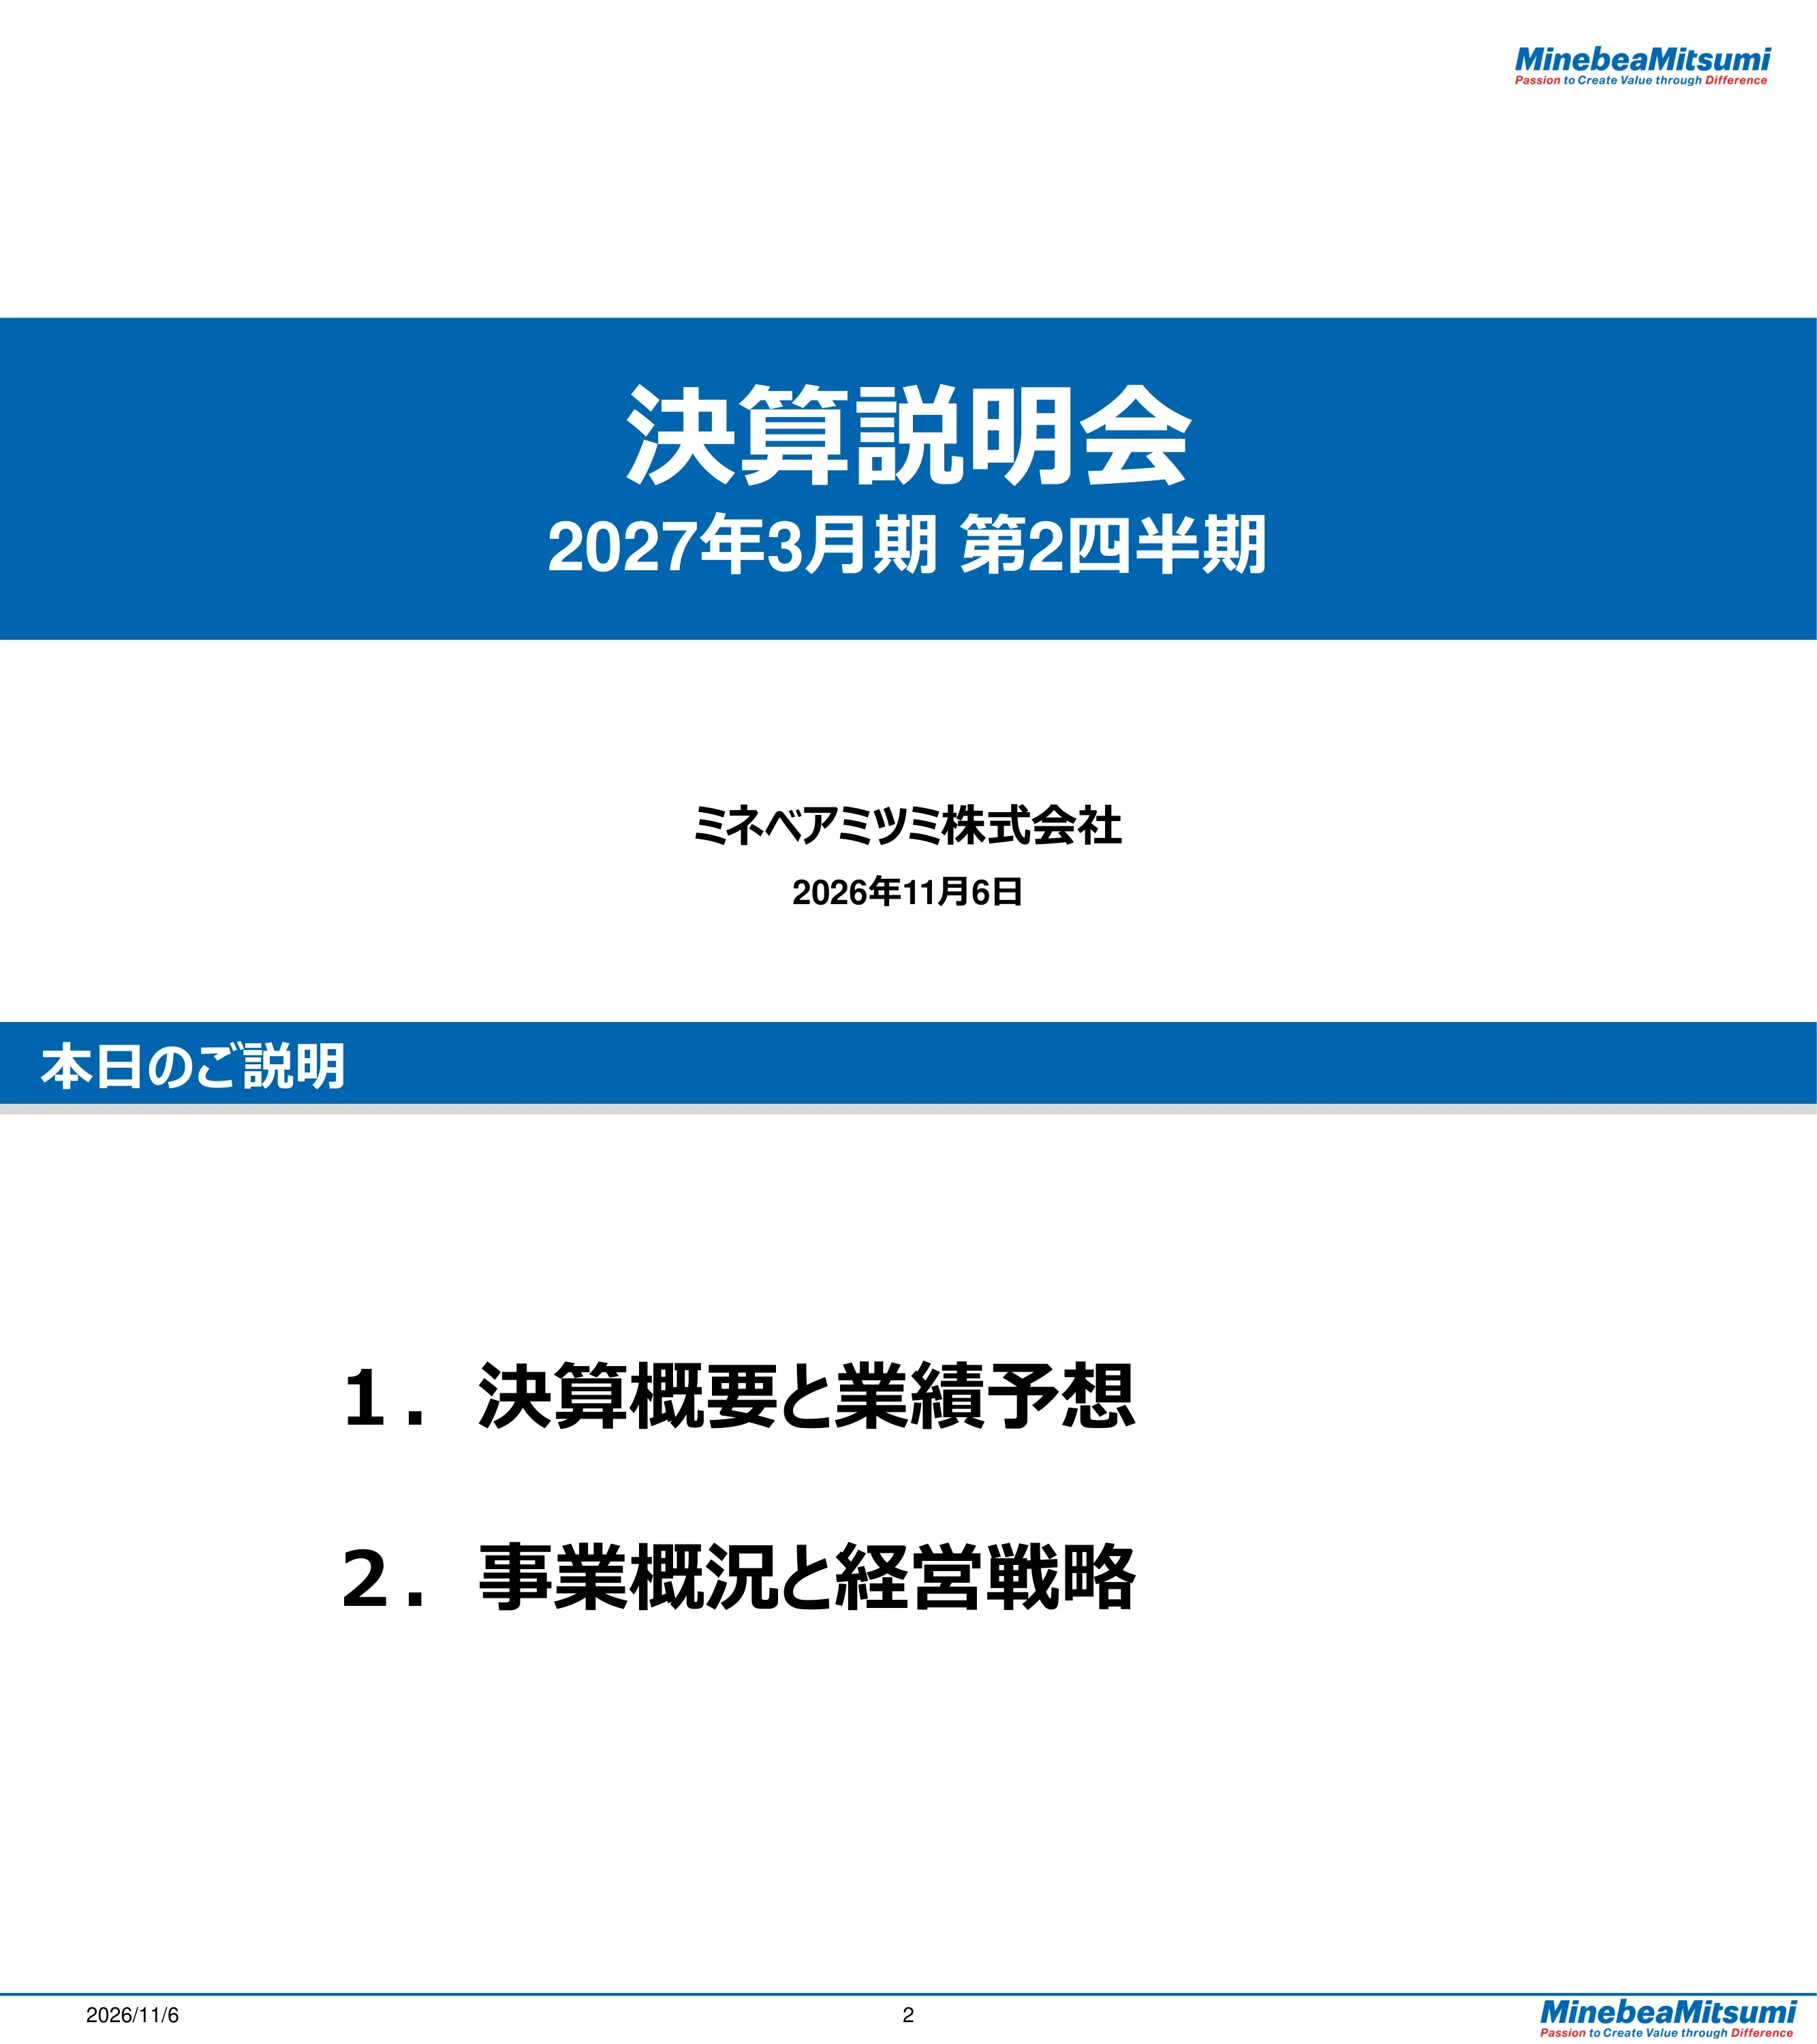
Title slide reading 決算説明会 (earnings briefing) for the second quarter of the fiscal year ending March 2027 (2027年3月期 第2四半期), presented by MinebeaMitsumi Inc. (ミネベアミツミ株式会社) and dated November 6, 2026.
Full-width blue horizontal band across the middle carrying the white title and period; company name and date centered below; MinebeaMitsumi logo with the tagline 'Passion to Create Value through Difference' at top right.
Two-part agenda: (1) Financial overview and earnings forecast (決算概要と業績予想); (2) Business update and management strategy (事業概況と経営戦略).
Blue header bar with title; two large numbered agenda items centered on white background; footer with date, page number and logo.
Section opener for the financial part, presented by Katsuhiko Yoshida (吉田 勝彦), Director, President and Executive Officer, COO & CFO.
Large centered black section title with presenter title and name beneath; white background; standard footer.
Headline: Q2 net sales, operating income and net profit were all record highs for a second quarter. In ¥100 million (億円): net sales 4,642 vs 4,114 a year earlier (+528, +12.8%) and 4,266 in Q1 (+376, +8.8%); operating income 318 vs 270 (+17.8%) and 263 in Q1 (+20.7%); profit before tax 420 vs 248 (+69.5%); profit attributable to owners of the parent 297 vs 177 (+67.9%) and 213 in Q1 (+39.5%); basic EPS ¥73.98 vs ¥44.07 (+¥29.91) and ¥53.03 in Q1. Q2 figures for pre-tax profit, net profit and EPS include special items. Exchange rates for Q2: US$ ¥160.70 (prior-year Q2 ¥146.33), euro ¥184.94, Thai baht ¥4.85, yuan ¥23.75.
Red headline across the top; main results table with columns for prior-year Q2, current Q1 and Q2 (Q2 boxed in red), YoY change and QoQ change; smaller exchange-rate table beneath; footnote marking special items.
First-half net sales, operating income and net profit were all record highs. In 億円: net sales 8,908 vs 7,783 (+1,124, +14.5%) against a previous H1 forecast of 8,465; operating income 581 vs 444 (+137, +30.8%; forecast 530); profit before tax 718 vs 404 (+77.9%; forecast 550); profit attributable to owners 510 vs 286 (+224, +78.4%; forecast 405); basic EPS ¥127.01 vs ¥71.18 (+¥55.83; forecast ¥100.85). H1 average rates: US$ ¥159.75 (prior ¥146.25), euro ¥184.90, baht ¥4.88, yuan ¥23.48.
Red headline; results table comparing prior H1, current H1 (red box), YoY change and growth rate, plus a separate column for the previous H1 forecast; exchange-rate table below.
Waterfall bridges from the August 5, 2026 forecast to Q2 actuals, in 億円. Net sales: forecast 4,199, PT +118, MLS +140, SE +151, AS +28, other +5, actual 4,642. Operating income: forecast 267, PT +56, MLS +42, SE -28, AS -26, other +7, actual 318. The semiconductor and access solutions segments beat on sales but missed on profit.
Two stacked horizontal waterfall charts (sales on top, operating income below) with a light-blue starting bar, grey segment increments, dark grey negatives and a solid blue ending bar.
Twelve-quarter view (FY3/25 to FY3/27 Q2), in 億円. FY3/25 sales 3,555 / 4,228 / 3,696 / 3,748 with operating income 189 / 279 / 262 / 215. FY3/26 sales 3,669 / 4,114 / 4,539 / 4,322 with operating income 174 / 270 / 313 / 283. FY3/27 Q1 sales 4,266, OI 263 (6.2%); Q2 sales 4,642, OI 318 (6.8%). Callouts show special items, e.g. -22 in FY3/27 Q1 and -16 in FY3/26 Q4. FY3/26 Q3 operating income was retroactively revised after completing the purchase price allocation for Minebea Linear Motion (ミネベアリニアモーション).
Clustered bar chart (light grey sales, dark grey operating income) with an overlaid blue margin line; current quarter highlighted in blue; special-item callout boxes; fiscal-year grouping on the x-axis.
PT sales rose from 627億円 in FY3/25 Q1 to 848億円 in FY3/27 Q2 (ball bearings 541, aerospace 216, PMC 92); Q1 FY3/27 was 820. Operating income reached a record 210億円 in Q2 (24.7% margin) after 191 (23.3%) in Q1, compared with 130 (20.8%) in FY3/25 Q1. From FY3/27 the sub-segment formerly called rod-end/fastener is renamed aerospace. Prior-year figures are not restated for the segment change.
Left: stacked bar chart of sales by sub-segment (bearings, aerospace, PMC). Right: grey operating income bars with a blue margin line; current quarter in blue.
MLS sales reached 1,295億円 in FY3/27 Q2 (motors 1,013, electro devices 176, sensing devices 104, other 2) vs 1,245 in Q1 and 991 in FY3/25 Q1. Operating income was 97億円 (7.5% margin) in Q2 vs 76 (6.1%) in Q1. Earlier quarters show special items of -8 (FY3/25 Q4) and -16 (FY3/26 Q4), with adjusted figures 56 and 79. From FY3/27, large machined aircraft parts moved from MLS 'other' to PT aerospace.
Left: stacked sales bars in four colors; right: operating income bars with margin line, hatched special-item portions and red adjusted values.
SE sales were 1,604億円 in FY3/27 Q2, up from 1,342 in Q1 and above 1,500 a year earlier, but below the FY3/26 Q3 peak of 1,867. Operating income fell to 52億円 (3.2% margin) in Q2 from 60 (4.5%) in Q1 and 74 (4.9%) in FY3/26 Q2. Special-item-adjusted peaks include 118 in FY3/26 Q3. The deck notes optical device demand peak shifting from Q2 to Q3.
Left: single-series sales bar chart with current quarter in blue; right: operating income bars with hatched special items and two margin lines (reported and adjusted).
AS sales were 883億円 in FY3/27 Q2 vs 845 in Q1 and a high of 925 in FY3/26 Q4. Operating income recovered to 33億円 (3.8%) in Q2 from 1億円 (0.1%) in Q1, when a -22 special item was booked (23 excluding it, 2.7%). FY3/26 Q4 operating income was 67 (7.2%).
Left: sales bars; right: operating income bars with margin line, hatched special-item bar for FY3/27 Q1 and red adjusted figures.
Quarterly net profit in 億円 with basic EPS in yen: FY3/25 131 / 119 / 174 / 170 (EPS 32.51 / 29.53 / 43.36 / 42.25); FY3/26 109 / 177 / 213 / 492 (EPS 27.12 / 44.07 / 52.96 / 122.46), with FY3/26 Q4 including +252 special items (240 and ¥59.73 excluding them); FY3/27 Q1 213 (¥53.03) and Q2 297 (¥73.98), Q2 including +84 special items (213 and ¥53.03 excluding them).
Grey bars for quarterly profit with a blue EPS line; hatched special-item portions; red dotted line for adjusted EPS; current quarter in blue.
Quarter-end inventories in 億円: FY3/25 3,596 / 3,358 / 3,566 / 3,509; FY3/26 3,708 / 4,021 / 4,117 / 3,913; FY3/27 Q1 4,329 and Q2 4,167, down 162 quarter on quarter.
Single-series bar chart across twelve quarter slots with the latest quarter in blue and the last two slots empty.
In 億円: operating CF 441 (FY3/23), 1,018 (FY3/24), 1,337 (FY3/25), 948 (FY3/26), 742 (FY3/27 H1), 1,781 (FY3/27 forecast). Investing CF -1,063, -763, -1,258, -828, -551 (H1), -981 (forecast). Free cash flow -622, 255, 79, 120, 191 (H1), 800 (forecast). Adjusted free cash flow excluding one-offs -75, 327, 489, 140. One-off adjustments: 547 in FY3/23 (Tokyo headquarters building, M&A of Honda Tsushin Kogyo, Sumiko Tec and Honda Lock), 72 in FY3/24 (RO-RA), 410 in FY3/25 (Hitachi Power Devices), 20 in FY3/26 (Tsubaki Nakashima ball screw and ball way business).
Bars for operating and investing CF with blue free cash flow line and red dotted adjusted FCF line; dashed forecast bars for FY3/27; table of adjustment amounts and one-off items under the chart.
MinebeaMitsumi-style ROIC = NOPAT (operating income x (1 - tax rate)) / invested capital (receivables + inventories + fixed assets - payables), calculated on segment-managed assets. Company ROIC: 10.0% (FY3/22), 9.0%, 5.3%, 6.3%, 6.4% (FY3/26, excluding special items) and 7.3% forecast for FY3/27. PT ROIC 25.0% in FY3/22, 20.3% forecast for FY3/27; quarterly PT reached 22.7% in FY3/27 Q2. MLS forecast 11.3%; SE and AS around 5.7% forecast. Quarterly company ROIC 5.6% in FY3/27 Q1 and 6.8% in Q2 (excluding special items).
Formula banner at top in a light blue panel; two multi-line charts below (annual on the left, quarterly on the right) with five series: company total in thick orange-red, PT, MLS, SE and AS.
Net sales and operating income forecasts raised. In 億円: net sales 17,300 (H1 8,908 actual, H2 8,392) vs 16,644 in FY3/26 (+656, +3.9%) and previous forecast 16,900; operating income 1,280 (H1 581, H2 699) vs 1,040 (+240, +23.1%) and previous 1,200; profit before tax 1,380 vs 1,338 (previous 1,180); net profit 1,000 vs 990 (+1.0%, previous 870); EPS ¥249.01 vs ¥246.60 (previous ¥216.64). H2 exchange-rate assumptions: US$ ¥155.00, euro ¥175.00, baht ¥4.65, yuan ¥23.00. FY3/26 operating income included about 26億円 of restructuring costs.
Red headline; forecast table with FY3/26 actual, FY3/27 H1/H2/full year, YoY change and previous forecast; exchange-rate assumptions below; footnotes.
Segment forecasts in 億円 (full year, change vs FY3/26, previous forecast). Sales: PT 3,350 (+538, +19.2%; prev 3,130); MLS 5,050 (+485, +10.6%; prev 4,920); SE 5,350 (-553, -9.4%; prev 5,300); AS 3,500 (+178, +5.3%; unchanged); other 50. Operating income: PT 800 (+178, +28.5%; prev 700); MLS 360 (+91, +33.7%; prev 310); SE 250 (-17, -6.3%; prev 280); AS 165 (-6, -3.4%; prev 185); other/adjustments -295 (prev -275). H1 actuals: PT 1,668 sales / 401 OI, MLS 2,540 / 172, SE 2,946 / 112, AS 1,728 / 34.
Two stacked tables (sales then operating income) with segment rows and columns for FY3/26, FY3/27 H1/H2/full year, YoY change and previous forecast; alternating blue row shading.
The capex budget is expanded given strong organic growth potential, focusing on capex for the five growth areas + 1 while keeping stable dividends. FY3/24 to FY3/26 actual allocation totalled 3,575億円: capex 2,350, M&A 517, dividends and buybacks 708. The FY3/27 to FY3/29 plan totals 5,000億円: the May 2026 plan had dividends about 800, M&A/buybacks about 1,500 and capex about 2,700; the update keeps dividends at about 800 and raises capex to about 2,700億円 + α, shifting part of the M&A/buyback budget to capex.
Red headline with blue sub-headline; grey panel comparing a stacked bar of past actuals with two stacked bars (previous plan vs update) for the next three years; arrow indicating reallocation.
Opens the strategy section (事業概況と経営戦略, 'Business Update & Management Strategy'), presented by Yoshihisa Kainuma (貝沼 由久), Representative Director, Chairman and CEO, on November 6, 2026.
Logo and large blue title at upper left with English subtitle; presenter name and date at right; large image of a ball bearing wrapped around a globe whose balls contain product images.
H1 sales, operating income and net profit were records and the full-year forecast is raised. Company-wide: PT and MLS drove growth, offsetting slowdowns in automotive and gaming; demand in the five growth areas + 1 expanded steadily; underlying operating margin heads to 8.7% for the full year. PT: H1 segment sales and operating income at records, full-year operating income of 800億円 in sight; bearings and aerospace both at record sales and profit. MLS: motor mix improved with higher value-added products, electro devices solid, sensing restructuring contributing to profitability. SE: groundwork for medium- to long-term semiconductor growth progressing; optical device peak shifted from Q2 to Q3 but the full year is on plan. AS: affected by the automotive slowdown in China and Europe, while Japan, Asia and North America were solid, as were motorcycles and industrial machinery.
Red headline; five rows each with a light-blue segment label box on the left and bullet text on the right, key phrases in red.
Full-year forecast raised to net sales 1兆7,300億円 and operating income 1,280億円. H2 expected to show lower sales but higher profit due to seasonality; record full-year sales, operating income and net profit expected, with Toshiba share valuation lifting net profit. Table in 億円: FY3/26 H1/H2/full year sales 7,783 / 8,861 / 16,644; FY3/27 H1 8,908 (+14.5%), H2 8,392 (-5.3%), full year 17,300 (+3.9%). Operating income 581 (+30.8%) / 699 (+17.4%) / 1,280 (+23.1%). Operating margin 6.5% / 8.3% / 7.4%; underlying operating margin 7.8% / 9.6% / 8.7% (previous forecast 8.3%). Net profit 510 / 490 / 1,000; excluding Toshiba share valuation gains 426 / 916 for H1 and full year. EPS ¥127.01 / ¥122.00 / ¥249.01 (excluding Toshiba ¥106.06 / ¥228.06).
Red headline; label box with three bullet points; large table with FY3/26 and FY3/27 half-year columns, YoY columns and previous forecast; bracketed figures exclude Toshiba share valuation; footnote below.
Data center demand and strong aerospace put full-year PT operating income of 800億円 in sight. Bearings: strong data center demand keeps utilization high; Q2 average production of 370 million units per month (3.7億個/月) was a record, targeting maximum capacity of 404 million per month by extending operating hours on all lines and shortening changeovers; pricing priority is maintaining and expanding market share. Aerospace: repricing from renewed long-term agreements (LTA) supports profit growth from H2; build rates rising. PMC: HDD demand firm with volume growth; raw material cost pass-through progressing. Right panel charts the company's own estimate of commercial aircraft production rates CY18 to CY30, recovering to pre-COVID levels in 2026, driven by passenger recovery and fuel-efficient replacement demand.
Two columns: left blue 'key points' panel with three numbered sub-sections; right area chart of aircraft production rate with a red external-environment box and red annotation at 2026.
AI server demand is lifting motors and battery protection modules, and sensing sees more inquiries from humanoid robots. Motors: AI server fan motors, stepping motors for valve actuation in liquid cooling systems and HDD spindle motors performing well; mix shift to high value-added products improves profitability. Electro devices: BBU battery protection modules for AI servers above plan; new production at a Mexico plant from February 2027. Sensing devices: restructuring improves profitability; inquiries rising for strain-gauge thin-film copper alloy sensor 'Minege' and joint torque sensors for humanoid robots. Server motor production: capacity added at a new Cambodia plant, multi-site production with main sites in Phnom Penh (Cambodia), Bang Pa-in and Lopburi (Thailand) and Xiqin (Shanghai).
Left: three numbered key-point sections; right: production-system text, three aerial factory photos and a rounded panel with product photos of fan motor, stepping motor and HDD spindle motor.
Acquisition of Panasonic Industry's automotive motor and automotive cooling fan motor businesses (annual sales about 320億円 in FY3/25) to strengthen motors, a core '8 spears' (8本槍) product, and automotive motors. Scheme: Japan via share transfer of a new company after an absorption-type split, Philippines via share transfer, China (Xiamen, Zhuhai) via business transfer. Final agreement signed May 13, 2026; closing originally planned for November 2, 2026 is postponed to March 1, 2027 to ensure stable transactions after the transition. Synergies: acquiring motor engineers and production engineers, adding high-reliability brushes, high-output motors and fluid-bearing fan motors; expanding to new customers including Tier 1s; combining motor know-how for higher value-added solutions. Product images: battery cooling blower, radiator cooling motor, brake motor and fluid-bearing fan.
Red headline; left blue panel with three numbered synergies; right deal-overview table with the schedule row outlined in red; product images along the bottom right.
Semiconductors are steadily building the base for medium- to long-term growth. The Shiga plant is expected to reach monthly profitability in Q4 as planned. Growth drivers include lithium battery protection ICs with strong share, IGBTs for railways, plus industrial IGBTs, data center products, medical ICs and MEMS (microphones and sensors); 800V HVDC is an entry opportunity for the company's power semiconductors, with measures under way with some customers. Optical devices: peak shifted from Q2 to Q3 but full year on plan; production volumes being watched. Mechanical components: productivity down on soaring memory and other parts prices; cycle in a stagnant phase, waiting for demand recovery. Semiconductor sales plan: about 1,300億円 in FY3/26 to 1,700億円 in FY3/29, CAGR 9.4%, broken down into nine product groups from lithium battery protection ICs to magnetic sensors.
Left: three numbered key-point sections; right: stacked bar chart of semiconductor sales plan for FY3/26 to FY3/29 with nine color-coded product categories and a yellow growth arrow.
Despite slowdowns in China and Europe, North America, Japan and industrial machinery are broadly solid, and the BMW winglet launch is going well. Four-wheel business: weak China market and slower major European customers, offset by North America and Japan; BMW winglet (wing-shaped door handle adopted by BMW) ramp-up strong, with development of follow-on high value-added products accelerated. Two-wheel and industrial machinery: motorcycles driven by ASEAN and South America; industrial machinery keeps high profitability on real demand from increased rice production. New technologies from 'sougou' (相合, combining group capabilities): in-cabin display actuator combining automotive electrical products and bearings, and a headlight actuator combining automotive electrical products and motors for market-first two-directional road and wall projection, both in mass-production development.
Red two-line headline; left key-points panel with two numbered sections; right panel with two product stories, each with a photo and component images joined by multiplication signs.
Demand expanding in AI servers, aerospace and new mobility, with humanoids, commercial drones and full self-driving moving toward practical use. Market growth (CY26-30 CAGR, company estimates): AI servers about 8% (server production units; liquid cooling, 800V power and optical transmission advancing), humanoid robots about 86% (shipments), commercial drones about 8%, full self-driving LiDAR about 26% (mechanical LiDAR units), new mobility about 6% (automotive electrical systems market), aerospace (+1) about 8%. Medium-term sales forecast for the five growth areas + 1 revised up: 2,280億円 in FY3/26 to 3,000 in FY3/27 (previously 2,790), 3,500 in FY3/28 (previously 3,300) and 4,300 in FY3/29 (previously 4,000), CAGR about 24%.
Red and blue headlines; table-style rows with market name and image, CAGR, and latest topics/needs; right column bar chart of medium-term sales with dashed boxes showing upward revisions.
Server units are forecast to keep growing (company estimates from market research): CAGR about 8% for CY25-30 and about 19% for CY31-35, with units rising from roughly 25 million in CY25 toward about 80 million by CY35 (axis reading). AI servers are mainly hybrid liquid plus air cooling; edge AI device demand is expanding. Company AI-server-related sales: 1,500億円 in FY3/27 (1,480 mass production + 20 in development/expansion), 1,800 in FY3/28 (1,750 + 50) and 2,300 in FY3/29 (2,100 + 200), CAGR about 24%. Mass-production products: bearings, pivot assemblies, small fan motors, spindle motors, battery protection modules; development products: large fans, valves, pump motors, pressure sensors, semiconductors, leak sensors, connectors, power supplies. New needs: cooling (water to refrigerant), power efficiency (AC to DC 800V; Fin-SiC and trench SiC power devices), faster communications (copper to optical CPO; shuttered optical connectors and CPO connectors).
Two-column layout: left bar chart of server units CY25-CY35 with growth arrows and a text box on market trends; right stacked bar chart of company sales by product status with a text box on new market needs and small product photos.
Basic policy: avoid overinvestment and pursue sustainable high profitability through flexible use of existing equipment and highly versatile products while managing market volatility. (1) Disciplined capex: no excessive upfront investment, phased expansion based on market trends, avoiding overcapacity and optimizing production sites. (2) Strength of general-purpose products: core parts such as bearings and motors are not AI-specific, so no huge AI-dedicated capex is needed and dependence on specific customers or uses is limited. (3) Diversification through the five growth areas + 1: AI servers lead, but drones, humanoid robots and others broaden the portfolio.
Basic-policy statement in red at top with a dark vertical marker; three equal-width numbered boxes with dark navy number tabs, a blue lead sentence and arrow bullets.
In 億円: net sales 15,227 (FY3/25), 16,644 (FY3/26), 17,300 (FY3/27 forecast), 18,000 (FY3/28 forecast), 19,000 (FY3/29 forecast); operating income 945, 1,040, 1,280, 1,450, 1,680. Reported operating margin 6.2%, 6.2%, 7.4%, 8.1%, 8.8%. Underlying operating margin, excluding sales of consigned (supplied) parts, 7.3%, 7.5%, 8.7%, 9.3%, 10.1%.
Paired bar chart (sales and operating income) with two line series for reported and underlying margins; forecast years in lighter shades with dashed lines; red boxed labels for underlying margin.
A ¥10 dividend increase is planned for this year, and capex to meet strong demand will be pursued actively. Dividends: FY3/26 interim ¥25, year-end ¥25, annual ¥50 (+¥5); FY3/27 interim ¥30, year-end ¥30 planned, annual ¥60 planned (+¥10). The FY3/27 annual dividend targets a consolidated payout ratio of about 30%. Share buybacks: dividends are the basis of returns, with buybacks considered flexibly when surplus cash flow arises, depending on conditions and share price.
Red headline with black sub-headline; dividend table with interim, year-end, annual and YoY columns (FY3/27 row in red); explanatory text and a share buyback section below.
Capacity is being expanded ahead of strong demand. Yonago plant new building: floor area about 6,400 m², motor development. Philippines Cebu plant Building 14: 14,413 m² on each of two floors, analog semiconductors. Germany Cerobear new building: about 4,000 m², bearings for aerospace. India Chennai plant: site about 100,000 m², power semiconductors and automotive motors. In addition, a new factory in the Philippines is planned to be acquired.
Four quadrants, each with a blue-outlined title bar, a photo or rendering and a small spec table; yellow banner at the bottom with a red announcement.
The company will showcase the latest products and technology for the five growth areas + 1. CES 2027, Las Vegas, January 6-9, 2027: latest model of the robot hand well received in 2026, plus products for deploying physical AI, featuring its electro-mechanics solutions; a multi-finger robot hand with more dexterous movement including the wrist will be unveiled for humanoid robots. IR Day 2027: February 22, 2027, 13:00-16:00 (planned) at the company's Tokyo X Tech Garden (Shiodome), with demo exhibits, presentation and Q&A on products and technology in the five growth areas + 1.
Two side-by-side blue-headed panels; each with event description, date, venue and content; images of a robot hand and booth rendering on the left and a showroom photo on the right.
MinebeaMitsumi acquired naming rights to Shizuoka Prefecture's Ecopa Stadium and Ecopa Arena, renamed 'MinebeaMitsumi Stadium Ecopa' and 'MinebeaMitsumi Arena Ecopa' from April 2027. Shizuoka hosts the 40-year-old Hamamatsu plant, a key base for MLS technology development (motors, sensors for robot hands, BBU battery protection modules). Goals: raise awareness, recruit and retain local engineering talent and strengthen regional ties. Contract: five years from April 1, 2027, annual fee 4,500万円, about 800,000 expected annual visitors. Stadium in Fukuroi City, capacity 50,000 (largest in the prefecture); arena capacity 10,000, about 20 concerts a year.
Red headline and subtitle; centered blue explanatory text; two blue-headed columns with photos of the stadium and arena and grey fact boxes beneath.
MinebeaMitsumi received its first Disclosure Excellence Award (FY2026) from the Securities Analysts Association of Japan (SAAJ), ranking first in the electrical and precision equipment sector. The company commits to continued timely, fair and transparent disclosure in its IR activities.
Red headline with blue sub-headline; centered award medal graphic with SAAJ logo; grey text panel at the bottom.
Forward-looking statements are based on management judgment from currently available information and actual results may differ materially due to factors including economic conditions and demand, exchange and interest rates, and the ability to keep developing and launching products amid rapid technological change in electronics. All information belongs to MinebeaMitsumi and may not be reproduced, altered or redistributed without prior written approval.
Centered company logo with a block of small disclaimer text below; otherwise white.
Divider introducing the reference materials (参考資料) appendix.
Single centered blue heading on a white slide.
In 億円: FY3/23 sales 12,922, operating income 975 (7.5%, including +105 special items); FY3/24 14,021, 735 (5.2%); FY3/25 15,227, 945 (6.2%, special items -50); FY3/26 16,644, 1,040 (6.2%, special items -26); FY3/27 forecast 17,300, 1,280 (7.4%).
Clustered bars for sales and operating income with margin line; FY3/26 highlighted in blue, forecast in dashed outline; special-item callouts.
PT sales in 億円: 1,973 (FY3/23; bearings 1,462, aerospace 352, PMC 159), 2,114 (FY3/24), 2,557 (FY3/25), 2,812 (FY3/26; bearings 1,864, aerospace 660, PMC 287), 3,350 forecast for FY3/27 (bearings 2,120, aerospace 880, PMC 350). Operating income 430 (FY3/23; 454 excluding -24 special items), 380, 557, 622 and 800 forecast; margin 21.8%, 18.0%, 21.8%, 22.1% and 23.9% forecast.
Left stacked sales bars with dashed forecast; right operating income bars with margin line and special-item callout.
MLS sales in 億円: 3,663 (FY3/23), 3,694 (FY3/24), 4,077 (FY3/25), 4,565 (FY3/26; motors 3,403, electro devices 680, sensing 385, other 98), 5,050 forecast for FY3/27 (motors 3,880, electro devices 770, sensing 400). Operating income 9 (FY3/23, special items -109; 118 excluding), 119, 230 (238 excluding -8), 269 (285 excluding -16) and 360 forecast; reported margin rising from 0.3% to 7.1% forecast.
Left stacked sales bars; right operating income bars with hatched special items, reported and adjusted margin lines and dashed forecast.
SE sales in 億円: 5,301 (FY3/23), 4,947 (FY3/24), 5,276 (FY3/25), 5,903 (FY3/26), 5,350 forecast (FY3/27). Operating income 416 (FY3/23; 478 excluding -61 special items), 355, 220 (250 excluding -30), 267 (277 excluding -10) and 250 forecast; reported margin 7.9%, 7.2%, 4.2%, 4.5% and 4.7% forecast.
Left sales bar chart with dashed forecast; right operating income bars with special-item callouts and two margin lines.
AS sales in 億円: 1,947 (FY3/23), 3,221 (FY3/24), 3,281 (FY3/25), 3,322 (FY3/26), 3,500 forecast. Operating income 194 (FY3/23, including +173 special items; 21 excluding), 106, 159 (171 excluding -12), 171 and 165 forecast; margin 9.9%, 3.3%, 4.9%, 5.1% and 4.7% forecast.
Left sales bars; right operating income bars with hatched special items and margin line; dashed forecast boxes.
Net profit in 億円 with basic EPS: 732 (¥178.23) in FY3/23, 540 (¥133.05) in FY3/24, 595 (¥147.58) in FY3/25, 990 (¥246.60) in FY3/26 including +252 special items (738 and ¥183.87 excluding), and 1,000 (¥249.01) forecast for FY3/27 including +84 special items (916 and ¥228.06 excluding).
Bars for annual net profit with blue EPS line and red dotted adjusted EPS line; hatched special-item portions; dashed forecast box.
SG&A in 億円 with ratio to sales: FY3/25 436 (12.3%), 458 (10.8%), 444 (12.0%), 451 (12.0%); FY3/26 459 (12.5%), 469 (11.4%), 478 (10.5%), 497 (11.5%); FY3/27 Q1 520 (12.2%) and Q2 526 (11.3%).
Grey quarterly bars with blue ratio line and boxed labels; current quarter highlighted in blue.
Capex and depreciation in 億円: FY3/23 1,470 and 530 (capex includes acquisition of the new headquarters building); FY3/24 836 and 584; FY3/25 948 and 662; FY3/26 965 and 704; FY3/27 H1 592 and 377; FY3/27 forecast 1,000 and 750.
Paired bar chart with light grey capex and dark grey depreciation; H1 in light/dark blue; forecast as dashed outlines; footnote.
Perguntas comuns sobre este slide e o conteúdo da apresentação subjacente.
The original is a Japanese-language earnings briefing deck (決算説明会資料) titled 2027年3月期第2四半期 決算説明会資料, filed on TDnet, the Tokyo Stock Exchange timely disclosure system, under securities code 6479. The page-by-page summary on this page is an English rendering of its content, with amounts kept in yen as the company reports them.
MinebeaMitsumi's fiscal year runs April to March. This deck covers the second quarter and first half (April to September 2026) of the fiscal year ending March 2027, labelled FY2026 on this page and 27/3期 in the deck.
H1 net sales were 8,908億円 (+14.5% year on year), operating income 581億円 (+30.8%) and profit attributable to owners of the parent 510億円 (+78.4%), with EPS of ¥127.01. All three were record highs for a first half and came in above the previous H1 forecast.
It raised the FY3/27 forecast to net sales of 17,300億円 (from 16,900), operating income of 1,280億円 (from 1,200) and net profit of 1,000億円 (from 870), with EPS of ¥249.01. The underlying operating margin target rises to 8.7% from 8.3%.
Its Semiconductor & Electronics segment sells analog and power semiconductors such as lithium battery protection ICs, IGBTs/SiC, high-voltage ICs, medical ICs and MEMS sensors. The deck plans semiconductor sales growing from about 1,300億円 to 1,700億円 by FY3/29 and shows new capacity for analog semiconductors in Cebu and power semiconductors in Chennai.
The deck projects AI-server-related sales of 1,500億円 in FY3/27, 1,800億円 in FY3/28 and 2,300億円 in FY3/29 (about 24% CAGR), from bearings, fan and spindle motors, pivot assemblies and battery protection modules, with valves, pumps, sensors, power devices and optical connectors in development.
The annual dividend for FY3/27 is planned at ¥60 (¥30 interim, ¥30 year-end), up ¥10 from ¥50, based on a consolidated payout ratio of about 30%. Buybacks are considered flexibly when surplus cash flow arises.
Special items (特殊要因) are one-off gains and losses the company separates out, such as foreign-exchange contract effects and the valuation of its Toshiba shareholding. Bracketed net profit and EPS figures exclude the Toshiba share valuation; the company notes the accounting profit can move with that valuation at the half-year and year-end.
Original Japanese-language PDF filed on TDnet.

Create Your Own Slides
Turn your ideas into professional presentations in seconds with 2slides AI.
Referencie designs profissionais, escolha seu estilo e gere slides com renderização de texto perfeita. Alimentado por Nano Banana—comece a criar sua apresentação agora.
Seu Agente IA para slides. Economize tempo, brilhe mais rápido com criação inteligente de apresentações.


© 2026 2slides. Todos os direitos reservados.