
Marvell Technology's Q2 fiscal 2027 financial and business results (August 27, 2026) — a 36-slide deck covering record revenue of $2,739 million up 37% year over year, record data center revenue of $2,172 million up 46% and now 79% of the total, non-GAAP diluted EPS of $0.94 up 40% with non-GAAP operating margin expanding 180 basis points to 36.6%, an expanded commercial agreement with a Tier 1 hyperscaler covering custom silicon and TPU-ecosystem attach programs, raised outlooks of roughly $12 billion for FY27 and roughly $18 billion for FY28, Q3 guidance of $3.15 billion, and a fourteen-page appendix reconciling every GAAP measure to its non-GAAP counterpart.
Navegação Rápida
Tags
Compartilhar os slides
Marvell Technology's Q2 fiscal 2027 financial and business results (August 27, 2026) — a 36-slide deck covering record revenue of $2,739 million up 37% year over year, record data center revenue of $2,172 million up 46% and now 79% of the total, non-GAAP diluted EPS of $0.94 up 40% with non-GAAP operating margin expanding 180 basis points to 36.6%, an expanded commercial agreement with a Tier 1 hyperscaler covering custom silicon and TPU-ecosystem attach programs, raised outlooks of roughly $12 billion for FY27 and roughly $18 billion for FY28, Q3 guidance of $3.15 billion, and a fourteen-page appendix reconciling every GAAP measure to its non-GAAP counterpart.
Visualização detalhada de cada página de slide, incluindo layout, conteúdo principal e elementos visuais.
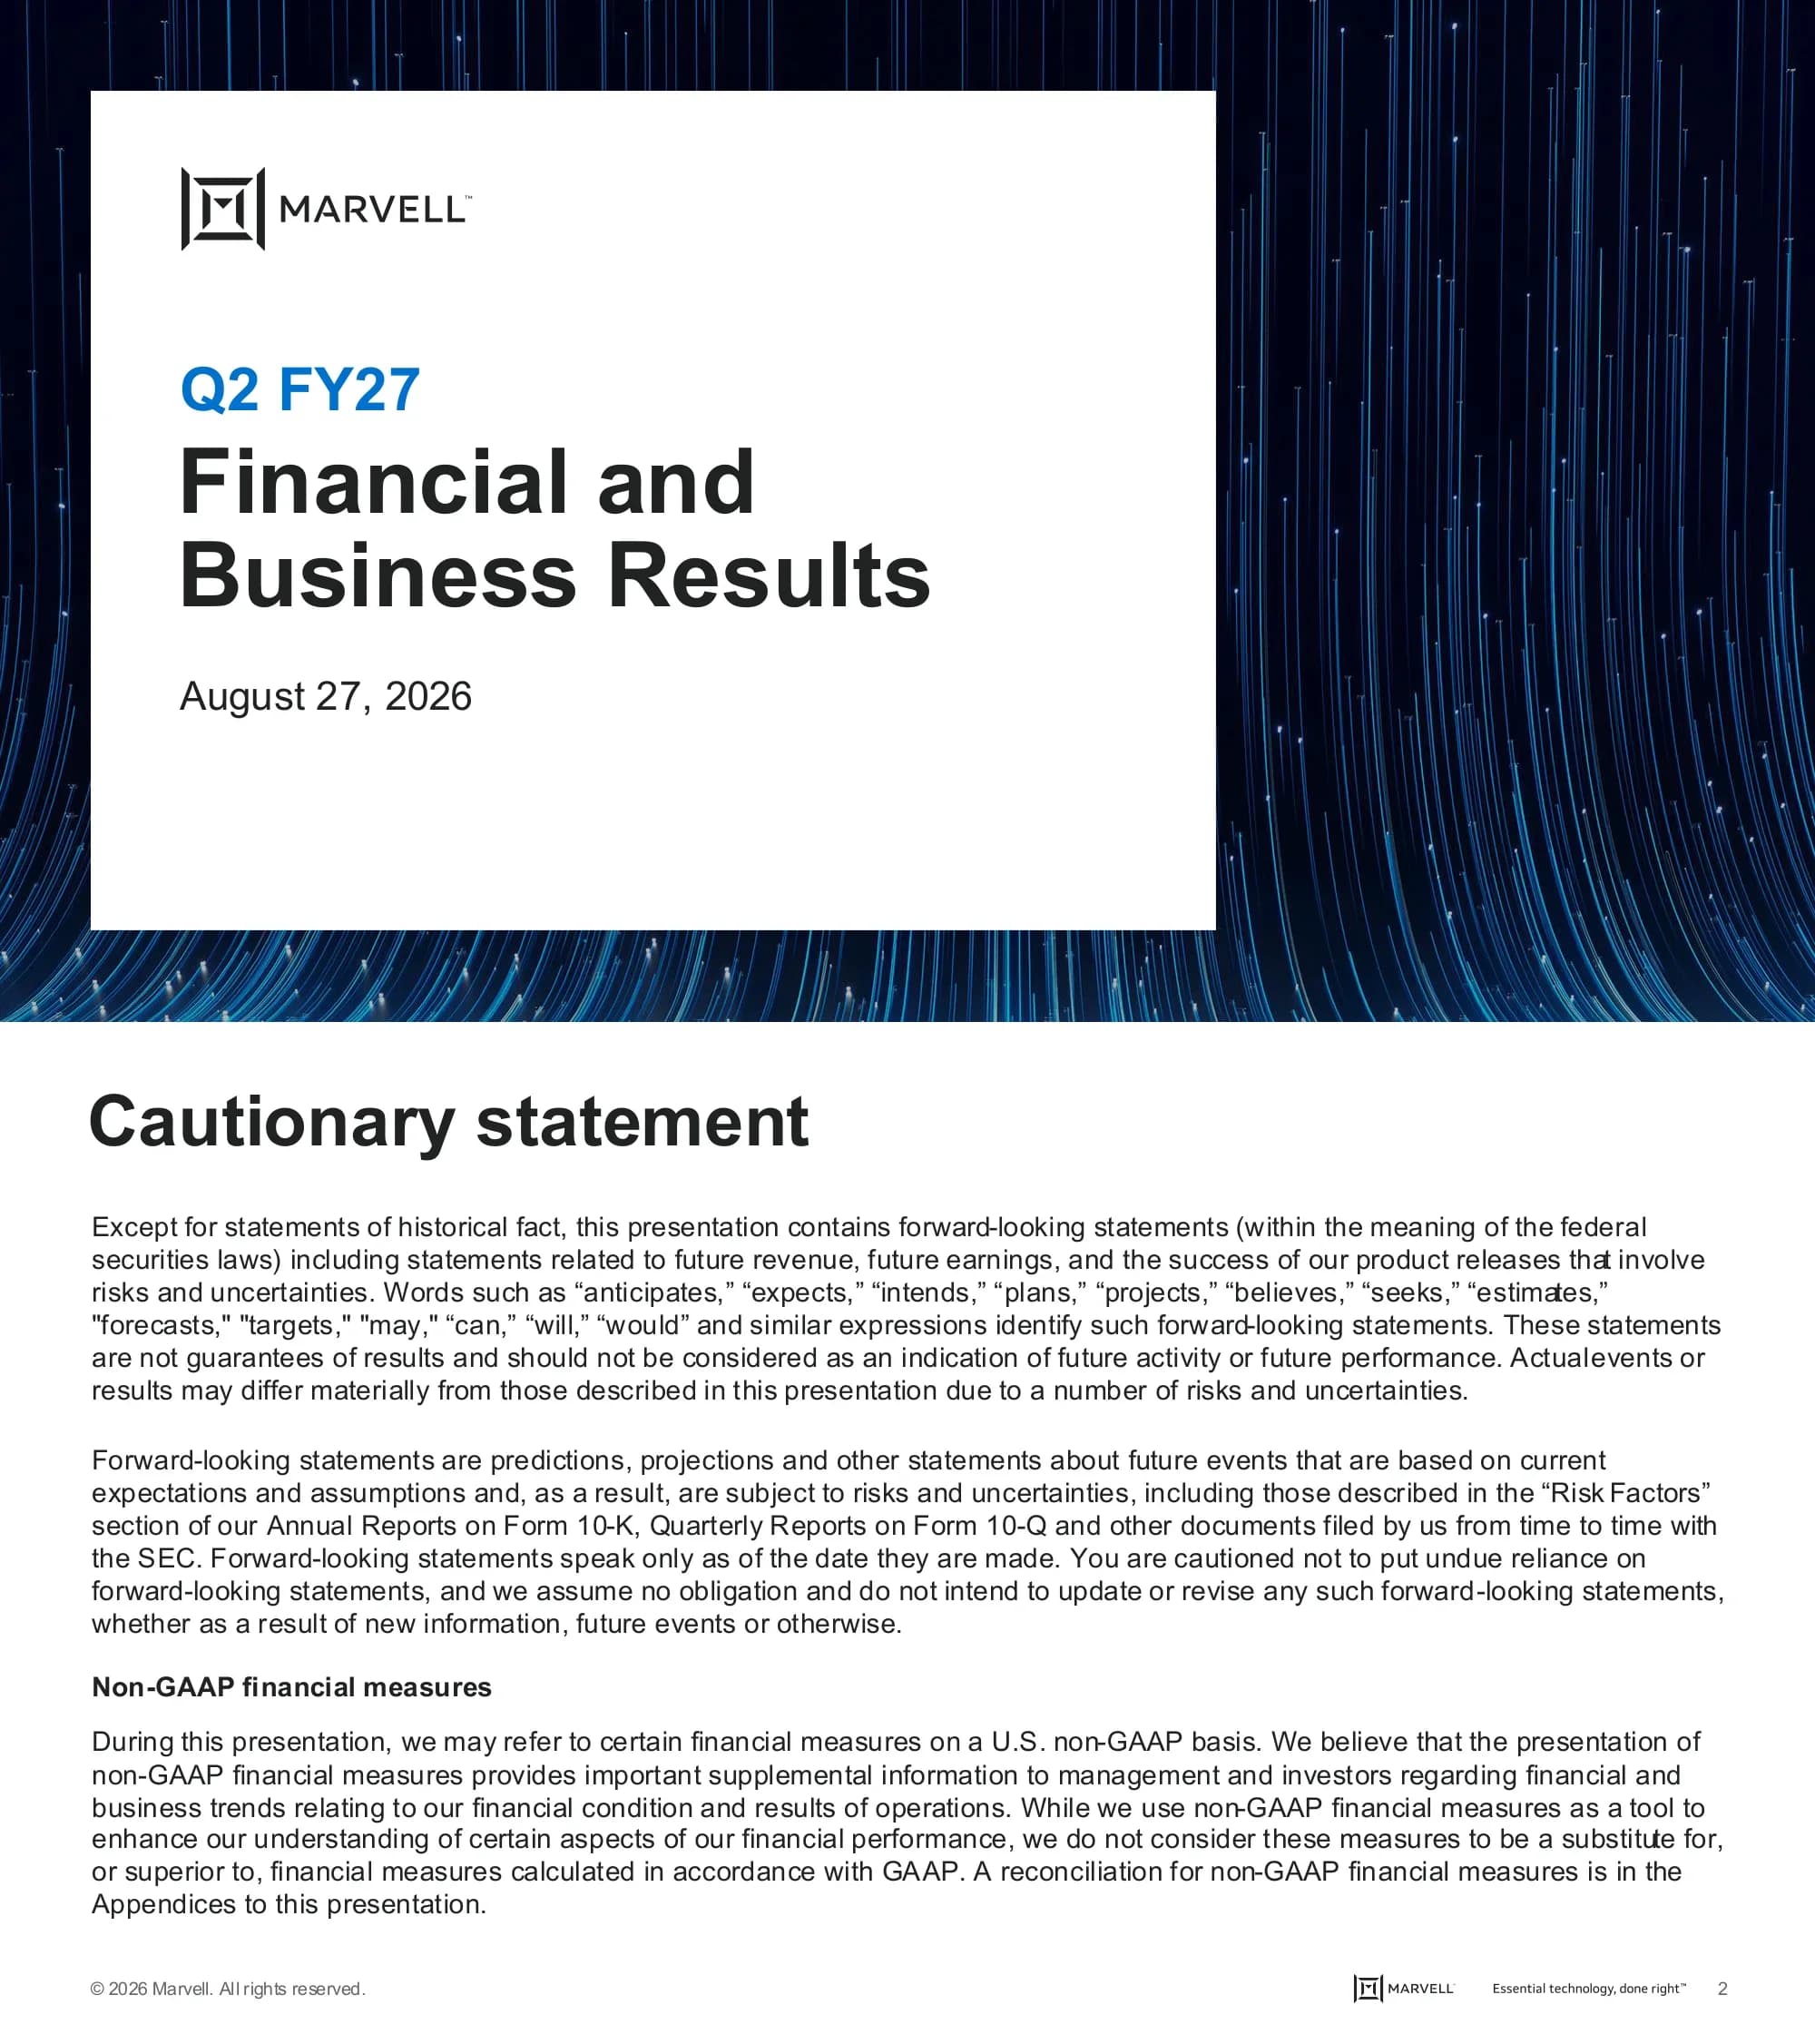
Cover slide for Marvell's second quarter fiscal 2027 financial and business results, dated August 27, 2026.
Full-bleed dark navy photographic background of blue light streaks falling like rain, with a large white rectangle inset at the left holding the Marvell wordmark, a blue 'Q2 FY27' eyebrow, a two-line black title and the date.
Forward-looking statements notice covering future revenue, future earnings and the success of product releases, with the usual identifying words and a pointer to the Risk Factors sections of the Forms 10-K and 10-Q. A second heading on non-GAAP financial measures explains that non-GAAP figures provide supplemental information but are not a substitute for GAAP, and that a reconciliation appears in the appendices.
Plain white slide, bold black heading, three paragraphs of body text in large readable type with a bold sub-heading between them. Marvell mark and tagline in the footer.
Explains that the fiscal year is the 52- or 53-week period ending on the Saturday closest to January 31, that every fifth or sixth fiscal year has 53 weeks with the extra week added to the fourth quarter, that fiscal 2024 had 53 weeks while fiscal 2025, 2026 and 2027 each have 52, and that the second quarter of fiscal 2027 is the three-month period ended August 1, 2026.
White slide with a bold heading and two short paragraphs occupying only the upper third — the sparsest text slide in the deck.
An advertisement for Marvell's Investor Day 2026 at The Pierre, A Taj Hotel in New York City, on Tuesday October 6 from 9am to 12pm, as a live in-person event with a live webcast.
A white panel at the left carrying the wordmark and event details, cut diagonally against a photograph of a New York street scene at dusk with the hotel and a yellow taxi in motion; a thin band of coloured light streaks runs along the bottom left edge.
Marvell sells data infrastructure silicon across two end markets. Data center — the majority of revenue and the primary growth driver — covers distributed DCs with connectivity up to 1,000km-plus, data center connectivity up to 500m-plus, rack connectivity from 2.5 to 7m, package connectivity at under 10mm, and custom silicon comprising XPU, network interfaces, scale-up fabrics, memory (CXL) and co-processors. Communications and other — enterprise, carrier, industrial and consumer — covers networking (Ethernet PHYs and switches), processors (wireless and networking processors), security (hardware security modules) and storage (storage controllers).
Two coloured header bars — bright blue for data center, grey for communications — over outlined cards with a line icon and a caption each; the custom silicon card is taller and holds four sub-items.
Four connectivity tiers laid out by distance. Scale across — distributed data centers, site to site, hundreds of kilometres: DCI modules, coherent DSPs, coherent-lite DSPs, TIAs, drivers and Ethernet switches. Scale out — data center, rack to rack, roughly 1km: PAM DSPs, coherent-lite DSPs, TIAs, drivers and Ethernet switches. Scale up — rack, XPU to XPU, metres: AEC DSPs, ACC linear equalizers, TIAs, drivers, PCIe and Ethernet retimers, Ethernet, ESUN, UALink, NVLink and PCIe switches, CXL expanders, accelerators and switches, and CPO. Scale in — package, chiplets and HBM, millimetres: D2D I/O and SerDes.
Four outlined boxes in a row, each with a small-caps tier label above, an icon and a scope caption inside, sitting over a horizontal arrow axis marked with the four distance scales and product lists beneath each column.
Custom XPU — the AI accelerator itself — plus custom XPU attach, described as the critical elements in the AI server: smart NICs for network interfaces, scale-up fabrics to connect XPUs to XPUs, memory (CXL) for expansion and acceleration, and co-processors for security and host management. Both rest on Marvell IP described as building blocks for XPU and XPU attach: die-to-die I/O, SerDes, dense SRAM, custom HBM, packaging, PIVR and photonics.
Two outlined blue panels joined by a plus sign — a single XPU icon at the left, a two-by-two grid of attach elements at the right — both connected by short stems to a wide grey foundation bar listing the IP building blocks.
Record Q2 FY27 financial performance: record revenue of $2,739 million, up 37% year over year and 13% sequentially; record data center revenue of $2,172 million, up 46% and 18%; communications and other revenue of $568 million, up 10% year over year and down 3% sequentially. AI expected to drive revenue acceleration through FY28: Q3 revenue forecast to grow 15% sequentially and more than 50% year over year at the guidance midpoint to $3.15 billion; FY27 data center revenue expected to grow roughly 60% year over year, up from a prior expectation of roughly 50%; FY27 revenue expected to grow roughly 45% to roughly $12 billion, up from a prior outlook of $11.5 billion; FY28 revenue expected to grow roughly 50% year over year to roughly $18 billion, approximately $1.5 billion higher than the prior outlook. Growing custom silicon franchise: an expanded commercial agreement with a Tier 1 hyperscaler for a broad range of custom silicon programs, including attach programs associated with the TPU ecosystem.
Three blue sub-headings with bulleted lists beneath, filling a white slide. No graphics.
Six metric cards: revenue $2,739 million, up 37% year over year and 13% sequentially; non-GAAP diluted EPS $0.94 with GAAP at $0.33; operating cash flow $606 million, up 31% year over year and down 5% sequentially; data center revenue $2,172 million, up 46% and 79% of total; non-GAAP gross margin 58.9% with GAAP at 53.1%; $254 million returned to shareholders, comprising $200 million of buybacks and $54 million of dividends.
Six outlined cards in a three-by-two grid, each with an oversized blue figure, a bold black label and a grey sub-line giving the growth rates or the GAAP counterpart.
Revenue of $2,006 million in Q2 FY26, $2,418 million in Q1 FY27 and $2,739 million in Q2 FY27, up 37% year over year and 13% sequentially. Results reflected strong demand in the data center end market.
A one-sentence commentary at the left and three bars at the right — two grey for the prior periods and one blue for the current quarter — with values above each and the growth line beneath the axis.
GAAP diluted EPS of $0.22, $0.04 and $0.33 across the three periods, with a footnote noting the Q1 FY27 figure reflects the impact of purchase accounting for the Celestial AI and XConn acquisitions. Non-GAAP diluted EPS of $0.67, $0.80 and $0.94 — up 40% year over year.
Two three-bar charts side by side under blue GAAP and Non-GAAP labels, each following the grey-grey-blue pattern, with a full-width grey rule beneath carrying the summary sentence.
GAAP gross margin of 50.4%, 52.1% and 53.1% across the three periods; non-GAAP gross margin of 59.4%, 58.9% and 58.9%, described as slightly above the midpoint of guidance.
The twin-chart layout repeated for margins, with the summary sentence in the same position beneath a full-width rule.
GAAP operating margin of 14.5%, 14.0% and 16.8%; non-GAAP operating margin of 34.8%, 35.0% and 36.6%, expanding 180 basis points year over year and 160 basis points sequentially, described as demonstrating significant operating leverage.
The twin-chart layout a third time, with a two-line summary sentence beneath the rule.
Operating cash flow of $461.6 million, $638.8 million and $605.5 million across the three periods. Capital return of $251.7 million, $253.8 million and $253.9 million, split between share repurchases and dividends. Cash flow of $606 million from operations reflects higher supplier capacity prepayments in support of future growth; $254 million was returned to shareholders including $200 million of share repurchases.
A plain three-bar chart at the left and a stacked three-bar chart at the right with a two-item legend for repurchases and dividends, both following the grey-grey-blue pattern, with a two-line summary beneath a full-width rule.
Revenue $2,006.1 million, $2,417.8 million and $2,739.3 million, up 37% year over year and 13% sequentially; gross margin 50.4%, 52.1% and 53.1%, up 270 and 100 basis points; operating expenses $720.5 million, $921.4 million and $995.9 million, up 38% and 8%; operating income $290.1 million, $339.4 million and $459.7 million, up 58% and 35%; operating margin 14.5%, 14.0% and 16.8%, up 230 and 280 basis points; net income $194.8 million, $34.5 million and $308.0 million, up 58% and 793%; earnings per share $0.22, $0.04 and $0.33, up 50% and 725%.
A six-column table with a solid blue header bar, the Q2'27 column tinted pale blue, hairline row separators and no fills elsewhere.
The same three periods on a non-GAAP basis: revenue unchanged; gross margin 59.4%, 58.9% and 58.9%, down 50 basis points year over year and flat sequentially; operating expenses $492.6 million, $576.9 million and $610.8 million, up 24% and 6%; operating income $698.8 million, $846.9 million and $1,003.2 million, up 44% and 18%; operating margin 34.8%, 35.0% and 36.6%, up 180 and 160 basis points; net income $585.5 million, $718.0 million and $865.9 million, up 48% and 21%; earnings per share $0.67, $0.80 and $0.94, up 40% and 18%.
The GAAP table repeated exactly on a non-GAAP basis, so the two can be compared line by line.
Cash and cash equivalents $1,224 million, $3,844 million and $3,933 million; accounts receivable net $1,452 million, $1,872 million and $2,218 million; inventories $1,052 million, $1,401 million and $1,361 million; total debt $4,467 million, $4,961 million and $4,963 million.
A compact four-row table with the same blue header and pale blue current column, occupying the upper third of the slide with the rest left empty.
Data center revenue of $1,491 million, $1,833 million and $2,172 million, up 46% year over year and 18% sequentially. Strategic highlights: strong demand for 800G optical DSPs for scale out with 1.6T ramping rapidly; scale-out switching on track to more than double in FY27, driven by a broadening array of 51.2T customers; an expanded commercial agreement with a Tier 1 hyperscaler for multiple custom products; Q3 revenue forecast to grow more than 20% sequentially and roughly 75% year over year; and custom business expected to grow more than 2x year over year in FY28.
A three-bar chart at the left with the growth line beneath, and a blue 'Strategic highlights' heading over five bullets at the right.
Communications and other revenue of $516 million, $585 million and $568 million, up 10% year over year and down 3% sequentially. Strategic highlights: Q3 revenue expected to decline in the low-to-mid teens sequentially and year over year on a percentage basis; solid sequential revenue recovery expected in Q4 with FY27 year-over-year growth approaching the 10% target; and future revenue expected to remain lumpy on a quarterly basis reflecting the mix of businesses.
The data center slide's layout repeated, here with the current-quarter bar lower than the prior quarter.
Data center revenue $1,490.5 million, $1,832.7 million and $2,171.5 million, up 46% and 18%; communications and other revenue $515.6 million, $585.1 million and $567.8 million, up 10% and down 3%. A footnote explains that beginning in the fourth quarter of fiscal 2026 the company consolidated revenue previously reported separately as enterprise networking, carrier infrastructure, consumer and automotive/industrial into a single communications and other end market, and that the composition of the data center end market is unchanged.
A two-row table with the standard blue header and pale blue current column, and a three-line segment-change footnote beneath.
Q3 FY27 guidance on a GAAP and non-GAAP basis: revenue $3,150 million plus or minus 5% on both; gross margin 52.9–53.9% GAAP against 57.5–58.5% non-GAAP; operating expenses approximately $1,015 million GAAP against approximately $655 million non-GAAP; diluted share count 921 million on both; diluted net income per share $0.53 plus or minus $0.05 GAAP against $1.10 plus or minus $0.05 non-GAAP.
A five-row table with two guidance columns under the blue header, each row giving the GAAP and non-GAAP figures side by side, with generous white space below.
Section divider introducing the reconciliations from GAAP to non-GAAP.
White slide with the section title and a sub-line at the left, and a large abstract pattern of blue and white parallelogram shapes filling the upper right corner.
Explains that non-GAAP measures exclude stock-based compensation, amortisation of acquired intangibles, acquisition and divestiture costs, restructuring and other charges, changes in the fair value of contingent consideration and forward stock purchase contracts, legal resolutions and certain discrete expenses; that a non-GAAP tax rate of 11.0% was applied for the second quarter of fiscal 2027; the four internal uses of non-GAAP measures; their limitations; and that Marvell does not provide a reconciliation of forward-looking non-GAAP measures for periods after Q3 FY27 because the items involved cannot be estimated without unreasonable effort.
Six paragraphs and a four-item bullet list filling the whole white slide in small type.
GAAP gross profit $1,010.6 million, $1,260.8 million and $1,455.6 million; special items comprising stock-based compensation of $13.4, $14.2 and $15.9 million, amortisation of acquired intangible assets of $167.4, $150.8 and $142.7 million, restructuring related charges (gains) of nil, $(2.0) and $(0.2) million, and no other cost of goods sold; total special items $180.8, $163.0 and $158.4 million; non-GAAP gross profit $1,191.4, $1,423.8 and $1,614.0 million.
An 'Appendices' page title with a blue sub-heading, then a three-column table with the blue header bar and the Q2'27 column tinted pale blue, adjustment rows indented beneath the GAAP line.
GAAP gross margin 50.4%, 52.1% and 53.1%; stock-based compensation 0.7%, 0.6% and 0.6%; amortisation of acquired intangible assets 8.3%, 6.3% and 5.2%; restructuring related charges (gains) nil, (0.1)% and nil; other cost of goods sold nil throughout; non-GAAP gross margin 59.4%, 58.9% and 58.9%.
The same reconciliation table expressed in percentage points rather than dollars.
GAAP operating expenses $720.5 million, $921.4 million and $995.9 million; special items comprising stock-based compensation of $(140.2), $(193.4) and $(310.3) million, amortisation of acquired intangibles of $(76.3), $(74.4) and $(72.2) million, restructuring related (charges) gains of $(8.7), $(10.7) and $2.8 million, and other of $(2.7), $(66.0) and $(5.4) million; total special items $(227.9), $(344.5) and $(385.1) million; non-GAAP operating expenses $492.6, $576.9 and $610.8 million.
The same reconciliation table with negative adjustments shown in parentheses and two lettered footnotes at the foot.
GAAP operating income $290.1 million, $339.4 million and $459.7 million; special items comprising stock-based compensation of $153.6, $207.6 and $326.2 million, amortisation of acquired intangibles of $243.7, $225.2 and $214.9 million, restructuring related charges (gains) of $8.7, $8.7 and $(3.0) million, no other cost of goods sold, and other of $2.7, $66.0 and $5.4 million; total special items $408.7, $507.5 and $543.5 million; non-GAAP operating income $698.8, $846.9 and $1,003.2 million.
The same reconciliation table with positive add-backs and the same two lettered footnotes.
GAAP operating margin 14.5%, 14.0% and 16.8%; stock-based compensation 7.7%, 8.6% and 11.9%; amortisation of acquired intangible assets 12.1%, 9.3% and 7.8%; restructuring related charges (gains) 0.4%, 0.4% and (0.1)%; other cost of goods sold nil; other 0.1%, 2.7% and 0.2%; non-GAAP operating margin 34.8%, 35.0% and 36.6%.
The percentage-point version of the operating income reconciliation, same table grammar.
GAAP interest and other loss net of $(56.4) million, $(256.1) million and $(81.4) million; special items comprising the change in fair value of contingent consideration liability net of forward stock purchase contract of nil, $250.7 and $52.0 million, and other of $8.2, $(34.7) and $(0.9) million; total special items $8.2, $216.0 and $51.1 million; non-GAAP interest and other loss net of $(48.2), $(40.1) and $(30.3) million.
A shorter reconciliation table with a two-line row label for the contingent consideration item and a single lettered footnote.
GAAP net income $194.8 million, $34.5 million and $308.0 million; special items comprising stock-based compensation of $153.6, $207.6 and $326.2 million, amortisation of acquired intangibles of $243.7, $225.2 and $214.9 million, restructuring related charges (gains) of $8.7, $8.7 and $(3.0) million, no other cost of goods sold, the change in fair value of contingent consideration net of forward stock purchase contract of nil, $250.7 and $52.0 million, and other of $10.9, $31.3 and $4.5 million; pre-tax total special items $416.9, $723.5 and $594.6 million; other income tax effects and adjustments of $(26.2), $(40.0) and $(36.7) million; non-GAAP net income $585.5, $718.0 and $865.9 million.
The longest reconciliation table in the appendix, with a pre-tax subtotal line before the tax adjustment row.
Three lettered footnotes to the preceding table: restructuring and other related items include gain on sale of property, changes in contractual obligations, employee severance costs and facility exit related charges; other costs include acquisition and divestiture related costs, gain or loss on investments, gain on sale of intellectual property and legal contingency matters; and other income tax effects relate to a tax provision based on a non-GAAP income tax rate of 11.0% for the three and six months ended August 1, 2026 and the three months ended May 2, 2026, against 10.0% for the three and six months ended August 2, 2025.
A footnotes-only page — three lettered paragraphs in the upper third of an otherwise empty white slide.
GAAP weighted-average shares outstanding basic 862.6, 882.0 and 897.4 million; GAAP weighted-average shares outstanding diluted 870.4, 893.3 and 921.2 million; non-GAAP weighted-average shares outstanding diluted the same 870.4, 893.3 and 921.2 million. GAAP diluted net income per share $0.22, $0.04 and $0.33; non-GAAP diluted net income per share $0.67, $0.80 and $0.94.
A share-count block and a per-share block separated by a blank row, in the same three-column table format.
Q3 FY27: GAAP net revenue $3,150 million plus or minus 5%, no special items, non-GAAP net revenue the same. GAAP gross margin 52.9–53.9%; special items of approximately 0.8% stock-based compensation and approximately 3.9% amortisation of acquired intangible assets; non-GAAP gross margin 57.5–58.5%.
A single-column forward reconciliation with the whole Q3'27 column tinted pale blue, split into a revenue block and a gross margin block by a blank row.
Q3 FY27 total GAAP operating expenses of approximately $1,015 million; special items of $285 million stock-based compensation, $72 million amortisation of acquired intangible assets, $1 million restructuring related charges and $2 million other; total non-GAAP operating expenses of approximately $655 million.
The same single-column forward reconciliation, shorter, with four adjustment rows.
Q3 FY27 GAAP diluted net income per share of $0.53 plus or minus $0.05; special items of $0.34 stock-based compensation, $0.21 amortisation of acquired intangible assets, $(0.03) other income tax effects and adjustments, and $0.05 other; non-GAAP diluted net income per share of $1.10 plus or minus $0.05.
The third single-column forward reconciliation, in per-share terms, with the same structure.
Closing slide carrying only the Marvell logo and wordmark.
Plain white slide with the Marvell mark and wordmark centred, nothing else.
Perguntas comuns sobre este slide e o conteúdo da apresentação subjacente.
The full 36-slide Marvell Q2 FY27 results deck as both PDF and editable PowerPoint, plus a page-by-page preview. The PPTX keeps charts and tables as editable objects so the layouts can be reused with your own figures.
Yes. The PDF is the file Marvell published on its investor relations site for the second quarter of fiscal 2027, dated August 27, 2026. The PowerPoint was converted from that PDF for editing convenience — check any layout you plan to reuse, since conversion is not always pixel-perfect.
Record revenue of $2,739 million, up 37% year over year and 13% sequentially, of which data center was a record $2,172 million — up 46% and 79% of the total. Non-GAAP diluted EPS was $0.94, up 40%, with non-GAAP operating margin at 36.6%, up 180 basis points. GAAP EPS was $0.33. Operating cash flow was $606 million and $254 million was returned to shareholders.
Both multi-year numbers went up. FY27 revenue is now expected to grow roughly 45% to roughly $12 billion, against a prior outlook of $11.5 billion, with data center growth raised from roughly 50% to roughly 60%. FY28 revenue is expected to grow roughly 50% to roughly $18 billion, about $1.5 billion above the prior outlook. Q3 FY27 guidance is $3.15 billion at the midpoint, up 15% sequentially and more than 50% year over year.
A footnote on slide 11 explains it: the $0.04 figure reflects the impact of purchase accounting for the Celestial AI and XConn acquisitions. The non-GAAP figure for the same quarter was $0.80, and the reconciliation on slide 30 shows a $250.7 million change in the fair value of contingent consideration as the largest single item.
Three slides answer this before any numbers appear. It sells data infrastructure silicon across four connectivity tiers by distance — scale across between sites at hundreds of kilometres, scale out rack to rack at about a kilometre, scale up XPU to XPU at metres, and scale in within the package at millimetres — plus custom XPUs and the attach silicon around them: smart NICs, scale-up fabrics, CXL memory and co-processors.
It is the cleanest template here for a company that reports on both GAAP and non-GAAP bases. Every metric slide carries the two charts side by side with identical axes; every chart uses the same grey-grey-blue three-period pattern; and the appendix gives each measure its own reconciliation page rather than crowding them into one table.
One rule, applied everywhere: the current quarter is blue and everything before it is grey. No legends, no bold rows, no callout boxes — the eye finds the newest number on every chart and in every table, because the pale blue column does the same job in the tables that the blue bar does in the charts.
Original PDF published by Marvell alongside the Q2 FY27 earnings release on August 27, 2026.

Create Your Own Slides
Turn your ideas into professional presentations in seconds with 2slides AI.
Referencie designs profissionais, escolha seu estilo e gere slides com renderização de texto perfeita. Alimentado por Nano Banana—comece a criar sua apresentação agora.
Your AI Agent for slides. Save time, shine faster with intelligent presentation creation.




© 2026 2slides. All rights reserved.