
Faz parte de Exemplos de apresentações para investidores
Lite-On Technology (LITEON, 光寶科, TWSE: 2301) Q3 2026 earnings presentation, the English deck filed on Taiwan's Market Observation Post System (MOPS) for the investor conference (法說會) held on October 30, 2026. It reports record third-quarter results: sales of NT$57,403 million (New Taiwan dollars, NT$57.4 billion), up 28% YoY and 9% QoQ; gross margin of 25.9%; operating profit of NT$8,655 million, up 85% YoY at a 15.1% margin; and record net profit to parent of NT$7,429 million with EPS of NT$3.27, up 60% YoY. The Cloud & AIoT segment grew 57% to NT$33,753 million and now makes up 59% of sales, driven by AI server power, battery backup units and energy storage. The deck also covers 9M26 results (sales NT$153.5 billion, EPS NT$8.08), the balance sheet as of September 30, 2026, ROIC, a 2022-to-9M26 margin-expansion story, a NT$36 billion sustainability-linked syndicated loan, and a 4Q26 outlook in which AI revenue is expected to exceed 30% of 2026 sales.
Usa a capa desta apresentação como referência de estilo para slides criados a partir do seu próprio conteúdo. Ou escolha qualquer página abaixo para usar o layout dela como referência.
Navegação Rápida
Tags
Compartilhar os slides
Lite-On Technology (LITEON, 光寶科, TWSE: 2301) Q3 2026 earnings presentation, the English deck filed on Taiwan's Market Observation Post System (MOPS) for the investor conference (法說會) held on October 30, 2026. It reports record third-quarter results: sales of NT$57,403 million (New Taiwan dollars, NT$57.4 billion), up 28% YoY and 9% QoQ; gross margin of 25.9%; operating profit of NT$8,655 million, up 85% YoY at a 15.1% margin; and record net profit to parent of NT$7,429 million with EPS of NT$3.27, up 60% YoY. The Cloud & AIoT segment grew 57% to NT$33,753 million and now makes up 59% of sales, driven by AI server power, battery backup units and energy storage. The deck also covers 9M26 results (sales NT$153.5 billion, EPS NT$8.08), the balance sheet as of September 30, 2026, ROIC, a 2022-to-9M26 margin-expansion story, a NT$36 billion sustainability-linked syndicated loan, and a 4Q26 outlook in which AI revenue is expected to exceed 30% of 2026 sales.
Visualização detalhada de cada página de slide, incluindo layout, conteúdo principal e elementos visuais.
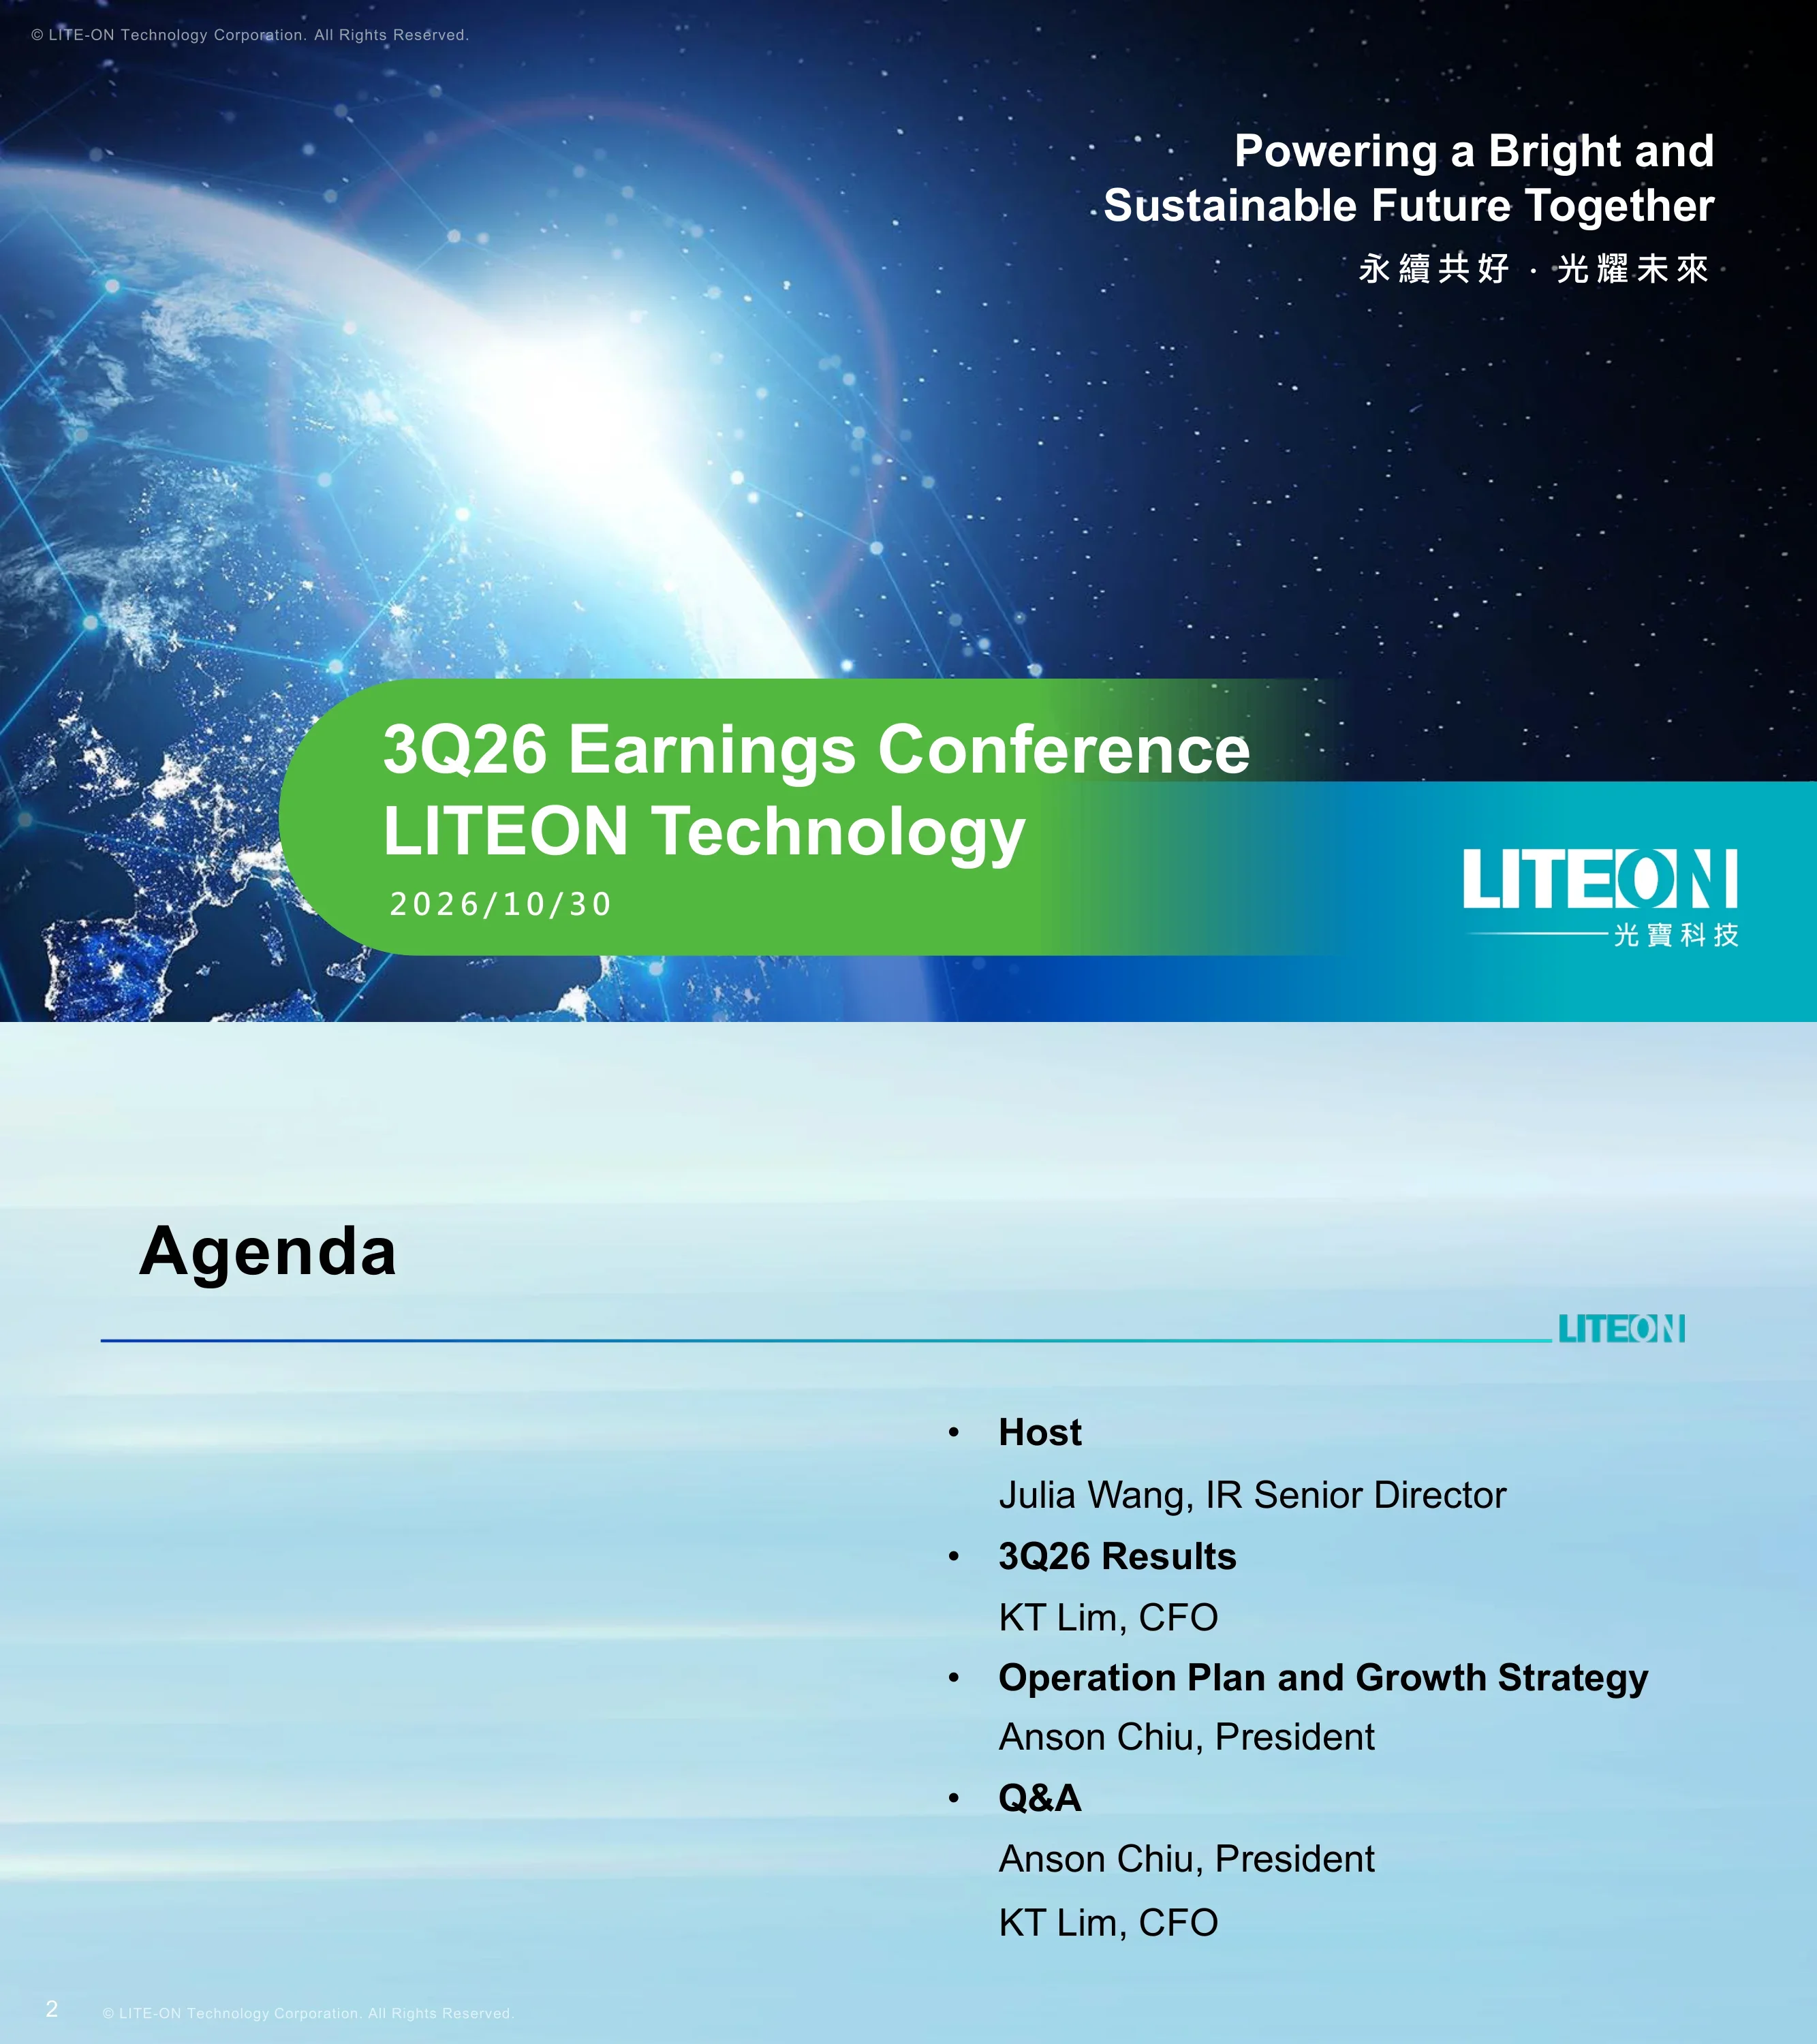
Cover slide for the 3Q26 earnings conference dated 2026/10/30, with the tagline 'Powering a Bright and Sustainable Future Together' and its Chinese version (永續共好・光耀未來).
Full-bleed image of Earth from space with a light flare; tagline at upper right; a rounded green-to-teal band across the lower half holds the title and date; LITEON logo with 光寶科技 at lower right.
Agenda with speakers: host Julia Wang (IR Senior Director); 3Q26 Results by KT Lim (CFO); Operation Plan and Growth Strategy by Anson Chiu (President); Q&A with Anson Chiu and KT Lim.
Large 'Agenda' title with a blue-to-teal rule and small logo; four bulleted sections with speaker names on the right half over a soft light-blue streaked background.
Forward-looking-statement disclaimer listing risks such as end-market demand, supply-chain disruption, geopolitics, raw material and energy costs and FX; notes the figures are prepared under IFRS (本資料係依據國際財務報導準則 IFRS 編制). Below, three ovals introduce the business groups: Opto-electronics (opto-semiconductors, automotive electronics, intelligent transportation, lighting), Cloud & AIoT (datacenter, server, networking, AIoT, smart devices, video intelligence) and Information Technology & Consumer Electronics (workstations, PC/gaming adaptors, LEO satellite power, edge computing/robotics power).
Title with gradient rule; three paragraphs of disclaimer text in the top half; a row of three colored ovals (yellow, teal, navy) with descriptive captions beneath; blue gradient footer with page number.
Section divider opening the financial results portion of the presentation.
Left three-quarters is a photo of a riverside city skyline with mountains (Taipei Neihu area) with the white section title; right quarter is a blue-teal gradient panel with the LITEON logo and a four-point star accent.
Four bar charts in NT$ million comparing Q3 2025, Q2 2026 and Q3 2026. Sales: 44,891 / 52,703 / 57,403 (+28% YoY). Gross profit: 11,243 / 14,348 / 14,867 (+32% YoY), gross margin 25.0% / 27.2% / 25.9%, with a callout that 1H26 margin was 24.7%. Operating profit: 4,683 / 8,203 / 8,655 (+85% YoY), operating margin 10.4% / 15.6% / 15.1%, versus 12.8% in 1H26. Net profit to parent: 4,645 / 7,116 / 7,429 (+60% YoY), EPS NT$2.05 / 3.14 / 3.27, labelled 'Record High'.
Dashboard: teal title bar with numbered tabs 1–4 and a QoQ/YoY toggle (YoY selected); 2×2 grid of rounded panels, each with a bar chart, a YoY percentage box, and margin or EPS values in labels with dots; gold callout boxes for highlights.
Year-to-date comparison of 9M25 vs 9M26 in NT$ million. Sales 121,728 → 153,514 (+26%). Gross profit 28,406 → 38,618 (+36%), gross margin 23.3% → 25.2%. Operating profit 12,085 → 20,957 (+73%), operating margin 9.9% → 13.7%. Net profit to parent 11,256 → 18,321 (+63%), EPS NT$4.94 → 8.08, marked 'Record High'.
Same dashboard template as page 5 with two bars per panel (2025 vs 2026), YoY boxes at top right of each panel and a gold 'Record High' callout on net profit.
Stacked revenue bars for Q3 2025 vs Q3 2026 (NT$ million): Cloud/AIoT 21,456 (48%) → 33,753 (59%); Opto-electronics 6,977 (16%) → 8,138 (14%); IT/CE 16,457 (36%) → 15,512 (27%). Net sales YoY +28%. Total operating profit 4,683 → 8,655, OP YoY +85%. (The slide title spells 'Segements'.)
Left panel: two stacked bars color-coded teal/orange/navy with value and share labels and an NSB YoY box. Right panel: segment tab selector (Cloud/AIoT, Opto-electronics, IT/CE), QoQ/YoY toggle, OP YoY box and an operating-profit bar chart.
Cloud/AIoT revenue rose from NT$21,456 million (48% of sales) in Q3 2025 to NT$33,753 million (59%) in Q3 2026, up 57% YoY. Segment operating profit grew from NT$3,329 million to NT$7,113 million, up 114% YoY.
Same segment template with the Cloud/AIoT tab highlighted; left panel two teal revenue bars with NSB YoY 57%; right panel operating-profit bars with OP YoY 114%.
Opto-electronics revenue rose from NT$6,977 million (16% of sales) to NT$8,138 million (14%), up 17% YoY. Segment operating profit grew from NT$606 million to NT$724 million, up 19% YoY.
Same segment template with the Opto-electronics tab highlighted; orange revenue bars on the left, blue operating-profit bars on the right with YoY boxes.
Information Technology & Consumer Electronics revenue declined from NT$16,457 million (36% of sales) to NT$15,512 million (27%), down 6% YoY. Segment operating profit eased from NT$1,685 million to NT$1,635 million, down 3% YoY.
Same segment template with the IT/CE tab highlighted; navy revenue bars on the left and operating-profit bars on the right, with negative YoY boxes.
Condensed balance sheet in NT$ million with QoQ comparisons: total assets 264,741 (vs 239,164, +11%) = liabilities 166,460 (vs 142,552, +17%) + equity 98,281 (vs 96,612, +2%). Current assets 203,065 (+7%), accounts receivable 52,484 (+4%), inventory 66,090 (+20%); current liabilities 159,339 (+16%), short-term loans 41,885 (+33%), accounts payable 74,739 (+11%). Financial indicators for Q3'25 / Q2'26 / Q3'26: quick ratio 1.14 / 0.94 / 0.82; current ratio 1.44 / 1.39 / 1.27; cash conversion cycle 47 / 64 / 73 days; AR days 82 / 81 / 83; inventory days 59 / 90 / 108. Note: capital is being deployed for growth via strategic procurement, strategic investments and capex.
Teal header with QoQ toggle; top row shows Assets = Liabilities + Equity as three large-number cards with '=' and '+' signs; below, two columns of smaller cards for asset and liability line items; right side has a blue-header 'Financial Indicator' table and a bold note.
Revenue (NT$ million) by year: 2021 164,828; 2022 173,456; 2023 148,333 (excludes image department business); 2024 137,134 (some consumer and OEM products discontinued); 2025 166,085; 9M26 153,514 (+26% YoY). Gross margin rose from 18.5% (2021) to 19.2%, 22.0%, 21.6%, 22.9% and 25.2% (9M26); operating margin from 7.9% to 8.7%, 9.8%, 9.4%, 10.1% and 13.7% (9M26, +73% YoY operating profit). Product-mix donuts: 9M26 revenue NT$154B with Cloud & AIoT 56% (NT$86B), Opto-electronics 15%, IT/CE 29%; 9M22 revenue NT$130B with Cloud & AIoT 33% (NT$43B), Opto-electronics 20%, IT/CE 47%.
Left two-thirds: combo chart with grey revenue columns and two line series (GP% and OP%) on a secondary axis, with teal and grey YoY callout tags and footnotes. Right third: two donut charts (9M26 above 9M22) with green callout boxes for Cloud & AIoT revenue and a shared legend.
Return on invested capital of 49% in 2024, 48% in 2025 and 34% for 9M26 (annualized), against a six-year average of 43%. Commentary attributes ROIC to a rising mix of high-growth, high-value AI-infrastructure products and says working-capital management, efficiency gains and disciplined capital deployment will continue to drive capital efficiency. Footnote defines ROIC as operating profit after tax divided by average (net working capital + net PP&E + right-of-use assets + intangible assets).
Left: green-bordered panel with three green bars, a dashed six-year-average line, and a dashed outline above the 9M26 bar marked '*Annualized'. Right: white card with a navy drop shadow holding two bullets with blue emphasized phrases. Footnote below.
3Q26: sales NT$57.4 billion, +28% YoY and +9% QoQ, with Cloud & AIoT up nearly 60%; gross profit NT$14.9 billion (+32%), gross margin 25.9% (+0.9 ppt); operating profit NT$8.7 billion (+85%), operating margin 15.1% (+4.7 ppt), credited to AI data center demand, high-value business, scale from global capacity expansion and smart manufacturing; net profit NT$7.4 billion and EPS NT$3.27 (+60%), a quarterly record. 9M26: sales NT$153.5 billion (+26%), gross profit +36%, gross margin 25.2% (+1.9 ppt), operating profit +73%, operating margin 13.7% (+3.8 ppt), net profit NT$18.3 billion, EPS NT$8.08 (+64%), a record. Core businesses: cloud-related business up 80% on AI server power management and energy storage shipments; high-end opto-semiconductor applications expanding into cloud computing, industrial automation and renewable energy; LEO satellite power supplies doubled YoY. Financing: first NT$36 billion sustainability-linked syndicated loan secured to fund global AI expansion and strategic investments.
Text-heavy slide with a navy title and gradient rule; four bracketed section headers (【3Q26】, 【9M26】, 【Core businesses】, 【Sustainability-Linked Loan to Accelerate AI Expansion】) each followed by blue-bulleted sentences; gradient footer.
Section divider introducing the President's operation plan and growth strategy section.
Reuses the skyline-and-river photo divider from page 4 with the new white title text and the blue-teal logo panel on the right.
Growth strategy: expand Grid-to-Rack AI infrastructure capabilities through strategic investments and M&A in power, thermal, system-level racks and high-speed optical communication, having showcased an 800VDC Power Rack, 2.6MW CDU and DC/DC Power Brick at OCP; spin off Advanced Mechanical Infrastructure to accelerate the liquid-cooling business; strategic investment in Yinchuan Xinanrui Electric for high-power transformer and inductor technology for AI data center power. 4Q26 outlook: core businesses expected to grow both YoY and QoQ, and AI revenue is expected to exceed 30% of 2026 revenue, helped by mass production of 8.5kW PSU and BBU for ASIC platforms and the next-generation VR 110kW and Helios 42-inch power shelves, sample shipments of the 800VDC Power Rack in 4Q26, and LEO satellite power solutions more than doubling yearly.
Two stacked white cards, each anchored by a large white numeral (1, 2) in a navy square on the left and a navy bracket accent on the right; blue subheadings with bullet lists; bold emphasis on the AI revenue target.
Product roadmap moving from in-rack components to full power racks across 1H26, 2H26 and 2027 onward: 33kW power shelf with 5.5kW PSU; 8.5kW PSU & BBU; VR 110kW power shelf with 18.3kW PSU; Helios 42-inch power shelf; 800VDC >1.5MW power rack; 800VDC 880kW power rack; and a 2.5kW DC/DC brick (50 VDC input, 12 VDC output). Marked 'Confidential 機密'.
Timeline chart with an x-axis (1H26, 2H26, 2027~) and a rising teal swoosh; dark rounded product cards with yellow or green text are placed along the curve next to 3D product renders; an 'In-rack → Power Rack' arrow runs across the top.
Closing slide repeating the corporate tagline with the LITEON logo; marked 'Confidential 機密'.
Earth-from-space image on the left three-quarters with the logo on a horizontal light line and the tagline at lower right; blue gradient panel on the right with a star accent and a large white logo.
Perguntas comuns sobre este slide e o conteúdo da apresentação subjacente.
For 3Q26, Lite-On reported sales of NT$57.4 billion (New Taiwan dollars), up 28% YoY and 9% QoQ. Gross margin was 25.9%, operating profit was NT$8.7 billion (up 85% YoY, 15.1% margin), and net profit to parent was a record NT$7.4 billion, or EPS of NT$3.27, up 60% YoY.
This is the English presentation Lite-On (光寶科, TWSE: 2301) filed on Taiwan's Market Observation Post System (MOPS) for its 3Q26 investor conference (法說會) on October 30, 2026. Taiwanese issuers usually file a Chinese version on MOPS as well, and many of this deck's chart labels are already bilingual.
Cloud & AIoT. Its Q3 revenue rose 57% YoY to NT$33,753 million, now 59% of sales, and its operating profit more than doubled (+114%) to NT$7,113 million. Opto-electronics grew 17%, while IT/CE revenue fell 6%.
The company expects its core businesses to grow both year over year and quarter over quarter, and AI revenue to exceed 30% of full-year 2026 revenue. Drivers include mass production of 8.5kW PSU and BBU units, VR 110kW and Helios 42-inch power shelves, sample shipments of an 800VDC power rack and LEO satellite power supplies more than doubling.
Gross margin rose from 18.5% in 2021 to 25.2% in 9M26, and operating margin from 7.9% to 13.7%. Over the same period, Cloud & AIoT grew from 33% of nine-month revenue (NT$43B) in 9M22 to 56% (NT$86B) in 9M26.
Yes. The page offers the original PDF and an editable PPTX converted from it. The PPTX is a machine conversion, so check chart and text placement before you reuse the layouts.
Useful layouts include the 2×2 quarterly results dashboard with YoY boxes, the repeated segment-results slide with a tab selector, the balance sheet drawn as Assets = Liabilities + Equity cards, the revenue-plus-margin combo chart with product-mix donuts, and the product roadmap timeline.
Original English investor conference (法說會) file for Lite-On Technology (2301), October 30, 2026

Create Your Own Slides
Turn your ideas into professional presentations in seconds with 2slides AI.
Referencie designs profissionais, escolha seu estilo e gere slides com renderização de texto perfeita. Alimentado por Nano Banana—comece a criar sua apresentação agora.
Seu Agente IA para slides. Economize tempo, brilhe mais rápido com criação inteligente de apresentações.


© 2026 2slides. Todos os direitos reservados.