
KLA's Q4 fiscal 2026 earnings presentation (quarter ended June 30, 2026, reported July 28, 2026) — an 18-slide deck covering revenue of $3.66 billion up 15% year over year, a 62.4% non-GAAP gross margin and 43.7% operating margin, net income of $1.39 billion and non-GAAP diluted EPS of $1.05 after a 10-for-1 stock split, revenue broken down by reportable segment, product line and region, an investment-grade balance sheet with $5.95 billion of bonds at a weighted average maturity of 18.1 years, free cash flow of $817 million and a seventeenth consecutive annual dividend increase, September quarter guidance of $4.0 billion, the KLA 2030 target model, and a five-page reconciliation appendix.
Navegação Rápida
Tags
Compartilhar os slides
KLA's Q4 fiscal 2026 earnings presentation (quarter ended June 30, 2026, reported July 28, 2026) — an 18-slide deck covering revenue of $3.66 billion up 15% year over year, a 62.4% non-GAAP gross margin and 43.7% operating margin, net income of $1.39 billion and non-GAAP diluted EPS of $1.05 after a 10-for-1 stock split, revenue broken down by reportable segment, product line and region, an investment-grade balance sheet with $5.95 billion of bonds at a weighted average maturity of 18.1 years, free cash flow of $817 million and a seventeenth consecutive annual dividend increase, September quarter guidance of $4.0 billion, the KLA 2030 target model, and a five-page reconciliation appendix.
Visualização detalhada de cada página de slide, incluindo layout, conteúdo principal e elementos visuais.
Cover slide for KLA's fourth quarter fiscal 2026 earnings, for the quarter ended June 30, 2026 and reported July 28, 2026.
Full-bleed rendering of a chip package on a circuit board in saturated teal, magenta and yellow, with spectral data spikes rising from it. The KLA logo and 'Keep Looking Ahead' tagline sit centred at the top in white; the title and date line are centred at the bottom.
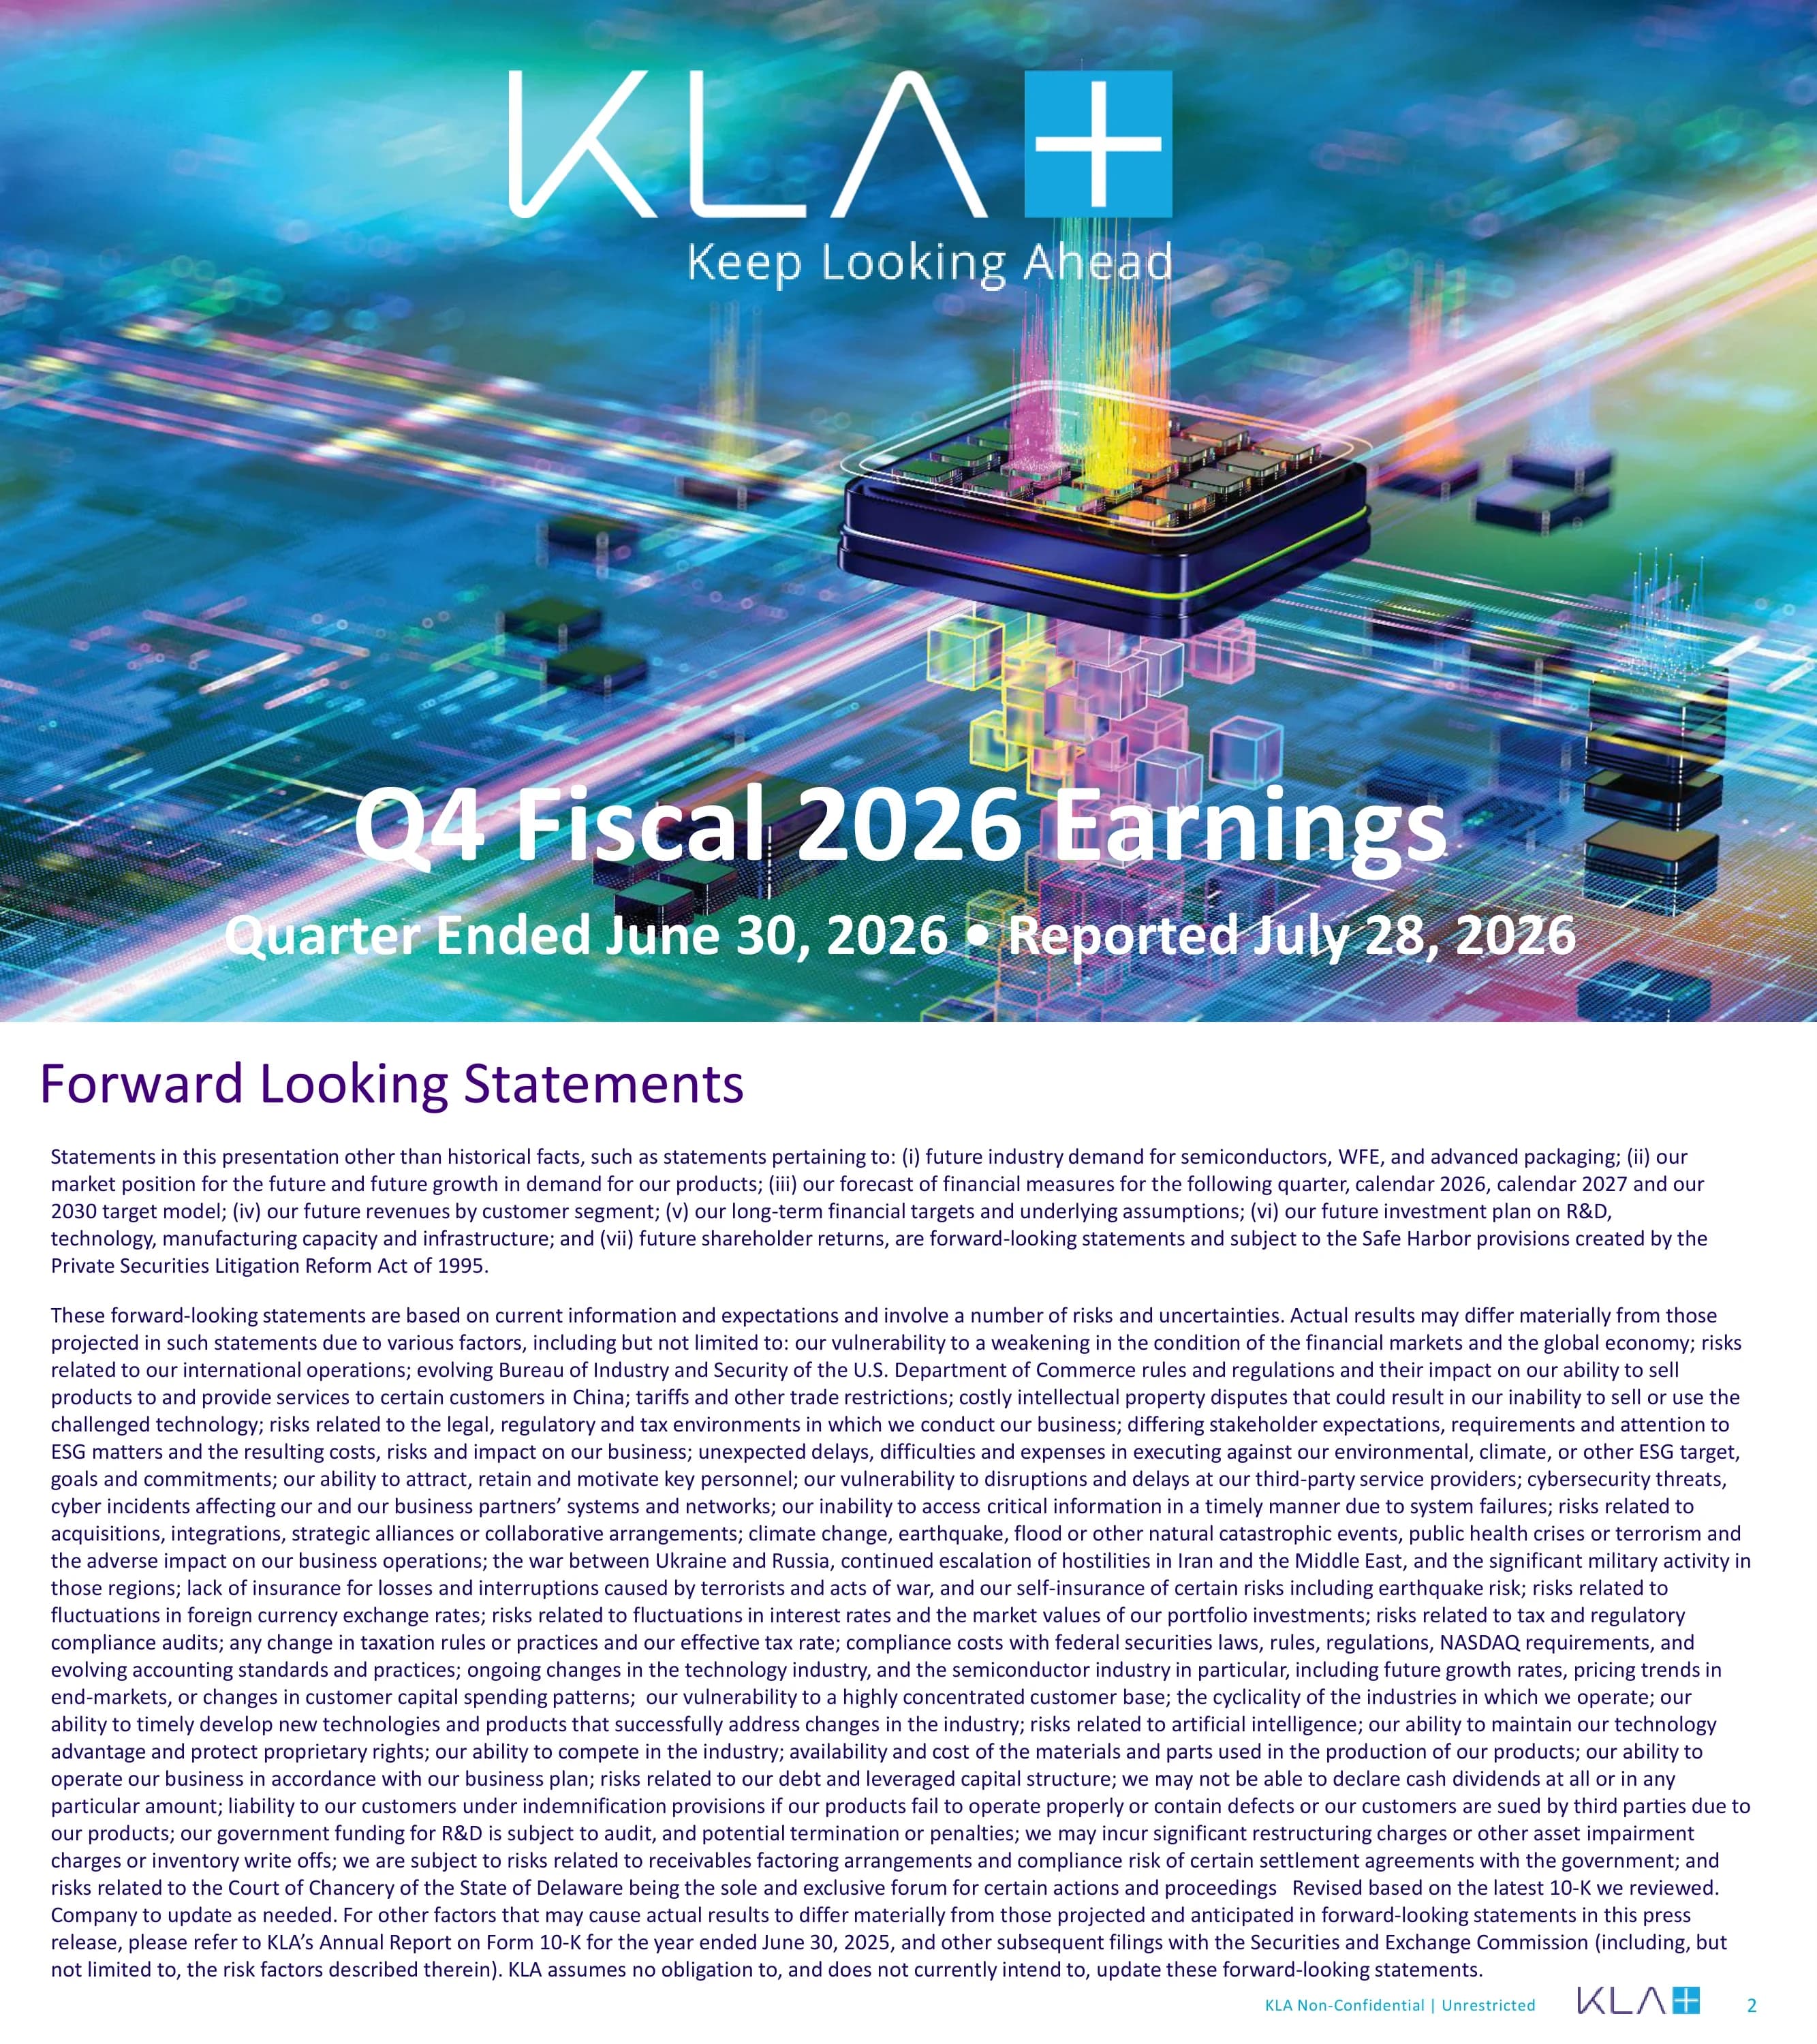
Safe-harbour notice covering seven categories of forward-looking statement — future industry demand for semiconductors, WFE and advanced packaging; market position and product demand growth; forecasts for the following quarter, calendar 2026, calendar 2027 and the 2030 target model; future revenues by customer segment; long-term financial targets and assumptions; the investment plan for R&D, technology, manufacturing capacity and infrastructure; and future shareholder returns — followed by an extensive list of risk factors.
White slide with a purple heading and two dense justified paragraphs filling the page in small type. KLA logo and page number in the footer beside a 'KLA Non-Confidential | Unrestricted' marking.
Three operating principles. Consistent Strategy and Execution — application of common processes and discipline, cascading throughout the organisation, with a strong focus on talent development. Management By Metrics — a culture of performance and accountability, an expectation of continuous improvement, and superior margins driven by market leadership and differentiation. Financial Discipline and Rigor — exert efficiency and operating discipline in investments, a strong track record of high returns, and a focus on enhancing shareholder value. A banner across the foot reads 'Focused on driving sustainable profitability and growth'.
A concentric ring diagram at the left — outer ring for values, inner ring for differentiators, KLA logo at the centre — with a large chevron pointing right into three tick-marked headings and their bullets. A solid purple banner runs across the bottom.
Revenue $3.66 billion, gross margin 62.4%, operating margin 43.7%, net income $1.39 billion, non-GAAP diluted EPS $1.05 and GAAP diluted EPS $1.04. Footnotes mark the margin, net income and EPS figures as non-GAAP with reconciliation in the appendix, and note that on June 11, 2026 after market close KLA effected a 10-for-1 stock split, with all current and prior-period per-share amounts retroactively adjusted.
Six pale blue tiles — four across the top and two stacked at the right — each with an oversized cyan figure above a label. A product photograph of the Kronos patterned wafer inspection system occupies the centre, with a caption describing it at the left.
Semiconductor Process Control (systems plus services) $3,257 million, up 13% year over year and 6% sequentially, 89% of revenue; Specialty Semiconductor Process $160 million, up 13% and down 3%, 4%; PCB and Component Inspection $241 million, up 56% and 44%, 7%; total $3,658 million, up 15% and 7%. Q4 FY26 semiconductor process control end market system revenue: foundry and logic 79%, memory 21%, with a footnote noting this represents approximate system-only sales and does not represent the aggregate customer base.
A four-row table whose row labels sit inside coloured chevron tabs — purple, cyan, green and orange — with revenue, growth and a small donut ring rendering the revenue share in each row. A larger donut with an embedded product photograph occupies the right third.
Wafer inspection $1,781 million, up 1% year over year and 2% sequentially, 49% of revenue; patterning $728 million, up 61% and 18%, 20%; specialty semi process $137 million, up 11% and down 5%, 4%; PCB and component inspection $168 million, up 96% and 76%, 4%; services $820 million, up 17% and 6%, 22%; other $24 million, down 39% and 48%, 1%; total $3,658 million, up 15% and 7%. Revenue by region: Taiwan 31%, China 26%, North America 18%, Korea 10%, Japan 6%, Europe 5% and rest of Asia 4%.
The chevron-tab table repeated with seven rows in seven colours, and a donut chart at the right with a globe illustration at its centre and a two-column legend beneath.
Balance sheet summary as of June 30, 2026: total cash $4,902 million, working capital $8,077 million, total assets $17,952 million, debt $5,887 million and total shareholders' equity $6,350 million. Bond maturity profile: $5.95 billion of bonds outstanding at a 4.67% weighted average interest rate and an 18.1 year weighted average maturity. Investment grade credit ratings: Moody's A2, S&P A- and Fitch A. The maturity chart shows $4,902 million of liquidity plus a $1,500 million undrawn revolver, then bond maturities of $800 million in CY29, a $1,500 million revolver marker in CY30, $1,000 million in CY32, $500 million and $250 million in CY34, $400 million in CY49, $750 million in CY50, $1,200 million and $250 million in CY52 and $800 million in CY62.
Three purple-headed tables across the top third — balance sheet summary, bond maturity profile and credit ratings — over a full-width bar chart with a green liquidity column, dashed-outline undrawn revolver markers and blue bond bars positioned along a calendar-year axis.
Free cash flow of $1.8 billion in CY20 rising to $4.4 billion in CY25 with $3.8 billion on a last-twelve-months basis, a roughly 20% CAGR, with free cash flow margin of 29%, 31%, 28%, 33%, 31%, 34% and 28% across the periods. A banner reads 'Committed to long-term >90% FCF returned to shareholders through dividends and share repurchases'. Footnotes define free cash flow as cash flow from operating activities minus capital expenditures and FCF margin as FCF divided by revenue.
A four-quadrant value creation circle at the left in four purple tints, and a combination chart at the right with cyan bars for free cash flow, a dark line for margin and a magenta CAGR arrow rising across it. A purple banner runs across the foot.
Share repurchases over five years on a cash settlement date basis: $1,403 million in CY21, $4,483 million in CY22 including $3 billion of accelerated share repurchases, $1,760 million in CY23, $2,059 million in CY24, $2,025 million in CY25 and $2,290 million LTM, with a remaining share repurchase authorisation of $2,748 million plus a $7,000 million authorisation announced March 12, 2026. Average price per share since 2021 was approximately $47 on a split-adjusted basis. Dividend history from $0.05 per share in CY06 rising through every year to $0.92 on a next-twelve-months basis, a roughly 16% CAGR, with the seventeenth consecutive annual increase announced March 12, 2026, up 21% to $0.23 per share from $0.19.
Two charts side by side — cyan repurchase bars at the left with a green stacked authorisation column, and twenty-one purple dividend bars at the right with a magenta annotation and arrow marking the latest increase.
June quarter free cash flow $817 million, free cash flow margin 22% and free cash flow conversion 59%. June quarter share buyback $571 million with $2.29 billion LTM; June quarter dividends paid $305 million with $1.06 billion LTM. A caption describes the KLA 3935, part of the 39xx Gen5 series, a super resolution broadband plasma patterned wafer defect inspection system for leading-edge logic and foundry manufacturing supporting wafer-level defect discovery, yield learning and inline monitoring, with hotspot discovery, process debug, EUV print check and line monitoring.
Three pale blue tiles down the left and four down the right, each with an oversized cyan figure over a two-line label, with a product photograph and its caption filling the centre column.
September 2026 quarter guidance: revenue $4.0 billion plus or minus $200 million; non-GAAP gross margin 62.5% plus or minus 1%; GAAP diluted EPS $1.14 plus or minus $0.10; non-GAAP diluted EPS $1.16 plus or minus $0.10. Macro assumptions for semiconductor process control revenue by end market: foundry/logic approximately 73% and memory approximately 27%, of which DRAM approximately 90% and NAND approximately 10%. Model assumptions: non-GAAP operating expenses approximately $690 million, other income and expense net approximately $25 million, effective tax rate approximately 14.5% and diluted share count approximately 1.312 billion. A banner reads 'Strong, resilient and delivering shareholder value'.
A four-row guidance table at the left with row labels in a purple-to-blue gradient column, and two assumption blocks at the right under purple headings. A purple banner runs across the foot.
Originally published at the March 12, 2026 Investor Day. 2026 target model against 2030 target model and an ongoing financial framework: revenue $14 billion plus or minus $500 million, $26 billion plus or minus $2.5 billion, and a roughly 13–17% CAGR; gross margin approximately 63% and approximately 63.5% plus or minus 50 basis points; R&D approximately 13% and 11%; SG&A approximately 8% and 7%; operating margin 41–43%, 45–47% and 40–50% incremental; diluted EPS $3.80 plus or minus $0.15, $8.40 plus or minus $0.80, and roughly 1.3x the revenue growth rate; capital allocation targeting more than 85% of free cash flow, more than 90%, and a hybrid dividend plus repurchase approach. Macro assumptions include a CY25–CY30 semiconductor industry CAGR of roughly 11% and wafer equipment growing about one point faster than semis to $215 billion plus or minus $20 billion. Business assumptions include KLA's share of wafer equipment growing more than 150 basis points and services growing 13–15%.
A seven-row three-column table with a purple-to-blue gradient row-label column at the left, and two assumption blocks at the right. A purple banner runs across the foot.
Section divider introducing the reconciliation appendix.
The cover's chip render reused full-bleed, with 'Appendix' in bold white at the upper left over a lighter sub-line, and the KLA logo at the upper right.
For the three months ended June 30, 2026. GAAP net income $1,363.1 million, adjusted by acquisition-related charges of $33.1 million, an income tax effect of $(17.2) million and discrete tax items of $6.8 million, giving non-GAAP net income of $1,385.7 million; GAAP diluted EPS $1.04 against non-GAAP $1.05 on 1,315.0 million shares. GAAP income tax expense $186.3 million reconciling to non-GAAP $196.7 million; GAAP income before income taxes $1,549.4 million to non-GAAP $1,582.5 million; GAAP income tax rate 12.0% against non-GAAP 12.4%; GAAP other expense net $4.6 million to non-GAAP $16.2 million. On the right: GAAP gross margin 61.4% plus 1.0% of acquisition-related charges giving non-GAAP 62.4%; GAAP and non-GAAP R&D expenses both $399.0 million; GAAP SG&A $291.5 million less $8.5 million giving non-GAAP $283.0 million; GAAP operating expense $690.5 million to non-GAAP $682.0 million; GAAP operating income $1,553.9 million plus $44.7 million giving non-GAAP $1,598.6 million; GAAP operating margin 42.5% against non-GAAP 43.7%. A footnote explains that non-GAAP operating income and expenses include the effects of the Executive Deferred Savings Plan, with $44.1 million of expense and $44.0 million of gain recorded in SG&A for the quarter.
Two boxed reconciliation tables side by side on a white slide, each with underlined section labels, lettered adjustment markers and bold totals.
Free cash flow measures for the three months ended June 30, 2026 and for eight twelve-month periods. Three months: net cash provided by operating activities $906.4 million less capital expenditures of $89.3 million gives free cash flow of $817.1 million against revenue of $3,657.6 million, a 22.3% margin. Twelve months ended June 30, 2026: operating cash flow $4,143.1 million less $375.9 million gives $3,767.1 million against revenue of $13,579.5 million, a 27.7% margin; earlier twelve-month periods run from $1,767.8 million at a 29.1% margin in 2020 to $4,382.3 million at 34.4% in 2025. Free cash flow conversion of 59.0% against non-GAAP net income of $1,385.7 million, with a GAAP comparable metric of 66.5%. Capital returns: cash paid for dividends $305.3 million in the quarter and $1,057.8 million for twelve months; cash paid for share repurchases $571.0 million and $2,289.8 million; total capital returns $876.3 million and $3,347.6 million.
One wide boxed table with nine period columns across the top block and narrower blocks beneath for conversion and capital returns, followed by a definitions paragraph.
Q4 FY2026 guidance range: GAAP diluted net income per share $1.04 low and $1.24 high, plus $0.03 of acquisition-related charges and $(0.01) of income tax effect, giving non-GAAP $1.06 and $1.26 on 1,312 million shares; GAAP gross margin 60.6% and 62.6% plus 0.9% giving non-GAAP 61.5% and 63.5%; GAAP operating expenses $692 million and $704 million less $8 million giving non-GAAP $684 million and $696 million; GAAP and non-GAAP other expense net $25 million; GAAP tax rate 13.9% plus 0.6% giving non-GAAP 14.5%. CY 2026 guidance: GAAP other expense net $45 million plus $12 million giving non-GAAP $57 million; GAAP tax rate 13.5% plus 0.7% giving non-GAAP 14.2%; GAAP operating expenses $2,782 million to $2,787 million less $35 million giving non-GAAP $2,747 million to $2,752 million. A note on long-term forecasts explains that the 2026 target model reflects targets originally established in 2022 and is provided for historical context only, and that reconciliations for the 2030 forecast are not presented because the reconciling items cannot be predicted without unreasonable effort.
Two boxed tables — a tall quarterly guidance reconciliation at the left and a shorter calendar-year one at the upper right — with two long explanatory notes filling the lower right.
Explains why KLA provides non-GAAP information, that there are no standardised definitions for most non-GAAP metrics so they may be defined very differently between companies, and that the presentation is not meant to be considered in isolation or as a substitute for GAAP results. Three lettered descriptions follow: acquisition-related charges primarily comprise amortisation of intangible assets, which management notes will recur until fully amortised and which contributed to revenues in the periods presented; the income tax effect of non-GAAP adjustments; and discrete tax items, excluded to help investors compare operating performance across periods and companies.
Two columns of body text on a white slide — an explanation block at the left and three lettered descriptions at the right — beneath the standard purple heading.
Closing slide carrying the KLA logo and tagline over the cover imagery.
The cover's chip render full-bleed with the KLA logo and 'Keep Looking Ahead' tagline centred. Nothing else.
Perguntas comuns sobre este slide e o conteúdo da apresentação subjacente.
The full 18-slide KLA Q4 FY26 earnings deck as both PDF and editable PowerPoint, plus a page-by-page preview. The PPTX keeps the chevron tables and donut cells editable so the layouts can be reused.
Yes. The PDF is the file KLA published on its investor relations site for the quarter ended June 30, 2026, reported July 28, 2026. The PowerPoint was converted from that PDF for editing convenience — check any layout you plan to reuse, since conversion is not always pixel-perfect.
Revenue of $3.66 billion, up 15% year over year and 7% sequentially, with a 62.4% non-GAAP gross margin, a 43.7% non-GAAP operating margin, net income of $1.39 billion and non-GAAP diluted EPS of $1.05 against GAAP EPS of $1.04. Free cash flow was $817 million at a 22% margin and 59% conversion.
KLA effected a 10-for-1 stock split on June 11, 2026 after market close. All current and prior-period EPS and per-share amounts in the deck — including the twenty-year dividend history and the 2030 target model — have been retroactively adjusted to reflect the split.
By segment: semiconductor process control $3,257 million, 89% of the total; PCB and component inspection $241 million, 7%; specialty semiconductor process $160 million, 4%. By product: wafer inspection 49%, services 22%, patterning 20%. By region: Taiwan 31%, China 26%, North America 18%, Korea 10%, Japan 6%, Europe 5% and rest of Asia 4%. Within process control systems, foundry and logic was 79% and memory 21%.
KLA commits to returning more than 90% of free cash flow over the long term through dividends and repurchases. In the June quarter that meant $571 million of buybacks and $305 million of dividends; over twelve months, $2.29 billion and $1.06 billion. The March 2026 dividend increase was the seventeenth consecutive annual rise, up 21% to $0.23 per share, against a roughly 16% CAGR since 2006.
Revenue of $26 billion plus or minus $2.5 billion, a roughly 63.5% gross margin, R&D at about 11% and SG&A at about 7% of sales, a 45–47% operating margin, diluted EPS of $8.40 plus or minus $0.80, and capital allocation targeting more than 90% of free cash flow. It assumes a roughly 11% semiconductor industry CAGR from CY25 to CY30 with wafer equipment reaching $215 billion.
Two devices carry the dense slides. Each table row is labelled by a coloured chevron tab, so segments and product lines are identifiable by colour before you read the words. And revenue share is drawn as a small donut ring inside the table cell rather than as a separate chart, which keeps a seven-row breakdown to one slide without a legend.
Original PDF published by KLA alongside the Q4 FY26 earnings release on July 28, 2026.

Create Your Own Slides
Turn your ideas into professional presentations in seconds with 2slides AI.
Referencie designs profissionais, escolha seu estilo e gere slides com renderização de texto perfeita. Alimentado por Nano Banana—comece a criar sua apresentação agora.
Your AI Agent for slides. Save time, shine faster with intelligent presentation creation.




© 2026 2slides. All rights reserved.