
Faz parte de Exemplos de apresentações para investidores
Iron Mountain (NYSE: IRM) Q3 2026 Earnings Presentation, dated November 5, 2026 and filed with the U.S. Securities and Exchange Commission (SEC) as an exhibit to a Form 8-K on 2026-11-05. The 24-slide deck from the storage, information management and data center REIT covers record Q3 2026 results (total revenue US$1,991 million, +13%; Adjusted EBITDA US$748 million, +13%; AFFO US$458 million, +17%; AFFO per share US$1.53, +16%), raised full-year 2026 guidance (revenue US$7,950-8,020 million, AFFO per share US$5.94-6.00), a 15% dividend increase effective January 2027, segment deep dives on Global RIM, Data Center and Asset Lifecycle Management (ALM), and Q3 and full-year non-GAAP reconciliations.
Usa a capa desta apresentação como referência de estilo para slides criados a partir do seu próprio conteúdo. Ou escolha qualquer página abaixo para usar o layout dela como referência.
Navegação Rápida
Tags
Compartilhar os slides
Iron Mountain (NYSE: IRM) Q3 2026 Earnings Presentation, dated November 5, 2026 and filed with the U.S. Securities and Exchange Commission (SEC) as an exhibit to a Form 8-K on 2026-11-05. The 24-slide deck from the storage, information management and data center REIT covers record Q3 2026 results (total revenue US$1,991 million, +13%; Adjusted EBITDA US$748 million, +13%; AFFO US$458 million, +17%; AFFO per share US$1.53, +16%), raised full-year 2026 guidance (revenue US$7,950-8,020 million, AFFO per share US$5.94-6.00), a 15% dividend increase effective January 2027, segment deep dives on Global RIM, Data Center and Asset Lifecycle Management (ALM), and Q3 and full-year non-GAAP reconciliations.
Visualização detalhada de cada página de slide, incluindo layout, conteúdo principal e elementos visuais.
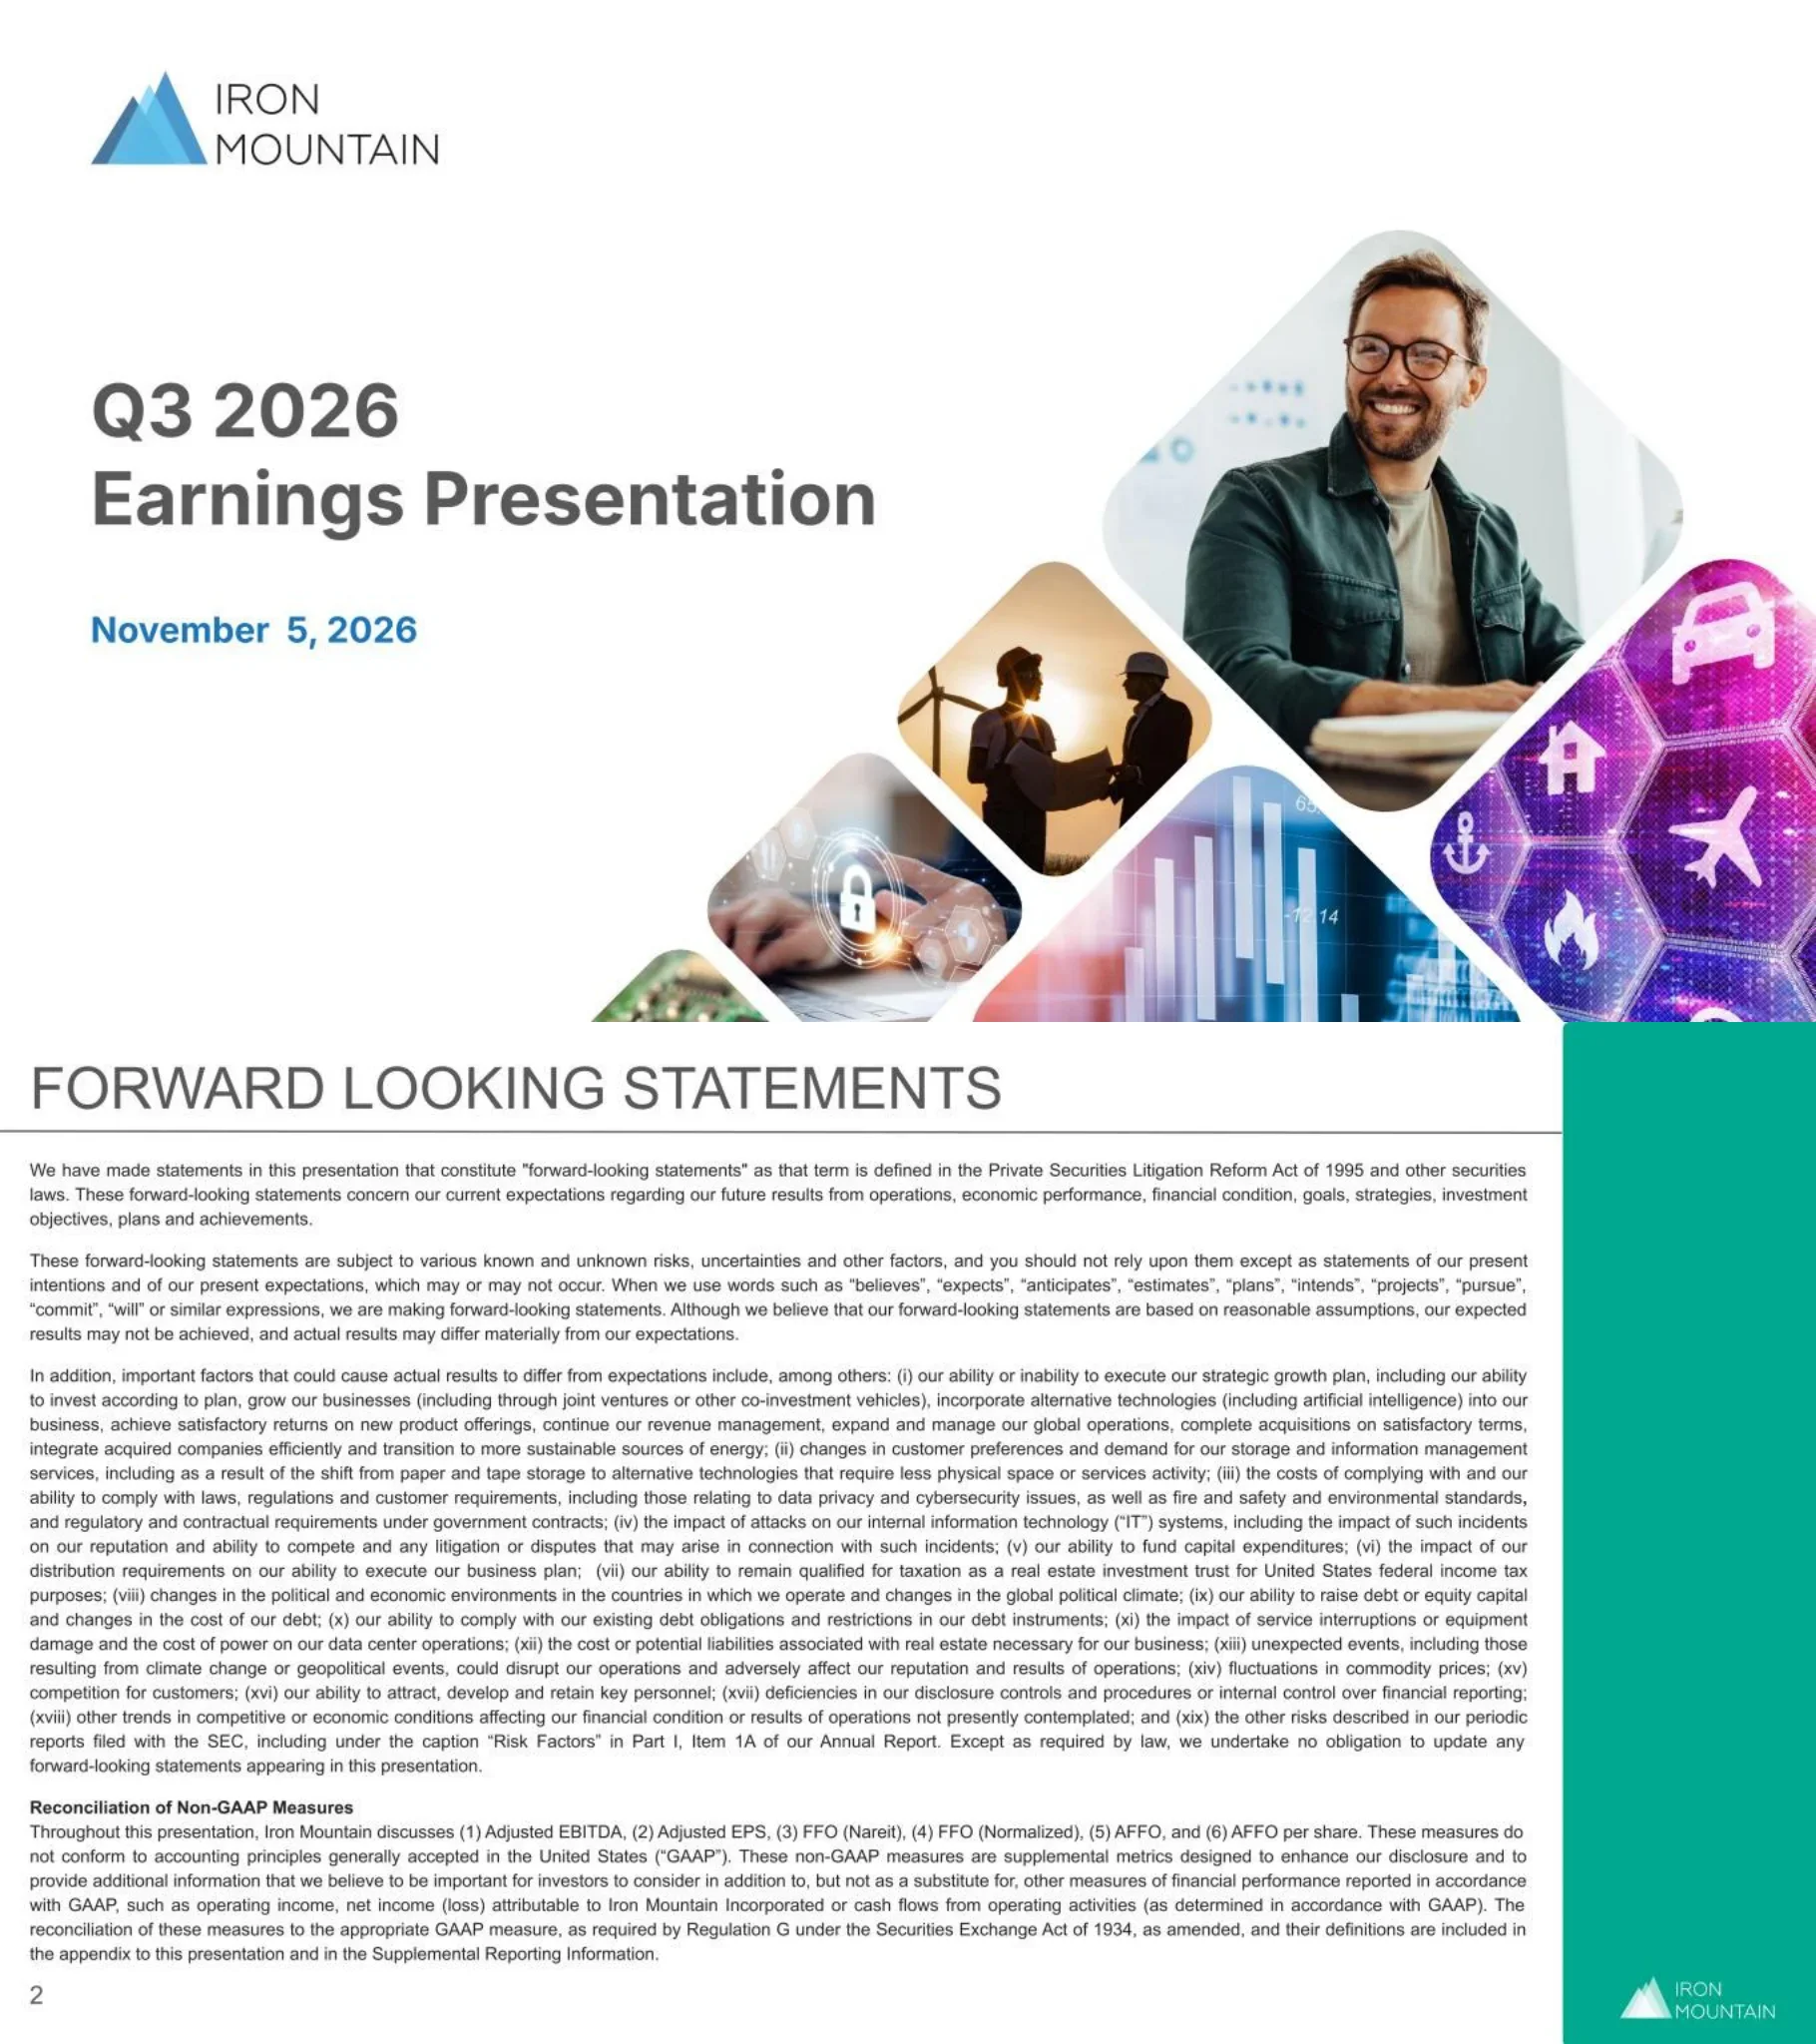
Cover slide with the Iron Mountain logo, the title Q3 2026 Earnings Presentation and the date November 5, 2026.
Left-aligned title block on white with a cluster of diamond-shaped photo tiles cascading from the right edge
Safe-harbor language under the Private Securities Litigation Reform Act of 1995 listing nineteen risk factors, plus a note that Adjusted EBITDA, Adjusted EPS, FFO (Nareit), FFO (Normalized), AFFO and AFFO per share are non-GAAP measures reconciled in the appendix.
Full-width dense justified text with a teal vertical band on the right holding the logo
Section divider introducing the company overview part of the deck.
Solid blue background with an angled photo cut-out at the lower left and a centered-right white heading
Key facts: about US$51B enterprise value, US$170B total addressable market, about US$8B 2026E revenue, about US$3B 2026E Adjusted EBITDA, 12% five-year revenue CAGR, 13% Adjusted EBITDA CAGR, 59% AFFO payout ratio, 11% dividend growth CAGR, 240,000+ customers, 95% of the Fortune 1000, 61 countries and about 1,300 facilities; plus leadership positions in Records Management, Data Center (about 1.4 GW developable, 545 MW operating), ALM (US$35B market) and Digital Solutions with award callouts.
Blue banner headline; left column of Financial and Operational KPI tiles; right 2x2 grid of business quadrants with bullets and award lines; footnotes at bottom
Four bar charts from 2021 to 2026E: revenue US$4,492M to US$7,985M (12% CAGR, 13% ex-FX), Adjusted EBITDA US$1,635M to US$2,963M (13% CAGR, 14% ex-FX), AFFO US$1,043M to US$1,790M (11% CAGR, 12% ex-FX) and AFFO per share US$3.58 to US$5.97 (11% CAGR, 12% ex-FX).
One summary bullet across the top, then four equal-width column charts under navy header bars with diagonal CAGR arrows
Stacked bars split revenue into Growth Businesses (Data Center, ALM, Digital Solutions) and All Other for 2024 (US$6,150M), 2025 (US$6,902M) and 2026E (US$7,985M); growth-business penetration rises from 24% to 28% to 34%, growth businesses grow 36%, 34% and 37%, and contribute 7, 8 and 11 points of total growth of 12%, 12% and 16%.
Blue banner and one bullet; stacked column chart on the left with a dotted penetration row; growth table and shaded contribution table on the right
Three businesses (Records Management and Digital Solutions, Data Center, Asset Lifecycle Management) tied together by a synergistic business model: decades-long trusted relationships, security and chain of custody, cross-selling, end-to-end solutions for 240,000+ customers and global scale.
Three full-height photo panels with navy label boxes, overlaid by a wide rounded navy panel listing five icon bullets
Quarter highlights by business: ALM cross-sell win as sole IT asset disposition partner in North America for a global consulting firm; Data Center leased 137 MW year to date including 51 MW in Mumbai, 25 MW in London and 23 MW in Chennai; Digital momentum with the AI-powered Insight DXP platform and a Middle East government contract; Records Management won a US$25 million multi-year federal government contract.
Navy background with a 2x2 grid of light cards, each with an orange top border, uppercase blue label and icon
Global RIM revenue grew 7% reported and organic in Q3 2026. Storage (about 60% of US$5.3B 2025 revenue) highlights 37 consecutive years of organic revenue growth, record volume and about 15-year average box duration; Service (about 30%) and Digital Solutions (about 10%, a fast-growing business of about US$600M on a trailing twelve month basis).
Three intro bullets; three columns with a cyan Storage header on the left, a donut chart in the center and a navy Service header plus dotted Digital Solutions box on the right
Data center revenue grew 34% in Q3 2026 with 102 MW of new leases (137 MW year to date); backlog is expected to drive 25%+ growth in 2026 and supports about US$1.7 billion of annual revenue before new leasing; 32 data centers, capacity to grow more than 2.5x to 1.4 GW from 545 MW, and about 325 MW of leasable capacity expected to energize in 24 months. Chart shows revenue from US$0.3B (2021) to about US$1.1B (2026E) and US$1.3B+ (2027E), about 25% CAGR.
Left two-thirds stacked with three colored section bars (grey, blue, navy) and bullets; right framed bar chart with backlog shading
Iron Mountain positions itself as a leader in a fragmented, growing ALM market of about US$35 billion, serving 40 countries with direct operations in 10 markets; ALM revenue rose 43% reported and 38% organic in Q3 2026. Enterprise ALM and Data Center Decommissioning columns describe the offering and differentiators.
Three intro bullets; two dotted-border grey text panels flanking a central pie chart titled Market Size
Section divider introducing the quarterly results and full-year outlook.
Teal background with an orange angled shape holding a hard drive photo and white heading on the right
Total revenue US$1,991M vs. US$1,754M (+13%), with Global RIM US$1,433M (+7%), Global Data Center US$274M (+34%) and Corporate and Other US$284M (+34%); net income US$129M (+49%), reported EPS US$0.41, Adjusted EPS US$0.64 (+19%), Adjusted EBITDA US$748M (+13%, 37.6% margin), AFFO US$458M (+17%) and AFFO per share US$1.53 (+16%). Highlights note data center renewal pricing +10% cash and +15% GAAP, leverage of 4.8x within the 4.5x-5.5x target, and a 15% dividend increase effective January 2027.
Split layout: grey left panel with bullet highlights, white right panel with a financial table (three months ended 9/30/26 vs. 9/30/25, reported and constant-FX growth)
Q4 2026 guidance of about US$2,030M revenue, US$780M Adjusted EBITDA, US$473M AFFO and US$1.57 AFFO per share; full-year 2026 revenue US$7,950-8,020M (about +16%), Adjusted EBITDA US$2,948-2,978M (about +15%), AFFO US$1,780-1,800M (about +16%) and AFFO per share US$5.94-6.00 (about +15%). A note says the raised guidance absorbs the impact of a stronger US dollar.
Centered four-column table with a blue header row and footnote text at the bottom
Operating cash flow approaching US$2.0 billion a year covers recurring capex and the dividend; Adjusted EBITDA growth supports more than US$2.0 billion of leverage-neutral growth capital; dividend growth is tied to AFFO per share growth (15% increase announced November 2026); data center developments are pre-leased to hyperscalers for 10-15 years; target leverage 4.5x-5.5x, 4.8x in Q3 2026.
Three rounded navy banners, each followed by one or two bullets
Three takeaways: Strong Foundation (global leader, recurring model, 95% of the Fortune 1000), Executing Growth Strategy (US$170 billion addressable opportunity; growth businesses expected to grow revenue 37% in 2026 and make up 34% of revenue) and Exceptional Financial Track Record (13% revenue and Adjusted EBITDA CAGR ex-FX since 2021, dividend increases in line with AFFO per share).
Three numbered navy bars with cyan number circles, each followed by diamond bullet points
Section divider introducing the appendix.
Teal-to-light-blue gradient background with an angled photo cut-out of a person in a data center and a white heading
Net income (US$128.9M in Q3 2026 vs. US$86.2M) reconciled to Adjusted EBITDA (US$748.0M vs. US$660.4M), and reported EPS (US$0.41 vs. US$0.28) reconciled to Adjusted EPS (US$0.64 vs. US$0.54); structural tax rate 17.1% vs. 14.8%.
Two side-by-side reconciliation tables with alternating light-blue row shading and a footnote under the right table
Net income to FFO (Nareit) of US$250.3M and FFO (Normalized) of US$316.1M for Q3 2026, and FFO (Normalized) to AFFO of US$458.4M (US$1.53 per share vs. US$1.32), with weighted average share counts. Line items are in small type in this image-based deck; read the original filing for line-level detail.
Two compact reconciliation tables side by side with footnotes below each
Five-year Net income to Adjusted EBITDA reconciliation; Adjusted EBITDA of US$1,634.7M (2021), US$1,827.1M (2022), US$1,961.7M (2023), US$2,236.4M (2024) and US$2,574.0M (2025).
Single wide table with five year columns and banded rows
Five-year Net income to FFO (Nareit), FFO (Normalized) and AFFO reconciliation for 2021-2025, ending with AFFO of US$1,541.2M and AFFO per share of US$5.17 for 2025, with footnotes on definitions. Line items are in very small type; footnotes not legible at this resolution in places, so refer to the original filing for detail.
Dense five-column table on the left two-thirds with a footnote column on the right
Definitions of Adjusted EBITDA (and Adjusted EBITDA Margin) and Adjusted EPS, listing the items excluded from each.
Two text blocks on the left with a diamond photo collage of technology imagery on the right
Definitions of FFO (Nareit), FFO (Normalized), FFO (Normalized) per share, AFFO and AFFO per share as used by the REIT.
Text column on the left with a diamond photo collage of warehouse staff on the right
Closing brand slide with the tagline 'Elevate the power of your work' and the Iron Mountain logo.
Tagline and logo on the left, diamond-cropped portrait in the center right with outline diamond shapes
Perguntas comuns sobre este slide e o conteúdo da apresentação subjacente.
It is the 24-slide investor deck Iron Mountain Incorporated (NYSE: IRM) released on November 5, 2026 for its third quarter 2026 results. It was filed with the U.S. SEC as an exhibit to a Form 8-K on 2026-11-05 and covers results, 2026 guidance, segment updates and non-GAAP reconciliations.
According to the deck, total revenue was US$1,991 million (+13%), Adjusted EBITDA US$748 million (+13%, 37.6% margin), AFFO US$458 million (+17%), AFFO per share US$1.53 (+16%) and Adjusted EPS US$0.64 (+19%). Data center revenue grew 34% and ALM revenue 43%.
Revenue of US$7,950-8,020 million, Adjusted EBITDA of US$2,948-2,978 million, AFFO of US$1,780-1,800 million and AFFO per share of US$5.94-6.00, each roughly 15-16% higher year over year at the midpoint.
REITs use Funds From Operations (FFO) and Adjusted FFO (AFFO) because real estate depreciation can understate cash earnings. The appendix shows exactly how Iron Mountain reconciles net income to FFO (Nareit), FFO (Normalized) and AFFO, which makes it a good reference for REIT reporting.
Yes. The deck is available as the original PDF and as a PPTX converted from it. Because the source PDF is made of slide images, the PPTX is best used as a layout and structure reference; check figures against the original filing before reusing them.
The presentation is an exhibit to Iron Mountain's Form 8-K filed on 2026-11-05, available on the SEC's EDGAR system and on Iron Mountain's investor relations website.
The snapshot KPI page (slide 4), the four-chart growth page (slide 5), the stacked revenue-mix page (slide 6), the highlight cards (slide 8), the results table (slide 13) and the numbered investment takeaways (slide 16) adapt well to other earnings or investor presentations.
Most tables are readable, but the deck is image-based, so some line items and footnotes on the denser reconciliation pages (especially slide 21) are not legible at this resolution. Use the original SEC filing for line-level detail.
Form 8-K filed 2026-11-05 with the Q3 2026 earnings presentation as an exhibit
Company investor relations site with earnings materials

Create Your Own Slides
Turn your ideas into professional presentations in seconds with 2slides AI.
Referencie designs profissionais, escolha seu estilo e gere slides com renderização de texto perfeita. Alimentado por Nano Banana—comece a criar sua apresentação agora.
Seu Agente IA para slides. Economize tempo, brilhe mais rápido com criação inteligente de apresentações.


© 2026 2slides. Todos os direitos reservados.