
Faz parte de Exemplos de apresentações para investidores · Exemplos de apresentações para investidores da Austrália
Dyno Nobel FY2026 Full Year Results Presentation: Dyno Nobel Limited (ASX: DNL; OTC: DNLZY), the global explosives and mining services company, presents its 2026 Full Year Financial Results, dated 9 November 2026 and lodged with the ASX, for the financial year ended 30 September 2026 (FY26). All amounts are in Australian dollars (A$, shown as $m) unless stated otherwise; the energetics contracts are quoted in US$. It is the first full year as a pure-play explosives company after the Fertilisers separation ended with the sale of Phosphate Hill. Underlying DNL Explosives EBIT rose 12% to $485m on revenue of $3,406m (+10%), in line with guidance, driven by record results from Dyno Nobel Americas (DNA) and Dyno Nobel Asia Pacific (DNAP). Group statutory revenue was $3,941m (-26%) and NPAT excluding IMIs $331m. FY27 underlying EBIT guidance is ~$515m-$555m, and the company remains on track for its $600m FY28 EBIT ambition.
Usa a capa desta apresentação como referência de estilo para slides criados a partir do seu próprio conteúdo. Ou escolha qualquer página abaixo para usar o layout dela como referência.
Navegação Rápida
Tags
Compartilhar os slides
Dyno Nobel FY2026 Full Year Results Presentation: Dyno Nobel Limited (ASX: DNL; OTC: DNLZY), the global explosives and mining services company, presents its 2026 Full Year Financial Results, dated 9 November 2026 and lodged with the ASX, for the financial year ended 30 September 2026 (FY26). All amounts are in Australian dollars (A$, shown as $m) unless stated otherwise; the energetics contracts are quoted in US$. It is the first full year as a pure-play explosives company after the Fertilisers separation ended with the sale of Phosphate Hill. Underlying DNL Explosives EBIT rose 12% to $485m on revenue of $3,406m (+10%), in line with guidance, driven by record results from Dyno Nobel Americas (DNA) and Dyno Nobel Asia Pacific (DNAP). Group statutory revenue was $3,941m (-26%) and NPAT excluding IMIs $331m. FY27 underlying EBIT guidance is ~$515m-$555m, and the company remains on track for its $600m FY28 EBIT ambition.
Visualização detalhada de cada página de slide, incluindo layout, conteúdo principal e elementos visuais.
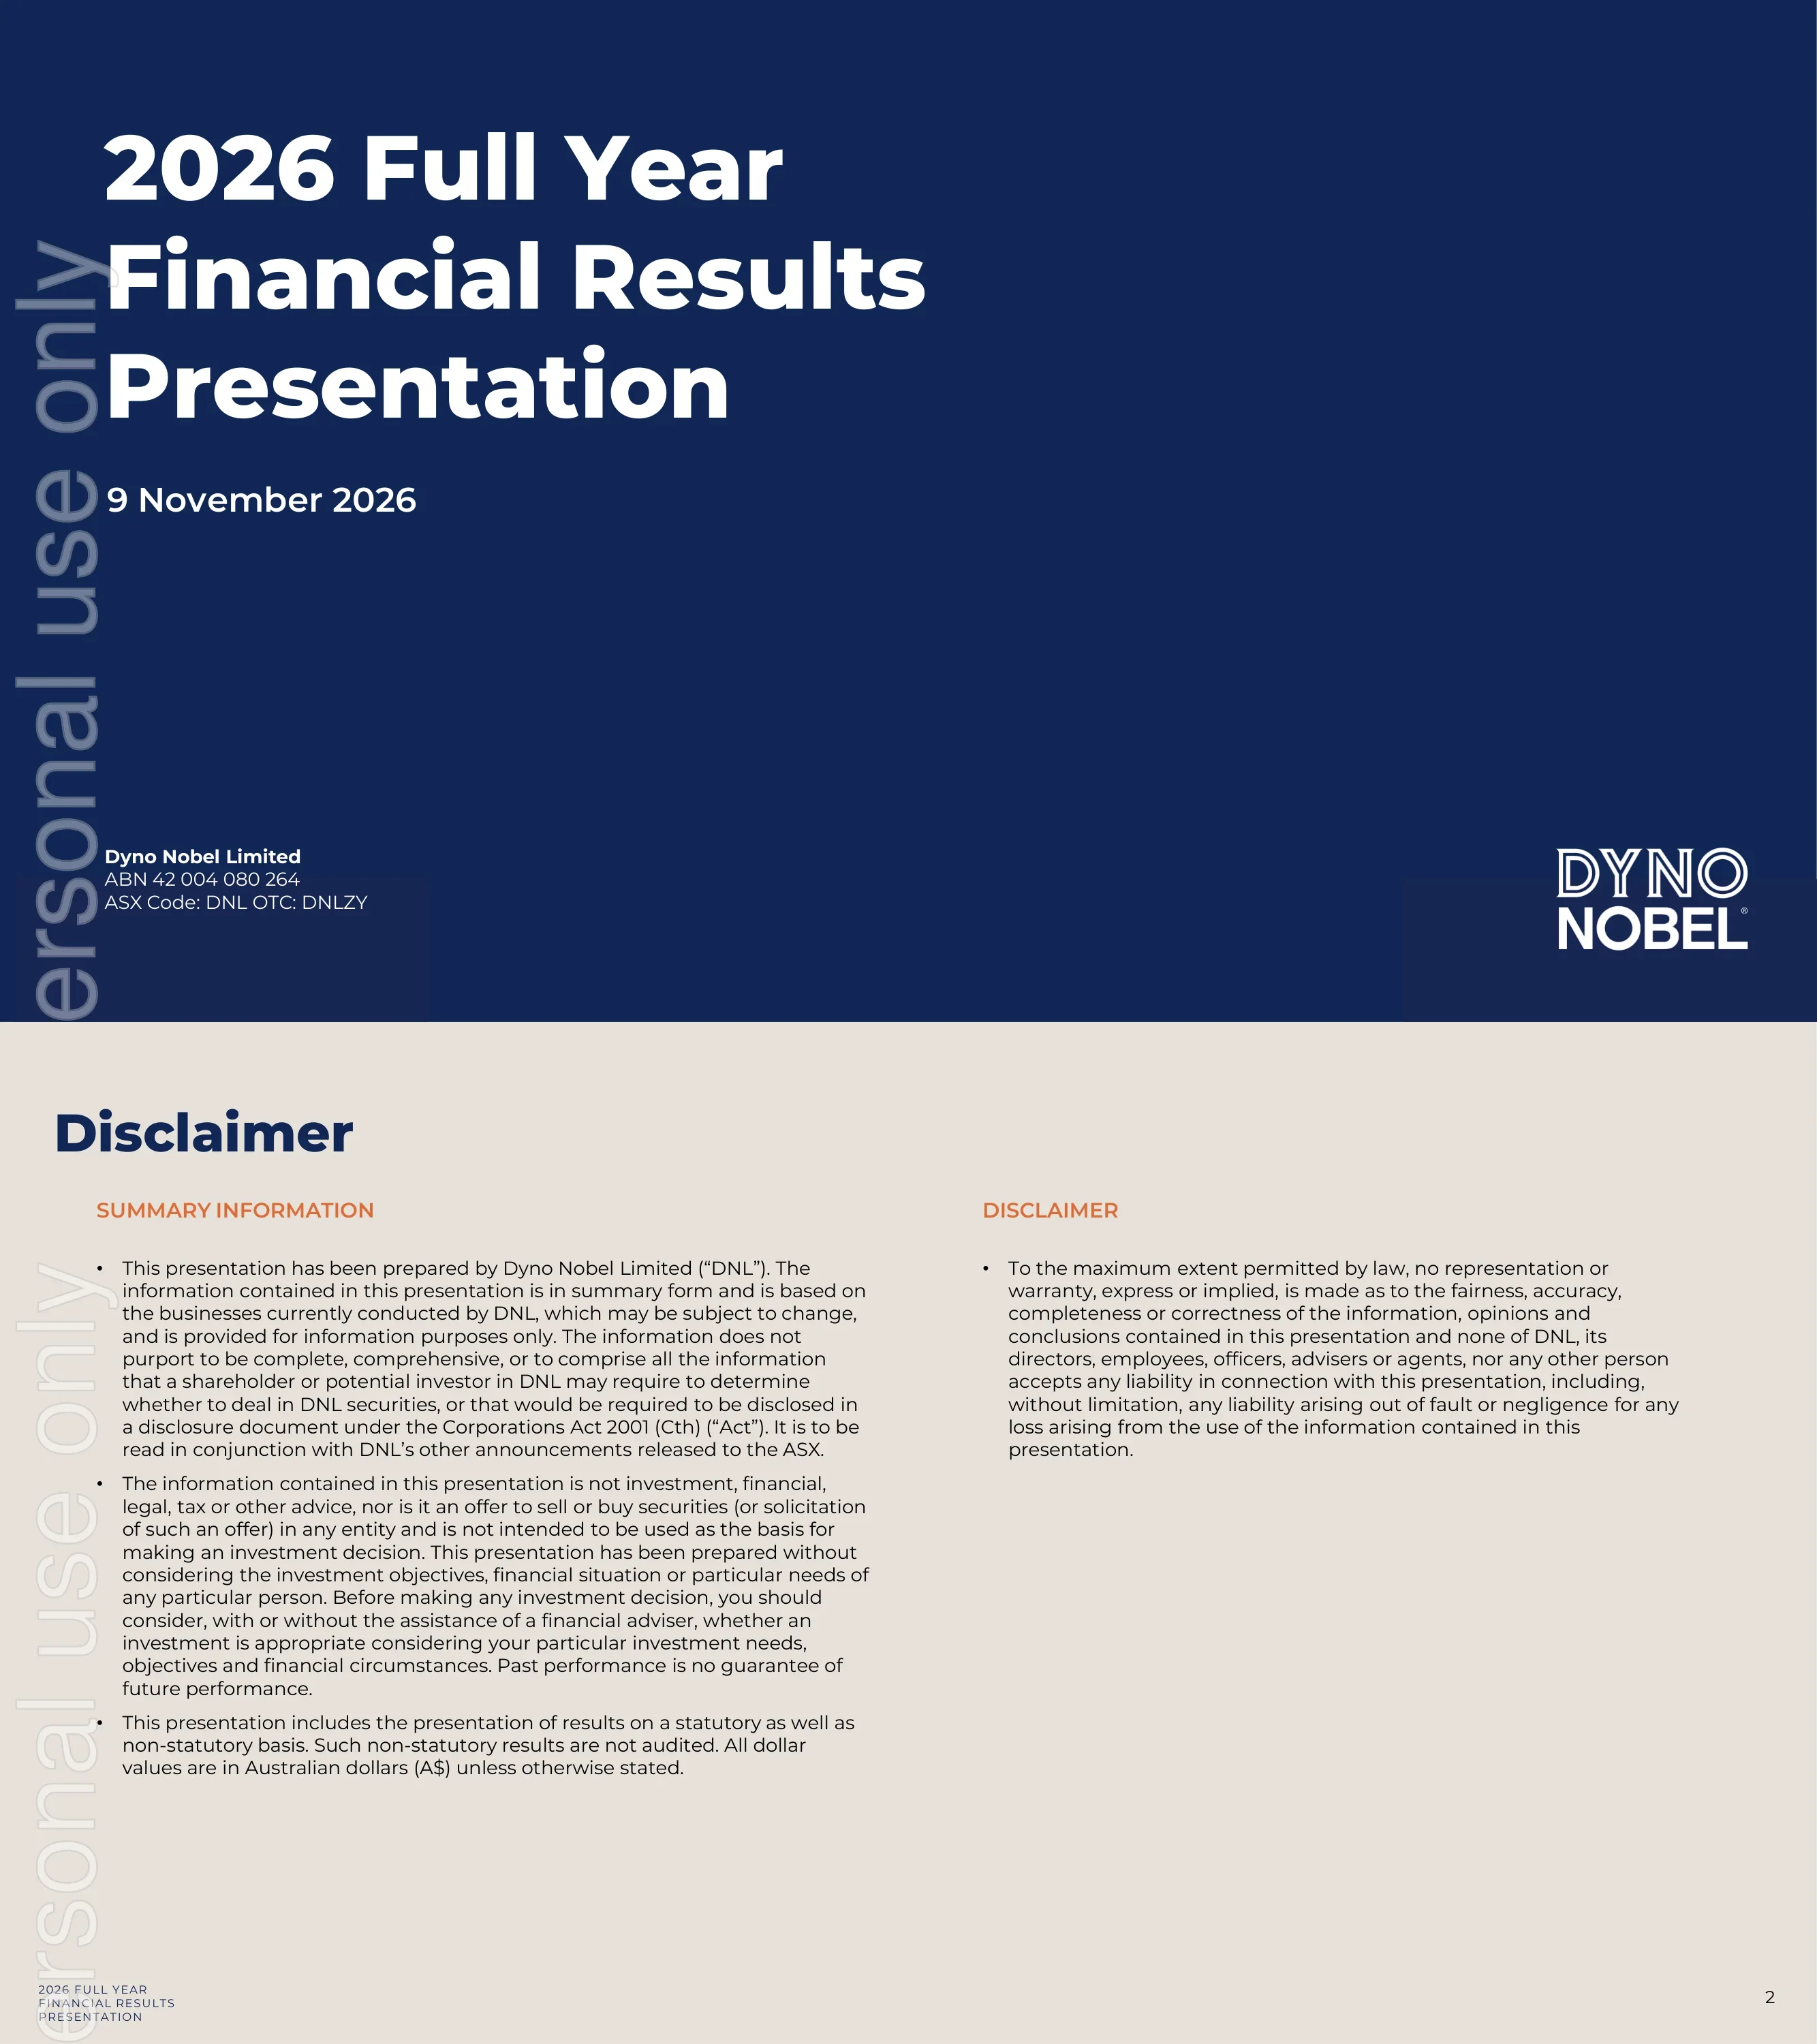
Cover slide for Dyno Nobel Limited's 2026 Full Year Financial Results Presentation, dated 9 November 2026, with ABN 42 004 080 264 and tickers ASX: DNL and OTC: DNLZY.
Full-bleed navy background with a large left-aligned white title, the date below and company details at the bottom left
Legal disclaimer stating that the presentation is in summary form, is not investment advice, and includes both statutory and unaudited non-statutory results. All dollar values are in Australian dollars (A$) unless otherwise stated.
Two-column text layout headed 'Summary Information' and 'Disclaimer' with orange subheadings
Forward-looking statements caveat covering the FY27 outlook and strategy. It states that financial ambitions and targets beyond FY27 are illustrative only and not guidance, and that third-party market data has not been independently verified.
Two-column dense bulleted text with a single orange subheading
Acknowledgement of the First Peoples of the land, sea and waters where the company lives and works, paying respects to Elders past and present.
Full-bleed Australian outback landscape photo with a centred semi-transparent navy text panel
Welcome slide introducing the presenters: Mauro Neves, Chief Executive Officer and Managing Director, and Nitesh Naidoo, Chief Financial Officer.
Navy-tinted mine-site background with the headline at the top left and two circular presenter portraits below
Four agenda items: FY26 highlights and outlook (CEO, page 7), FY26 financial performance (CFO, page 21), closing remarks and investment proposition (CEO, page 29), and Q&A (page 30).
Large 'Agenda' title on the left; a right-hand list of items separated by thin rules, with page references aligned right
Section divider for the CEO's FY26 highlights and outlook, presented by Mauro Neves, CEO and Managing Director.
Full-bleed navy duotone photo with a large white section title
FY26 guidance was delivered with $485m underlying EBIT on record DNA and DNAP performance. The company reported zero process safety incidents in 2H26, a 70% transformation exit run rate, completion of the pure-play transition with the Phosphate Hill sale, and ~US$1bn of government-funded energetics contracts. It expects an FY27 exit run rate of ~85%-95%, on track for the $600m FY28 EBIT ambition.
Navy left panel with headline and summary statement; two right-hand columns of four rounded cards each ('Delivered on FY26 commitments' and 'Strengthening the platform for growth')
TRIFR was 1.01 in FY26 (up 6% from 0.95, against a 0.76 target) but improved to 0.77 in 2H26 from 1.25 in 1H26. Process safety incidents fell 81% to 3 (all in 1H26), injury severity was down 41% since FY25, and 80% of sites recorded zero recordable injuries.
Two charts across the top (TRIFR column chart with a target line; process safety horizontal stacked bar chart by half), with highlights and improvement-driver bullets below
Group statutory figures: revenue $3,941m (-26%), EBITDA $778m, EBIT $504m, NPAT excluding IMIs $331m (-22%) and including IMIs $66m, ROIC 6.8%, dividends 9.6 cps, net debt/EBITDA 2.1x, and a $574.4m buyback completed at an average $3.01. Explosives underlying figures: revenue $3,406m (+10%), EBITDA $759m (+8%), EBIT $485m (+12%), ROIC 6.7%; underlying EBIT grew from 300 (FY23) to 485 (FY26), with an FY27 outlook of ~$515m-$555m.
Left half: DNL Group Statutory KPI tiles with orange outlines; right half: DNL Explosives Underlying KPI tiles above a column chart with a dotted FY27 outlook bar
FY26 net transformation benefits totalled $51m: Commercial $51m, operating model $16m, procurement $7m, manufacturing $13m and priority growth regions $19m, less $55m of offsets. The offsets were FX of ~$14m (AUD:USD 0.69 vs 0.64), ~$11m higher depreciation, ~$10m inflation and ~$16m of unplanned downtime at Cheyenne and the WALA turnaround.
Left: initiative / lever / benefit table with a navy header and total row; right: two bulleted panels for highlights and offsets
FY27 transformation outlook of $30m-$70m: Commercial $20m-$30m, Operational $0m-$15m, priority growth markets $35m-$50m, less ~$25m of offsets (~$10m Moranbah maintenance, ~$5m FX at AUD:USD 0.70). This targets an 85%-95% exit run rate of the ~$300m EBIT ambition.
Left table of initiatives, levers and FY27 outlook ranges with total and exit-run-rate rows; right panels for initiatives and offsets
EBIT reconciliation from statutory to underlying for FY23-FY31: Dyno Explosives underlying EBIT of 300 (FY23 baseline), 374, 434 and 485 (FY26), rising to ~515-555 (FY27 guidance), ~600 (FY28 ambition) and ~800 (FY31 ambition). Exit run rate went from 47% to 70% to ~85%-95%. $185m of net initiatives were delivered FY24-FY26: Commercial $154m, Operational $83m, Growth $59m, less offsets of $111m.
Wide reconciliation table on the left; right beige panel with four rounded callout cards showing large orange dollar figures
Five megatrends support long-term growth: energy transition (~50% growth in copper material moved 2021-31), supply chain security (~$30bn of US critical minerals reshoring), AI and infrastructure (>$1tr of AI-related investment over 3-5 years), productivity (~6-8% decline in ore grades over 10 years), and defence energetics (market expected to double, +2.0x, by 2035).
Intro statement with a play-arrow connector at the top; white panel with five equal icon columns, each with a large headline statistic
FY26 contract wins in priority markets: Canadian revenue grew >40% (including Agnico Eagle's Hope Bay and Skeena's Eskay Creek), WA hard-rock growth, a Malaysia capital-light entry, and wins in Ghana, Tanzania and Brazil. Metals revenue grew 17% and its contribution rose from 38% to 42%, with 29% North American metals growth, >10 new Australian hard-rock sites and 4 new Africa/LATAM sites.
Left beige panel with regional bullet lists; right side with two small bar charts and three stat callouts along the bottom
Timeline of DNEL operations mobilising in Africa and Latin America. Services commenced at AGA Obuasi and AGA Iduapriem (Ghana) in September 2026; the AGA Geita (Tanzania) start, Peru Ilo emulsion plant commissioning and Brazil Vale Fabrica operations are targeted for 1Q FY27.
Left vertical timeline with orange date markers; right half a full-height aerial mine photograph
Premium technology adoption is lifting revenue quality: Electronics volume grew 11% YoY, premium products earn a 1.2x higher operating margin than standard products, and usage of the Nobel Fire digital platform rose 19% YoY.
Three equal columns with coloured header pills (navy, orange, taupe), each with a headline, a description, a circular metric badge and a two-bar comparison chart
The autonomous bench solution offers five customer benefits: safety, unlocking resources, extraction optimisation, productivity and energy efficiency. The autonomous dipping, priming, loading and stemming equipment has been manufactured, and the first trial with partner Mariana Minerals is due by mid-2027.
Left half: navy-tinted truck photo with five icon-led benefit rows; right half: an orange-bordered 'Staged pathway to first trial' card and a closing statement
Two government-funded projects at Graham, Kentucky, US$435m TNT and US$581m IMX (~US$1bn in total), are delivered through the 50/50 Nitradyn JV with Paligen. First TNT production is expected in late 2028 and first IMX in 2030, with ~A$30-40m EBIT contribution included in the Group's $800m FY31 EBIT ambition.
Left column of orange-headed strategic value points; right column showing a vertical flow of milestone boxes from 2025 to FY31 connected by orange arrows
The ~US$581m IMX-104 project at Graham, Kentucky comprises 5 smaller plants producing components such as RDX and HMX, with first production in 2030. At Vonges, France, Dyno Nobel is progressing a potential new energetics facility as European demand is expected to double from 2026-2035, with offtake discussions under way with Europe-NATO aligned customers.
Two-column comparison with site headings and bullets above, and aerial photographs of each site below
Section divider for the CFO's financial performance review, presented by Nitesh Naidoo. The slide is titled 'FY27 Financial performance' even though the section covers FY26 results.
Full-bleed navy duotone photograph with a large white section title at the top left
Four financial takeaways: 12% underlying EBIT growth on record DNA and DNAP, JV earnings up 16% lifting JV tax-adjusted EBIT to $518m, $51m of transformation benefits with a 70% exit run rate, and a forward contract book at 2.0x FY26 revenue with revenue growth of +10%.
Navy left panel with headline and summary; four horizontal white banner cards with circular orange-outlined icons over a mine-site photo
Explosives momentum indicators: forward contract value ~2.0x FY26 revenue; underlying EBIT growth of 17% p.a. FY23-FY26 (300 to 485); ROIC up 0.9 percentage points (5.8% to 6.7%); and underlying EPS growth of 39% p.a. (7 to 18 cents).
Four beige tiles in a row, each with a headline metric and a bar chart, with a one-line takeaway beneath each tile
Group FY26 revenue of $3,941m split into Explosives $3,406m and Discontinued Operations (Phosphate Hill, 1H26 only) $535m, vs $5,345m in FY25. EBIT excluding IMIs was $504m (Explosives $485m, +17%), NPAT excluding IMIs $331m, IMIs after tax $(265)m, and statutory profit after tax $66m vs a $(53)m loss.
Wide financial table on the left with Group / Explosives / Discontinued / FY25 / Change columns; 'Key callouts' bullets on the right
FY26 underlying EBIT by unit: DNAP $281m (+10%) on revenue of $1,310m, DNA $224m (+19%) on $1,863m, DNEL $18m (-40%) on $287m, and Corporate $(38)m, for a total of $485m (+12%). JV income rose 16% to $93m, JV tax-adjusted EBIT was $518m, and excluding FX, revenue grew 14% and EBIT 16%.
Dense business unit income statement table with $m and %yoy columns per unit and highlighted totals; key callouts on the right
Explosives capex was $282m in FY26, within the $265m-$285m guidance (FY25: $331m), with a capex-to-sales ratio of 8% (FY25: 7%). FY27 capex is expected at $370m-$420m, including ~US$40m for the Cheyenne turnaround and ~US$20m of defence and energetics investment.
Stacked column chart by capex category (FY25, FY26, FY27) with a legend on the left; key callouts on the right
Operating cash flow was $276m (FY25: $575m) with cash conversion of 35.5%. Net debt was $1,504m, net debt/EBITDA 2.1x, liquidity $833m and credit ratings BBB/Baa2; explosives EPS excluding IMIs rose 56% to 18.0 cents. FY26 dividends total 9.6 cps (interim 4.6 cps unfranked plus a final 5.0 cps, 50% franked, ~$87.6m), and the buyback returned $574.4m for 190.9m shares at an average of $3.01.
Left: key financial metrics table (FY26, FY25, change); right: dividend cards and a buyback/capital returns panel with orange outlines
FY27 guidance: underlying EBIT ~$515m-$555m, a 1H/2H split of ~40%/60%, borrowing costs ~$105m-$120m, tax ~20%-25% and capex ~$370m-$420m. Assumptions include corporate costs of ~$45m-$50m, AUD:USD 0.70, net debt/EBITDA near the top of the 1.75x-2.25x range, the QNP turnaround in 1H27 and the Cheyenne turnaround in 2H27.
Left half: photo of a bulk explosives truck with a translucent guidance box; right half: stacked panels of business unit and Group assumptions
Seven investment-thesis points: a safety and reliability track record, a pure-play explosives leader with contractual protections, attractive megatrends, growth markets and energetics, premium technology and privileged assets, deep customer relationships, and the people and systems to execute.
Left navy panel with a site photo and overlaid title; right column of seven checklist rows separated by rules
Question and answer session slide.
Full-bleed navy duotone photo with a 'Q&A' heading at the top left
Section divider introducing the appendix slides.
Full-bleed navy duotone photo of a mine blast with a large white title
The ambition is to be the leading global explosives player, guided by seven values (e.g. Zero Harm for Everyone Everywhere). Five strategic pillars support it: proprietary product technology, a superior bundled customer offering, deep customer relationships, privileged assets and network, and scaling with smart capital deployment.
Left column with ambition statement and values list; right section with five icon rows of pillar names and descriptions
Because JV income is reported after tax, adding back the FY26 JV tax of $33.3m lifts EBIT from $485m to $518m. On a share price of $3.82, 1,751m shares, a $6.7bn market cap and an $8.2bn EV, the EV/EBIT multiple falls from 16.9x to 15.8x.
Left combo chart (JV tax bars plus JV income line, FY23-FY26); right valuation comparison table
Net outstanding deferred items at the end of FY26 total $(3)m: Distribution $125m and Perdaman $145m receivable, against Geelong remediation $(35)m, Gibson Island remediation $(112)m and the Phosphate Hill ARO $(126)m. Up to $150m of contingent Phosphate Hill deferred consideration is valued at nil.
Table with colour-coded row labels, deferred $m values and commentary bullets, a navy total row and an italic contingent row
Showcases privileged assets (Indonesia booster plant, Türkiye detonator expansion, DYNOBULK Electric) and proprietary technology (Autonomous Bench, CyberShot/CyberDet II wireless detonators, TesMan Remote Loader). Customer case studies cite +A$20m a year of iron ore cost optimisation (~2.5-3x return) and +8pp gold recovery (89.8% vs 81.8%, ~US$215m over 10 years).
Three category columns (Privileged Assets, Proprietary Technology, Solutions Provider), with product cards and photos in the first two and two case-study tiles with orange footers in the third
AI is built into development of the Nobel Fire platform, delivering ~35% higher team velocity, >50% shorter cycle time and >90% less planning time, using three agentic AI agents. Platform metrics: ~140 new customer sites, 50 new blast-design customers, +70% blast designs and 4x vibration tool use.
Left column with the Nobel Fire logo, three large stats and checklist; right column with two product screenshots; a bottom row of four beige stat tiles
Planned plant turnarounds FY27-FY30: major turnarounds at Cheyenne, WY and QNP, Qld (50% JV) in FY27, a minor one at Cheyenne in FY28, and a major turnaround at Moranbah, Qld plus a minor one at Louisiana, MO in FY29.
Grid table with plants as rows and fiscal years as columns, using factory icons to mark major or minor turnarounds
FY26 ESG recognition: an improved S&P CSA score (59/100), a completed CDP report, retained FTSE4Good membership, an 'A' MSCI rating and the first ASRS report. GHG targets: 5% by 2025 achieved, 25% by 2030, a new 50% by 2036 target, Net Zero by 2050, and Scope 3 intensity targets of DNAP -25% and DNA -40% by 2030.
Left column of ESG rating logos paired with outlined callout boxes; right column with orange-headed GHG target sections
Perguntas comuns sobre este slide e o conteúdo da apresentação subjacente.
Dyno Nobel's financial year runs to 30 September, so FY26 covers the 12 months from 1 October 2025 to 30 September 2026. The deck refers to the end of FY26 as 'the end of September 2026' and contrasts it with QNP's financial year ending 30 June. The presentation is dated 9 November 2026 and was lodged with the ASX under ticker DNL.
All dollar values are in Australian dollars (A$, shown as $m) unless otherwise stated. Some items are quoted in US dollars, notably the ~US$1bn of government-funded energetics contracts (US$435m TNT and US$581m IMX), the Cheyenne turnaround (~US$40m) and the defence and energetics capex (~US$20m).
DNL Explosives underlying revenue was $3,406m (+10%), EBITDA $759m (+8%) and EBIT $485m (+12%), in line with guidance. On a Group statutory basis, revenue was $3,941m (-26%, reflecting the Phosphate Hill sale), EBIT excluding IMIs was $504m, NPAT excluding IMIs was $331m, and statutory profit after IMIs was $66m. Total FY26 dividends were 9.6 cents per share.
Statutory Group figures include the Phosphate Hill fertiliser business (discontinued, 1H26 only) and individually material items (IMIs) of $265m after tax. The DNL Explosives underlying figures cover only the continuing explosives business, exclude IMIs, and are normalised for plant turnarounds, Ag&IC earnings and stranded costs. Slide 13 reconciles the two.
FY27 underlying EBIT is guided at ~$515m-$555m with a ~40%/60% 1H/2H split. Other guidance: capex ~$370m-$420m, borrowing costs ~$105m-$120m and an effective tax rate of ~20%-25%. The assumptions include AUD:USD of 0.70, corporate costs of ~$45m-$50m, and a transformation exit run rate of 85%-95% of the ~$300m EBIT uplift target.
Net transformation benefits were $51m in FY26 and $185m cumulatively over FY24-FY26, giving a 70% exit run rate against the ~A$300m EBIT growth ambition. FY27 is expected to add $30m-$70m and reach an 85%-95% exit run rate. The company says it is on track for ~$600m underlying EBIT in FY28 and has an ~$800m ambition for FY31; both are illustrative, not guidance.
Through the 50/50 Nitradyn JV with Paligen, Dyno Nobel has secured government-funded TNT (US$435m) and IMX (US$581m) projects at Graham, Kentucky. First TNT production is expected in late 2028 and first IMX in 2030. North America energetics is expected to add ~A$30-40m EBIT within the FY31 ambition, and a potential new facility at Vonges, France is also being evaluated.
It suits investors, analysts and mining-services professionals reviewing Dyno Nobel, and IR or finance teams looking for a well-structured results deck. Its layouts can be adapted for your own earnings or strategy presentations, including KPI dashboards, statutory-to-underlying reconciliations, segment tables, outlook boxes and milestone timelines.

Create Your Own Slides
Turn your ideas into professional presentations in seconds with 2slides AI.
Referencie designs profissionais, escolha seu estilo e gere slides com renderização de texto perfeita. Alimentado por Nano Banana—comece a criar sua apresentação agora.
Seu Agente IA para slides. Economize tempo, brilhe mais rápido com criação inteligente de apresentações.


© 2026 2slides. Todos os direitos reservados.