
Faz parte de Exemplos de apresentações para investidores
Cathay Financial Holdings (國泰金控) 2026 First Half Financial Results, dated August 2026 and filed on Taiwan's Market Observation Post System (MOPS) for the investor conference (法說會) hosted by UBS. The 63-page English deck covers 1H26 (January-June 2026) results for Taiwan's largest financial holding company: net income of NT$ (New Taiwan dollars) 76.5bn, or NT$165.9bn including after-tax FVOCI equity disposal gains, plus segment deep dives on Cathay United Bank, Cathay Life, Cathay Century, Cathay SITE and Cathay Securities, a Cathay Life IFRS 17 and TIS solvency reference section, sustainability efforts, and an appendix.
Usa a capa desta apresentação como referência de estilo para slides criados a partir do seu próprio conteúdo. Ou escolha qualquer página abaixo para usar o layout dela como referência.
Navegação Rápida
Tags
Compartilhar os slides
Cathay Financial Holdings (國泰金控) 2026 First Half Financial Results, dated August 2026 and filed on Taiwan's Market Observation Post System (MOPS) for the investor conference (法說會) hosted by UBS. The 63-page English deck covers 1H26 (January-June 2026) results for Taiwan's largest financial holding company: net income of NT$ (New Taiwan dollars) 76.5bn, or NT$165.9bn including after-tax FVOCI equity disposal gains, plus segment deep dives on Cathay United Bank, Cathay Life, Cathay Century, Cathay SITE and Cathay Securities, a Cathay Life IFRS 17 and TIS solvency reference section, sustainability efforts, and an appendix.
Visualização detalhada de cada página de slide, incluindo layout, conteúdo principal e elementos visuais.
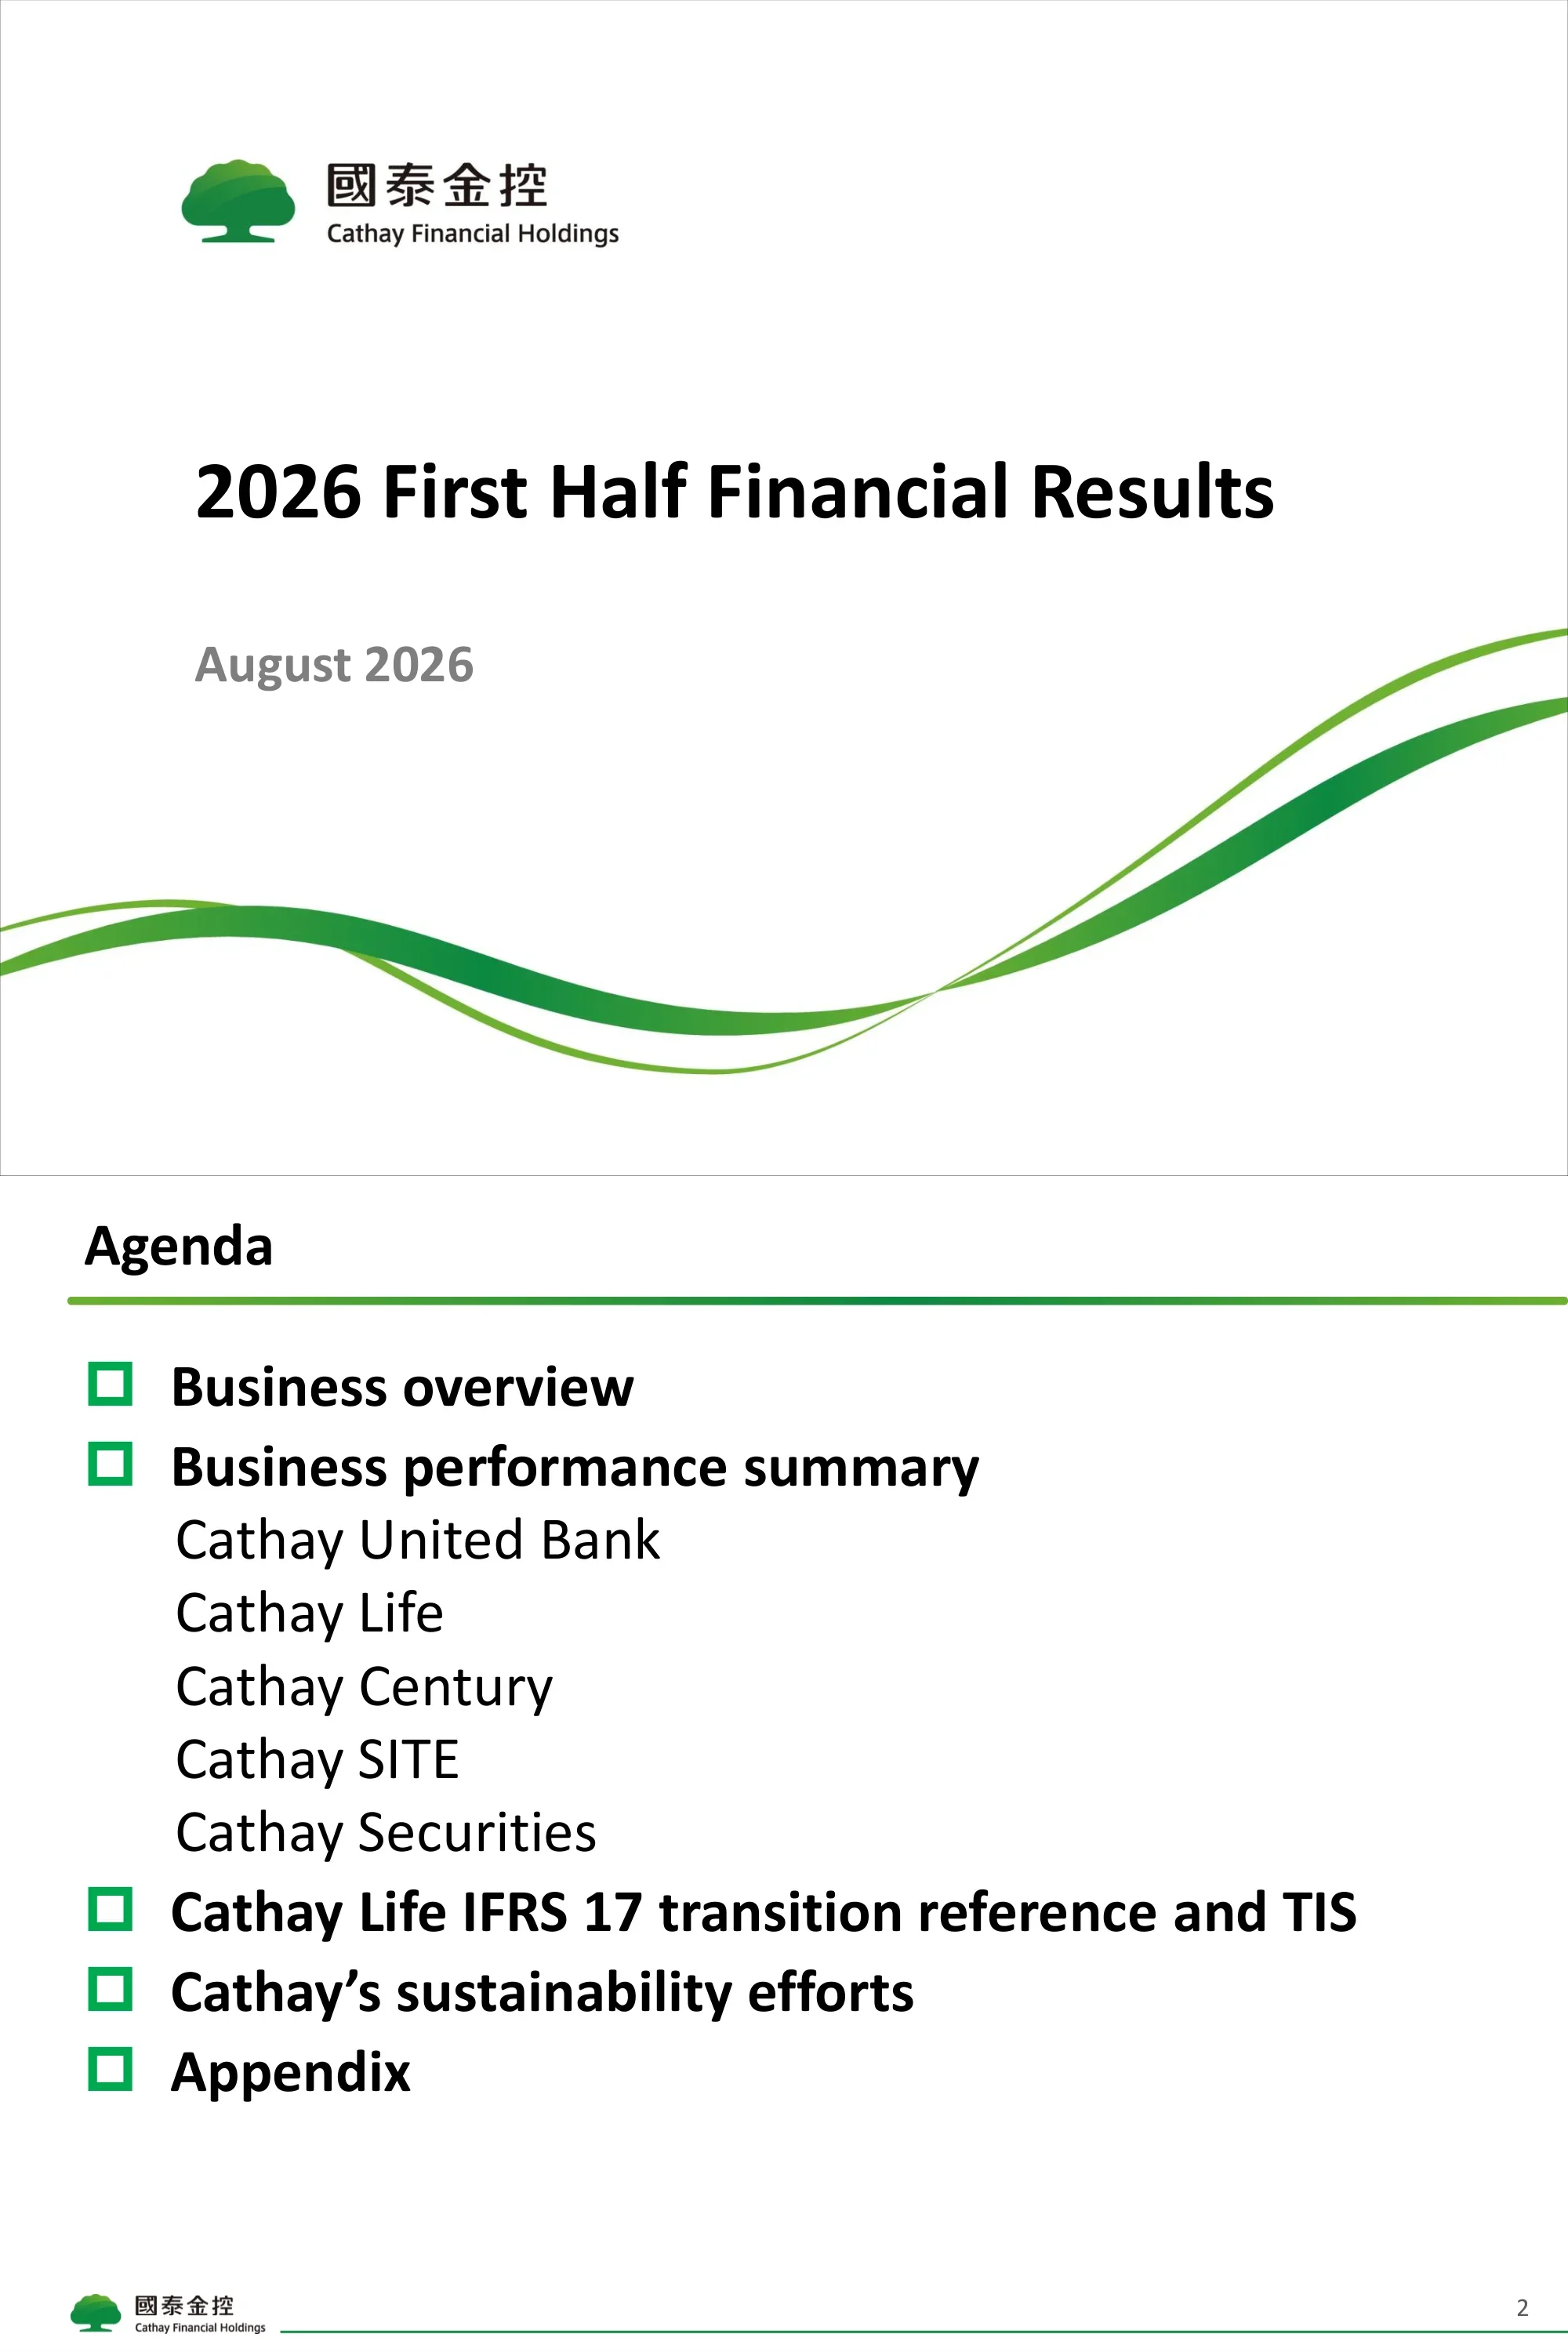
Cover slide for Cathay Financial Holdings (國泰金控) titled 2026 First Half Financial Results, dated August 2026.
White cover with logo at top left, large left-aligned title and date, and green ribbon wave graphic across the bottom.
Lists the sections: business overview, business performance summary (Cathay United Bank, Cathay Life, Cathay Century, Cathay SITE, Cathay Securities), Cathay Life IFRS 17 transition reference and TIS, sustainability efforts, and appendix.
Single-column bulleted agenda with green square bullets and indented subsidiary list.
Cathay FHC is shown as the #1 FHC with 15mn+ customers (65%+ of Taiwan's population) and US$470bn total assets as of June 30, 2026. Subsidiary cards give rankings (CUB #2 private bank, Cathay Century #2 non-life at about 14% share, Cathay Life #1 life insurer at about 20% share) and a bar chart ranks total assets, with Fubon next at 432.
Org-chart style top row of five subsidiary cards, left KPI column, bottom ranked bar chart colored by ownership type.
Left chart shows EPS and ROE from FY12 to FY25, with FY25 EPS at NT$7.1 and ROE 11.7% and a FY21 peak of NT$10.3. Right charts show profit contribution by CUB, Cathay Life and others in NT$bn (FY25 total 107.6, with CUB 43.5 and Cathay Life 56.6) and as percentages.
Two-panel layout: combo bar and line chart on the left, stacked bars with 100% stacked version below on the right, footnote on Cathay Century FY22 loss.
1H26 net income reached NT$76.5bn; adding after-tax FVOCI equity disposal gains of NT$89.4bn gives NT$165.9bn, an all-time high above FY25. EPS was NT$4.95, or NT$11.04 including disposal gains per share, versus NT$2.89 in 1H25 (net income 45.9).
Headline bullet on top, two chart panels (net income, EPS) each with half-year comparison above and FY23-FY25 bars below.
CUB, Cathay Century, Cathay SITE and Cathay Securities posted first-half record net income. 1H26 net income by subsidiary: CUB 27.0, Cathay Life 46.2 (131.3 including disposal gains), Century 3.8, SITE 1.7, Securities 4.4 (NT$bn). ROE for Cathay FHC was 16.9% and CUB 16.3%, Cathay SITE 66.4%.
Four chart quadrants: subsidiary net income and ROE for 1H25 vs 1H26 on top, FY24 vs FY25 below.
1H26 net worth reached a record NT$1.1tn (1,130.2bn), versus 1,103.0 at 1/1/26 and 934.4 at FY25; adjusted net worth including after-tax CSM was 1,583.0. BVPS was NT$70.4 and adjusted BVPS 101.2.
Headline bullet over two bar-chart panels with a dashed divider separating historical years from the IFRS 17 opening and 1H26 columns.
A matrix counts footprints by business and country, for example Vietnam has 37 bank and 109 life locations, China has 7 bank, 48 life and 25 P&C. Text notes Vietnam life 1H26 premium of VND 1.5tn, China life premium up 81% YoY to RMB 7.5bn and Vietnam P&C premium of VND 274bn.
Top table of footprints, bottom left Asia map with business icons, bottom right three text blocks for banking, life and P&C.
Per-subsidiary highlights: CUB net income +15% YoY and net fee income +11%; Cathay Life new business CSM NT$53.9bn and net worth NT$958.7bn; Cathay Century market share 13.2%; Cathay SITE AUM NT$3.6tn with active ETF 00400A at NT$25.4bn; Cathay Securities gaining brokerage share.
Five horizontal rows, each with a blue arrow label on the left and 2-3 bullets on the right.
Agenda tracker with Cathay United Bank highlighted. Notes state that CUB, Cathay Life and Cathay Century sections are on a standalone basis and that figures are rounded.
Repeat of agenda list with a blue highlight bar on the current section and footnotes at the bottom.
Loans grew 14% YoY to NT$3,083.5bn at 1H26 from 2,709.9bn, with corporate 1,067.5 (34.6%), mortgage 1,477.8 (47.9%), consumer 516.6 and credit card 21.6. Annual loans reached 2,847.4bn in FY25 (+8%).
Two stacked-bar panels (half-year and annual) with percent share brackets and red circled growth callouts.
Deposits grew 15% YoY to NT$4,566.7bn, with demand deposits at 2,849.5bn lifting the demand deposit ratio to 62.4% from 61.4%. Annual deposits were 4,322.0bn in FY25 with a 58.7% demand ratio.
Two stacked-bar panels for 1H25 vs 1H26 and FY22-FY25 with ratio brackets and growth callouts.
Interest spread and NIM both expanded on strong FX loan growth and a higher demand deposit ratio. 1H26 spread was 1.93% and NIM 1.61%, with funding cost 1.19%; quarterly 2Q26 spread was 1.95% and NIM 1.63%.
Full-width four-line chart from FY21 to 1H26 over a bordered quarterly spread and NIM table.
Asset quality remained sound with NPL ratio at 0.14% and coverage ratio at 1100% in 1H26, versus 1200% in 1H25; mortgage NPL 0.19%. Gross provision was NT$4.3bn with 0.8bn recovery in 1H26.
Left NPL and coverage bar pairs with mortgage NPL boxes, right gross provision and recovery bars, each with half-year and annual rows.
SME loans rose 7% YoY to NT$376.6bn (12.3% of total loans). FX loans grew 34% YoY (26% excluding FX impact) to NT$378.3bn, driven by supply chain realignment and overseas capex demand; share of total loans 12.4%.
Two bar-chart panels FY22 to 1H26 with red YoY bubbles and a percentage-of-loans strip under each.
Offshore earnings grew 5% YoY to NT$5.4bn in 1H26 from 5.2bn, representing 16.7% of CUB pre-tax profits versus 18.4%. FY25 offshore earnings were 7.6bn (14.6%).
Two columns of bar charts, earnings on the left and share of pre-tax profits on the right, half-year on top and annual below.
Net fee income rose 11% YoY to NT$19.8bn in 1H26 from 17.8bn, with wealth management fees up 25%. Wealth management made up 70.2% (13.9bn) and credit card related 4.1bn; FY25 net fee income was 33.9bn (+22%).
Two stacked-bar panels with five-category legend, percent brackets and growth bubbles.
WM fees rose 25% YoY to NT$13,917mn in 1H26 from 11,152mn (FY25: 20,483mn). Mutual funds rose 60% to 4,884mn, securities and structured products rose 74% to 1,201mn, and insurance was 7,325mn. Including treasury product income, 1H26 WM income would be NT$17.4bn.
Summary table on top, two grouped bar charts below for 1H25 vs 1H26 and FY23-FY25 by product.
Agenda tracker with Cathay Life highlighted, repeating the standalone-basis and rounding footnotes.
Agenda list with blue highlight bar on Cathay Life and two footnotes.
Net income reached NT$46.2bn; including after-tax FVOCI equity disposal gains of 85.1bn, the amount in retained earnings totaled NT$131.2bn, a new all-time high. Insurance service result was 22.2bn (CSM and RA release 18.5) and financial result 38.8bn, with recurring investment income 134.6 offset by insurance finance expenses of 86.4.
Full-width waterfall chart from CSM release through financial result, other items, net income and disposal gains to the retained-earnings amount, with brackets for the two result groups.
FYP rose 105% YoY to NT$195.4bn and APE rose 27% to 39.3bn on strong investment-linked sales amid strong equity markets; investment-linked and interest sensitive annuity was 160.3bn of FYP. FX policies as a share of FYP excluding investment-linked were 69%.
Two stacked-bar panels (FYP and APE) across 1H24, 1H25 and 1H26 with percent brackets, plus an FX policies strip.
Premiums came mainly through tied agents and Cathay United Bank: tied agents were 81.5% of FYP and 78.9% of APE in 1H26, bancassurance-CUB 17.3% and 18.2%. Persistency ratios stayed above 95%, with 13-month at 97.7% and 25-month at 95.1%.
Two 100% stacked bars for FYP and APE channel mix, shared channel legend in the middle, persistency table at the bottom.
New business CSM reached NT$53.9bn (52.2bn in 1H25), with health and accident at 59% and tied agents plus telemarketing producing nearly 90%. CSM/FYP was 64% and CSM/APE 208% in 1H26.
Left: CSM margin table and two-bar chart. Right: two pie charts, new business CSM by product and by channel.
CSM balance reached NT$547.0bn, up 35.1bn or 6.9% YTD from 511.9bn, mainly from new business CSM of +53.9bn. CSM release was 17.4bn, an annualized release rate of about 6%.
Full-width waterfall from opening CSM through new business, interest accretion, variances and FX to closing CSM, with an oval callout for the YTD change.
After IFRS 17 adoption in 2026, 1H26 liability interest cost fell to 2.13% from about 3.4% (-127bps) and break-even asset yield to 2.07% from about 3.0%, reflecting market-based discount rates.
Two side-by-side bar panels, each comparing FY25 with 1H26, with footnotes explaining exclusions.
Total investments were NT$8,017.3bn at 1H26 (8,083.8bn at FY25). International bonds were 59.7% (4,788bn, 4.2% return), domestic equity 8.3% (669bn, 39.0% return including FVOCI disposal gains) and real estate 7.9% (634bn).
Wide data table with asset classes in rows and FY23, FY24, FY25 and 1H26 weights, amounts and returns in columns, alternating blue row bands.
1H26 after-hedging investment yield including FVOCI equity disposal gains reached 5.55% (3.27% excluding gains), versus 3.47% in 1H25. Pre-hedging recurring yield was 3.47%, up from 3.41%.
Two columns of bar charts, after-hedging yield and recurring yield, half-year comparison on top and FY21-FY25 history below.
FX asset of NT$5.54tn splits into 74% FX risk exposure and 26% reserve for FX policy; proxy and open positions are 60%, currency swap and NDF 36%. 1H26 hedging cost was 1.21% and the FX volatility reserve rose NT$17.1bn YTD to 130.9bn.
Left: stacked column linked by dashed lines to a pie. Right: hedging cost bars above FX volatility reserve bars.
1H26 net worth hit a record NT$958.7bn, up 454.2bn YTD; adjusted net worth was 1,396.3bn. OCI asset and liability valuations rose 328.1bn (assets +178.7, liabilities +149.3). E/A ratio and adjusted E/A ratio were 11.8% and 17.1%.
Three bullets over two chart panels: stacked net worth bars and a diverging OCI valuation bar chart.
Scorecard: FYP NT$195.4bn (+105% YoY), new business CSM 53.9bn, CSM balance 547.0bn; recurring yield 3.47%, hedging cost 1.21%, liability interest cost 2.13%; net income 46.2bn and 131.2bn in R/E; net worth 958.7bn, adjusted 1,396.3bn, E/A 11.8% and 17.1%.
Four horizontal rows with green label tiles on the left and three big-number KPIs each.
Agenda tracker with Cathay Century, Cathay SITE and Cathay Securities highlighted together.
Agenda list with a single blue highlight bar spanning three sub-items and footnotes.
Written premiums grew 4% YoY to NT$21.3bn with market share at 13.2% (13.5% in 1H25), ranking No. 2. Auto was 10.3bn (48.4%); nearly 50% of premiums came through group channels, with Cathay P&C agents at 50.7% and the group channel at 49.2%.
Left stacked bars of premium by line with market share strip; right 100% stacked bars of channel mix.
Retained combined ratio improved YoY to 87.2% from 89.6% as expanded underwriting capacity drove higher insurance revenue and loss ratios stayed stable. Combined ratio was 61.2% versus 82.3%.
Two single-series bar charts side by side under blue headers with one summary bullet on top.
Net income hit a record NT$1.65bn in 1H26, up 27% YoY, with ROE of 66.4%. AUM grew to NT$3.6tn (FY25 2.4tn), fund AUM reached 1.9tn and beneficiaries 3.3mn.
Four panels: net income and ROE combo chart on the left, AUM growth and fund business growth on the right.
Net income reached a first-half record NT$4.41bn, up 148% YoY, with ROE 44.7%, amid active Taiwan equity trading. Domestic brokerage market share rose to 4.63% and sub-brokerage trading value to NT$1.98tn in 1H26.
Four panels: net income and ROE combo chart left, market share line and sub-brokerage trading value bars right.
Agenda tracker with the Cathay Life IFRS 17 transition reference and TIS section highlighted; note says figures are on a standalone basis.
Agenda list with blue highlight bar on the IFRS 17 and TIS item and a single footnote.
Net worth moved from NT$749.0bn under IFRS 4 to 504.5bn under IFRS 17 at 1/1/26, but adjusted net worth with after-tax CSM is 914.0bn on a CSM balance of 511.9bn. Liability cost falls from about 3.4% to 2.2-2.3% and break-even asset yield from about 3.0% to 2.2%.
Four-quadrant layout with a green headline above each mini chart.
Insurance liabilities are measured with market-based discount rates and future profits are recognized as CSM of NT$511.9bn. Assets moved from 8,990.9bn to 8,726.0bn; liabilities from 8,241.9bn to 8,221.5bn, with IFRS 17 split into BEL 6,582.0, RA 62.6 and CSM 511.9.
Two bullets over two chart panels: a pair of asset bars and stacked liability bars with BEL, RA and CSM labels.
Financial assets were redesignated to align with liabilities across NTD and USD portfolios. Fixed income at amortized cost fell from 63% at 2025/12/31 to 41% at 1/1/26 and 40% at 6/30/26; FVOCI equity rose to 12% by 1H26.
Bullets on top, then three 100% stacked columns across dates with a red dashed arrow showing the shift.
The one-off impact mainly reflects remeasurement of NTD high-guaranteed-rate policies. Net worth goes from IFRS 4 NT$749.0bn through -70.0 and -184.2 adjustments to IFRS 17 net worth of 504.5bn, plus after-tax CSM of 409.5bn for adjusted net worth of 914.0bn; E/A ratio 9.4%, 6.8% and 11.9%.
Bullets above a full-width waterfall with an E/A ratio strip under the chart.
Compares the IFRS 9 overlay and IFRS 4 income statement with IFRS 9 and IFRS 17: CSM release becomes a key earnings driver, liability interest cost declines to about 2.2-2.3%, and FVOCI realized gains stay in retained earnings. Five numbered callouts explain insurance service result, financial result, other operating result, OCI and retained earnings.
Four bullets on top and a two-column side-by-side statement comparison with numbered green circles and gray explanation boxes.
Strong new business CSM generation supports earnings and capital strength; the CSM balance grows when new business CSM exceeds release, so CSM contribution rises over 2026-2030. Three illustrative charts (no numeric values shown) cover underwriting profit share, CSM movement and CSM balance by vintage.
Three bullets above three illustrative chart panels with green underlined headings and yellow trend arrows.
CSM accumulation remains a top priority with health products around 60% of new business CSM; focus is on products with capital contribution above 100%. A positioning map plots protection, USD traditional savings, investment-linked and participating products, with a ring chart of profit sources (CSM, mortality gain, interest spread, expense gain).
Left: bubble positioning map with a red dashed 100% line. Right: FYP and NB CSM mini bars above a donut diagram and product notes.
Health insurance FYP market share was 26% in FY25 versus 19% total FYP share. Tied agents produced 76% of Cathay FYP in FY25 versus 42% for the industry. The FitBack program has over 1.7mn members, and all health products integrate spillover mechanisms (585k policies, NT$34.8bn FYP in 2025).
Left: two bar chart blocks under green pills. Right: blue-pill sections for the FitBack app, health ecosystem tags and spillover products.
Asset allocation strategy: liability-driven investing, more fixed income, higher recurring income and gradual increase in NTD assets. ALM and risk management: redesignate AC assets to FVOCI for the USD book, minimize DV01 gap, and partially redesignate for the NTD book.
Two columns with icon headers and green underlines, each holding check-marked bullets in a light green panel.
Four key messages: CSM of NT$511.9bn and adjusted net worth of 914.0bn exceeding IFRS 4; profitability driven by CSM release and recurring spread; stronger ALM and risk management; and new business CSM strengthening capital.
Four rows each with a dark green label block on the left and bullet text on a light green panel.
Compares RBC (NAIC framework, VaR 95%, amortized cost for fixed income, locked-in liabilities) with Taiwan Insurance Solvency (ICS framework, VaR 99.5%, mark-to-market valuation, CSM 100% recognized as capital, stress-based calculation with broader risks).
Comparison matrix with gray row labels and blue RBC and green TIS columns, merged cells for shared valuation basis.
Transitional measures include a gradual phase-in of net fair value impact for legacy portfolios (thresholds at RBC 250% and 200%), linear increase of required capital over 15 years, and localized risk factors, e.g. Taiwan listed stocks 35% under TIS versus 21.65% (TWSE) and 30% (OTC) under RBC.
Three horizontal blocks with green rounded labels on the left and detailed bullets on the right, bottom block containing a three-framework comparison table.
Taiwan follows ICS guidelines for discount rates as required by the FSC; a liquidity premium of up to 50 bps is allowed for high guaranteed-rate policies (NTD reserve rate 6% and above). Risk-free rate is built in three segments by currency (LOT year-10 for TWD, year-30 for USD; LTFR 4.4% and 3.8%) plus a long-term spread of 0.25% (TWD) and 0.20% (USD).
Two bullets above a diagram: left, three-segment yield curve with currency tables; right, discount rate and risk-free curves with liquidity premium callouts.
Agenda tracker with Cathay's sustainability efforts highlighted.
Agenda list with a blue highlight bar on the sustainability item.
A timeline from 2011 CSR Committee through 2015 Equator Principles, 2022 RE100 and SBTi validation to 2024 impact investment. Targets: headquarters 100% renewable by 2025, zero coal lending by 1Q27, Taiwan operations 100% renewable by 2030 and net-zero operations and financial assets by 2050, with a high-carbon phase-out threshold table.
Top historical timeline in three eras with logos, middle target timeline with icons, bottom revenue threshold table.
Global recognition includes S&P Global Sustainability Yearbook 2026 top 5%, DJSI emerging markets 11 years, MSCI AAA, CDP A- level and Sustainalytics global top 10. Taiwan recognition includes TWSE corporate governance top 20% and top 2 in finance and insurance in the Global Views ESG award.
Two columns, Global and Taiwan, each with rows of logos and achievement captions separated by dotted lines.
Three pillars, Climate, Health and Empowerment, each with two sub-themes (e.g. net-zero financial assets by 2050, expand the healthy ecosystem, reskill and upskill), plus a Governance row covering board-level oversight, risk management, data and AI governance and ISO 27001 information security.
Three icon-headed columns on top with colored underlines and a four-column governance strip across the bottom.
A three-stage process: pre-investment and lending review with exclusionary screening and ESG integration, decision (exclusion, approve, impact investing, sustainability-themed products) and post-investment stewardship. 2025 highlights: NT$9.4tn in responsible investment and lending and 1,130 ESG risk cases reviewed, with 629 removed from the investable universe.
Three-column process flow with arrows between stages, and a two-stat highlight band at the bottom.
A pyramid sets the climate and nature engagement strategy, supported by international initiatives (e.g. Nature Action 100, TNFD, Climate Action 100+, PCAF) and corporate engagement actions including a sustainable finance summit held for 10 consecutive years. 2025 outcomes: 173 company engagements, 100% of selected high emitters engaged and 44% of them with 2050 targets (19 of 43).
Top three-tier pyramid, middle two-panel layout (initiatives and actions), bottom three-stat outcome strip.
Low-carbon investment and lending grew 2.5x from NT$150.9bn in 2018 to 375.2bn in 2025 (investment 327.8bn, lending 47.4bn), with 2,019 MW of solar and 1,373 MW of offshore wind financed. Green products include sustainability-linked lending of NT$107.8bn and renewable energy insurance coverage of 371.4bn.
Top green panel split into low-carbon investment and renewable energy blocks, bottom row of three product columns with icons and big numbers.
The FitBack digital health platform has 1.75mn members and 100% of health insurance carries wellness incentives; 272.7bn steps raised NT$27.7mn for charity (2022-2025). Financial health products include microinsurance (219,000 people, NT$70.0bn coverage), small-amount whole life (272,000 policies) and elderly-friendly insurance (192,000 policies, entry up to age 80).
Left: semicircular ecosystem diagram with stats below. Right: three stacked product rows with icons and paired metrics.
Workplace: 89% parental-leave return rate, 47% of STEM talent are women, 93% of employees equipped with AI application capabilities. Social: 8,637 students in financial literacy programs, 30+ women entrepreneurs supported, 4,800+ students in the dream-building program since 2013 and 7,222 seniors reached in 2025.
Two gold banner bands, each followed by icon-led stat blocks in three columns and a two-by-two grid.
Agenda tracker with the Appendix highlighted and a rounding footnote.
Agenda list with blue highlight bar on Appendix and a single footnote.
Total premium grew 46% YoY to NT$373.1bn in 1H26 from 255.2bn, driven by investment-linked products (167.2bn, 44.8%) and steady protection growth. Market share was 22.9% versus 19.4%; FY25 total premium was 519.2bn at 19.8% share.
Two stacked-bar panels (half-year and annual) with percentage brackets, growth bubbles and a market share strip.
7M26 cash dividend income totaled NT$12.7bn (5.1bn in 1H26 plus 7.7bn in July 2026) versus 18.7bn for FY25. Overseas bonds were 53% North America, 17% Europe and 30% Asia Pacific and others in 1H26.
Two panels: single-series bars with a stacked partial-year bar, and 100% stacked columns by region.
1H26 overseas bonds by currency: USD 95%, AUD 3%, Euro 1%, GBP 0.5%, CNH 0.2%, others 0.4%, all fully hedged to USD. By rating, 99.5% are investment grade and 0.5% non-IG.
Two large pie charts under blue headers, with leader-line labels and a yellow callout on the left.
Cathay FHC CAR was 117.2% at 1H26 (121.6% at FY25). CUB BIS capital adequacy was 15.5% (Tier 1 13.6%, Tier 2 1.9%), and Cathay Life RBC/TIS was 139.1% at 1H26 on the new TIS basis versus 310.2% RBC at FY25.
Three chart panels: CAR bars on the left, stacked BIS capital adequacy and Cathay Life RBC/TIS bars on the right, with a dashed divider for the regime change.
Perguntas comuns sobre este slide e o conteúdo da apresentação subjacente.
It is Cathay Financial Holdings' (國泰金控) 2026 First Half Financial Results deck, filed on Taiwan's Market Observation Post System (MOPS) on 2026-11-09 for an investor conference (法說會) hosted by UBS. A Chinese version of the deck also exists on MOPS; this gallery page shows the English version, with the trailing portrait-format appendix pages removed (63 pages).
The deck covers 1H26, meaning the first half of 2026 (January-June 2026), compared against 1H25 and full-year FY23-FY25. It is dated August 2026. A few items extend past June, such as Cathay Life's 7M26 cash dividend income through July 2026.
Cathay United Bank (CUB), Cathay Life, Cathay Century (property and casualty), Cathay SITE (asset management) and Cathay Securities each get their own section with charts and commentary. Overseas expansion in Asia is also summarized, including bank, life and P&C footprints in markets such as China and Vietnam.
Net income was NT$ (New Taiwan dollars) 76.5bn, or NT$165.9bn including after-tax FVOCI equity disposal gains recognized in retained earnings, an all-time high. EPS was NT$4.95 (NT$11.04 including disposal gains), net worth reached NT$1.1tn, and total assets are US$470bn, the largest among Taiwan's financial holding companies.
Yes. It shows a full financial holding company structure: group summary, then bank, life, P&C, asset management and brokerage sections, followed by an accounting-transition reference, ESG and appendix. Agenda trackers with a highlighted bar guide readers, and each section uses the same blue-header chart panels and red growth callouts.
It uses stacked bars for loans, deposits, fees and premiums, line charts for NIM and spread, waterfalls for earnings, CSM movement and net worth, pie charts for product and channel mix, comparison tables for RBC versus TIS, and KPI scorecards. Layouts are two-panel or four-panel grids with blue header bars and a green and blue palette.
Pages 36-49 explain Cathay Life's IFRS 17 transition: net worth moving from NT$749.0bn under IFRS 4 to 504.5bn, with adjusted net worth of 914.0bn including after-tax CSM, plus how the CSM balance drives future earnings and how the new Taiwan Insurance Solvency (TIS) regime compares with RBC. It also covers financial asset redesignation, ALM and the liability discount rate approach.
The layouts are good inspiration for investor presentations in banking, insurance or asset management, such as KPI scorecards, waterfalls, stacked breakdowns and comparison matrices. The content, figures and Cathay branding belong to Cathay Financial Holdings, so use the structure and styling as a reference and replace the data and logos with your own.

Create Your Own Slides
Turn your ideas into professional presentations in seconds with 2slides AI.
Referencie designs profissionais, escolha seu estilo e gere slides com renderização de texto perfeita. Alimentado por Nano Banana—comece a criar sua apresentação agora.
Seu Agente IA para slides. Economize tempo, brilhe mais rápido com criação inteligente de apresentações.


© 2026 2slides. Todos os direitos reservados.