
Faz parte de Exemplos de apresentações para investidores
CapitaLand Ascendas REIT (CLAR) 3Q 2026 Business Updates presentation, dated 29 October 2026 and lodged with SGX, covering Q3 and the first nine months of 2026 for Singapore's largest industrial and logistics REIT.
Usa a capa desta apresentação como referência de estilo para slides criados a partir do seu próprio conteúdo. Ou escolha qualquer página abaixo para usar o layout dela como referência.
Navegação Rápida
Tags
Compartilhar os slides
CapitaLand Ascendas REIT (CLAR) 3Q 2026 Business Updates presentation, dated 29 October 2026 and lodged with SGX, covering Q3 and the first nine months of 2026 for Singapore's largest industrial and logistics REIT.
Visualização detalhada de cada página de slide, incluindo layout, conteúdo principal e elementos visuais.
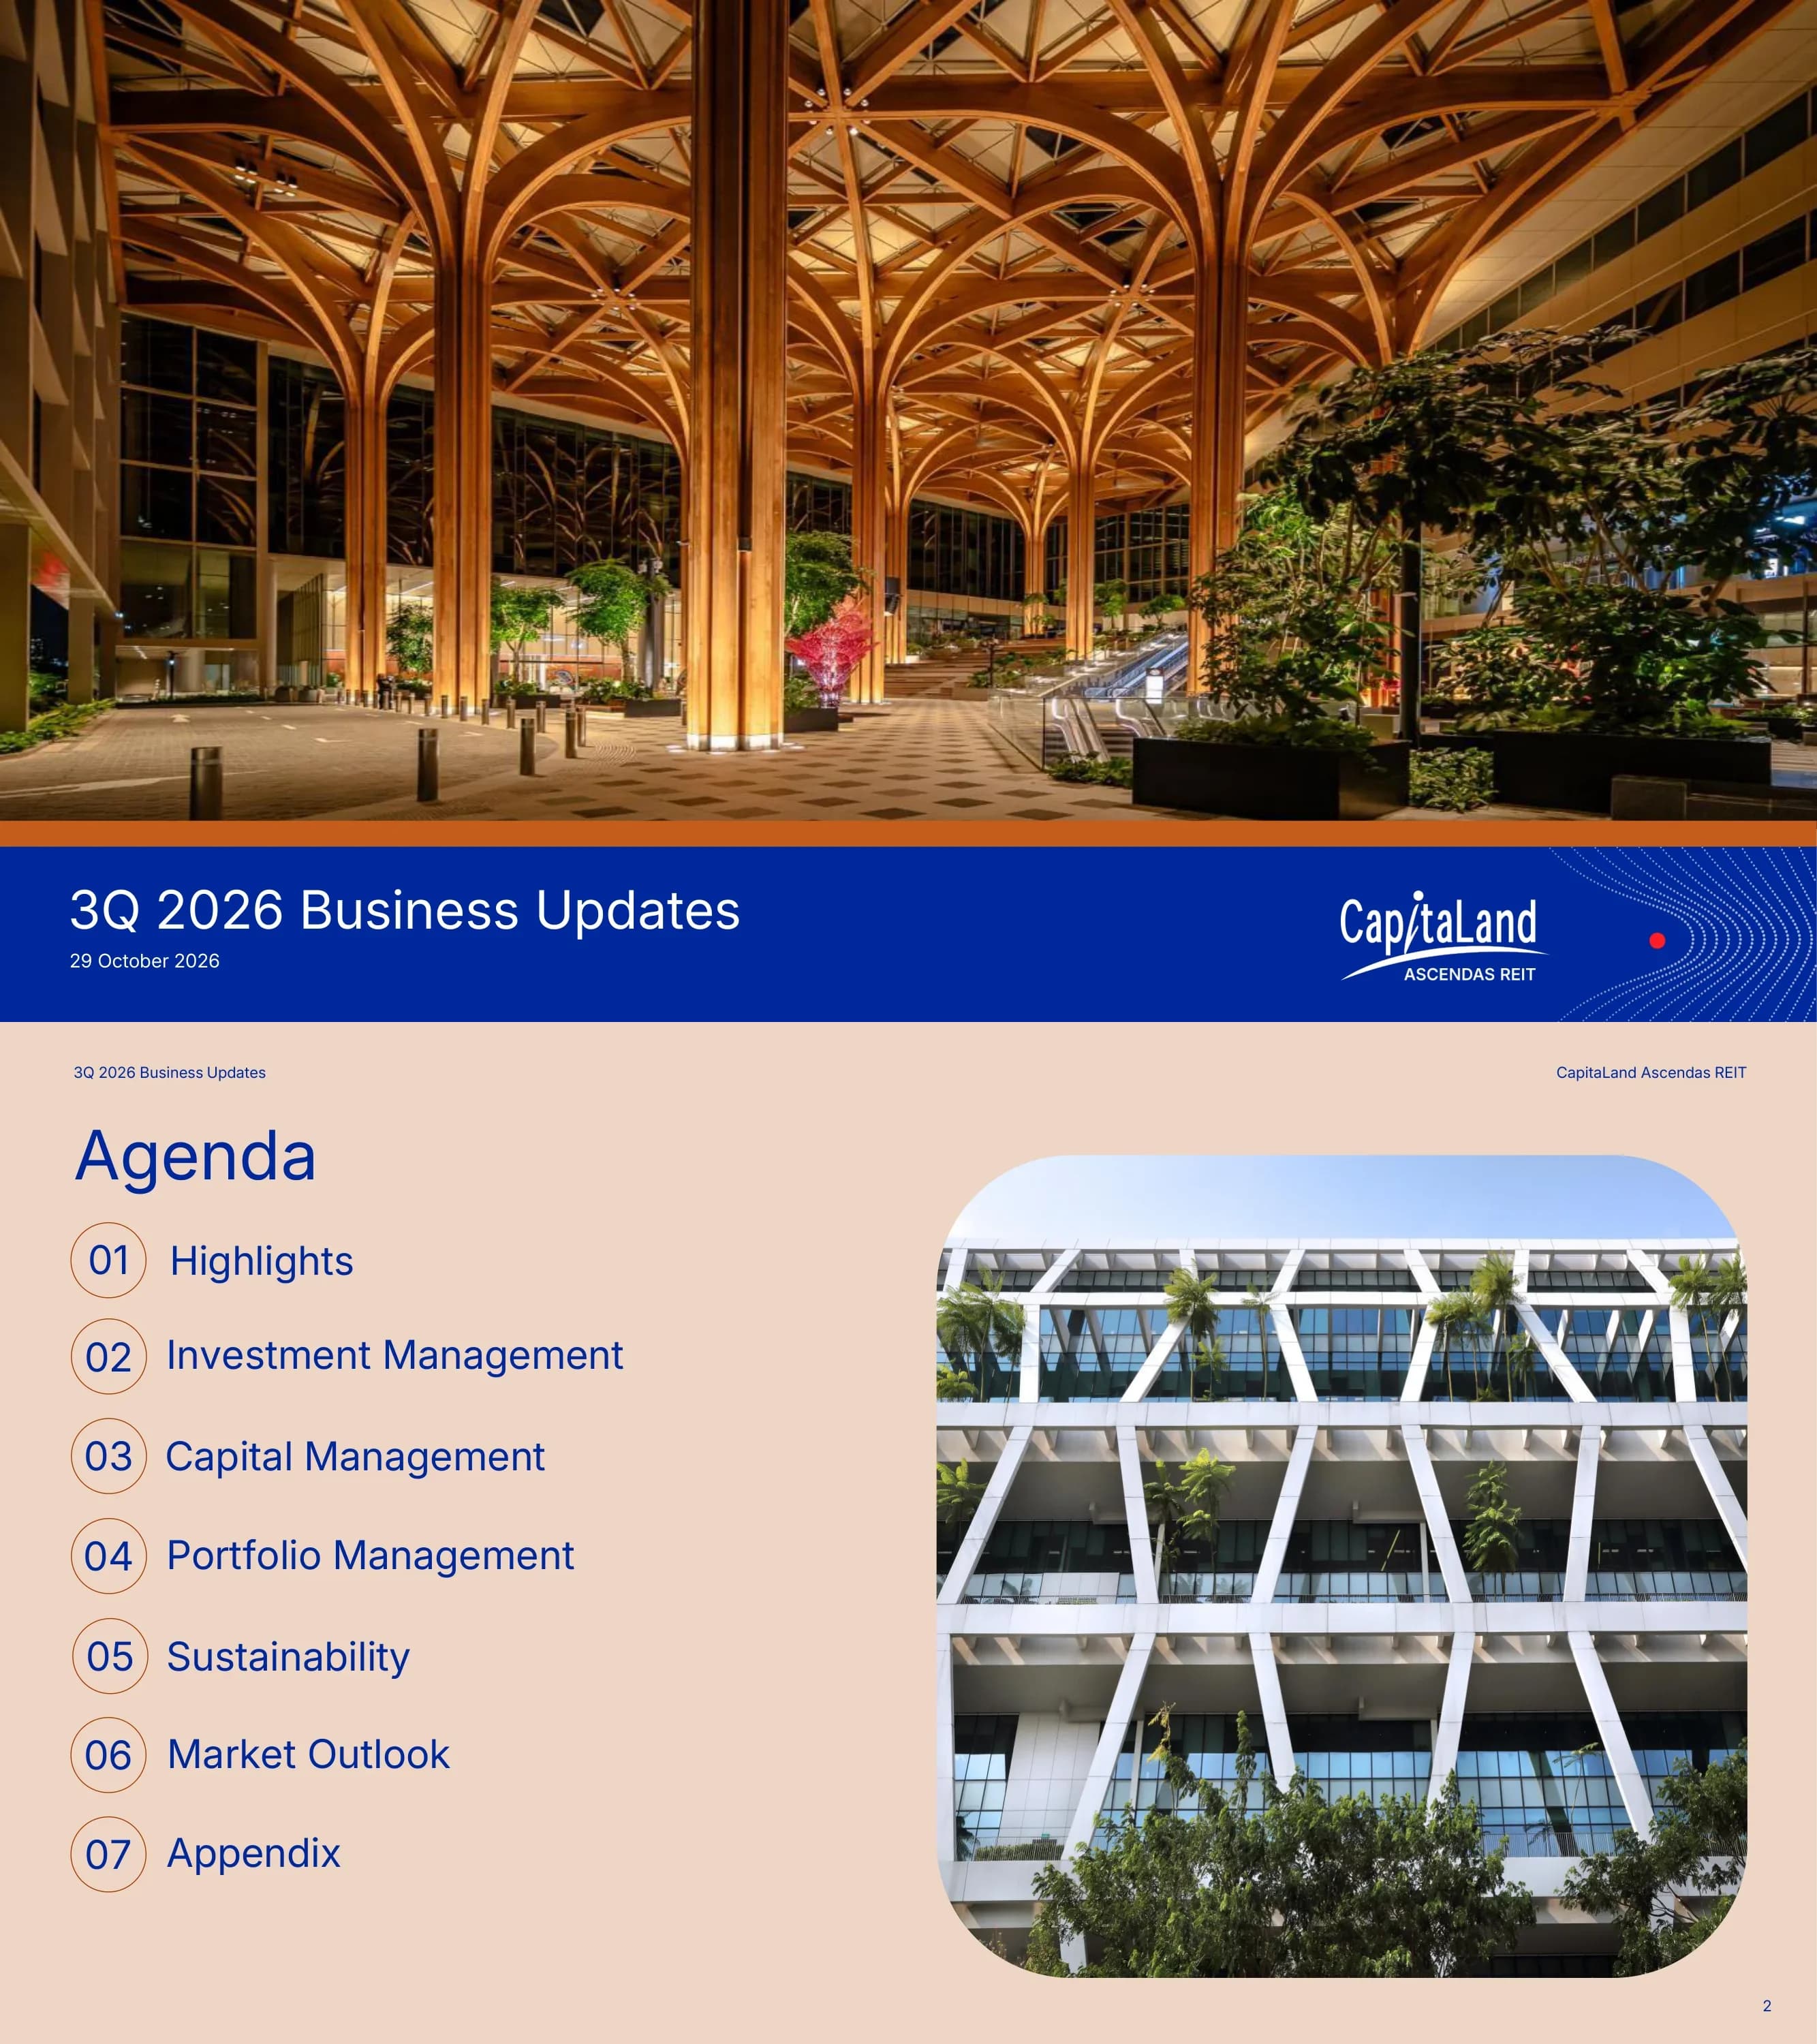
Cover of CapitaLand Ascendas REIT (CLAR) 3Q 2026 Business Updates presentation, dated 29 October 2026.
Full-bleed photograph of a timber-latticed atrium with an orange stripe, and a blue footer band with title, date and the CapitaLand Ascendas REIT logo
Seven numbered agenda items: 01 Highlights, 02 Investment Management, 03 Capital Management, 04 Portfolio Management, 05 Sustainability, 06 Market Outlook, 07 Appendix.
Left column of circled numbers with section names on a peach background; rounded-corner building photo on the right
Standard legal disclaimer: the presentation is for information only, contains forward-looking statements, is not an offer of securities, past performance is not indicative of future performance, and may not be reproduced without the Manager's consent.
Full-page justified text paragraphs under a large title
Section divider for Highlights.
Section divider with large section number and title on a terracotta/peach background, CapitaLand Ascendas REIT logo bottom left, and decorative circles
Acquisitions of S$638.1 million (initial NPI yields 6.6% - 6.9%); divestments of S$281.7 million at about a 25% premium over valuation. Portfolio occupancy 90.1% as at 30 Sep 2026 (30 Jun 2026: 89.1%); portfolio rental reversion +9.9% (9M 2026: +9.0%). Footnotes define the NPI yield basis and rental reversion.
Two panels split by a dotted divider: left with target icon and two KPI cards, right with warehouse icon and two KPI cards; footnotes at the bottom
Aggregate leverage 41.8% (30 Jun 2026: 39.7%), pro forma about 41% if S$255.0 million of divestment proceeds repay debt; cost of debt 3.4% (1H 2026: 3.5%). GRESB Real Estate Assessment 4-star retained, Public Disclosure 'A' rating for the 7th consecutive year, ranked 4th in the Singapore Governance and Transparency Index (REITs and Business Trusts), remained a FTSE4Good Index Series constituent.
Left panel with dollar icon and two KPI cards, right panel with plant icon and badge cards for sustainability ratings, GRESB and FTSE4Good logos
Section divider for Investment Management.
Section divider with large section number and title on a terracotta/peach background, CapitaLand Ascendas REIT logo bottom left, and decorative circles
Two Singapore logistics properties acquired for S$638.1 million, fully occupied: 5 Tuas Avenue 5 (S$133.9 million, completed 17 Aug 2026, WALE about 5 years, 2.0% annual escalation) and 25 Loyang Crescent (S$504.2 million, completed 27 Aug 2026, WALE about 13 years, 2.5% escalation). Expected initial NPI yields 6.6% and 6.9%. Total 9M 2026 acquisition value about S$1.8 billion.
Bullet list on the left; table on the right with property, consideration, country, segment colour dot and completion date, plus a total row and segment legend
Three Singapore divestments for S$281.7 million: Kim Chuan Telecommunications Complex (S$200.4 million), 17 Changi Business Park Central 1 (S$60.0 million, new) and 9 Serangoon North Avenue 5 (S$21.3 million, new), all estimated to complete 4Q 2026. About 25% premium to valuation and about 86% premium to purchase price; Singapore occupancy would rise to 91.5% pro forma from 90.9%; pro forma aggregate leverage about 41%; FY 2025 pro forma impact of -S$10.6 million NPI and -0.210 cents DPU.
Bullet list left, table right with sale price, country, segment dot and estimated completion, total row and legend
Six-storey business space asset with about 32 years of land lease left. Sale price S$60.0 million versus valuation S$58.5 million (31 Aug 2026) and purchase price S$32.8 million (2002); GFA 18,123 sqm; occupancy 2.7% at 30 Sep 2026; pro forma FY 2025 impact -S$0.8 million NPI and -0.013 cents DPU; completion 4Q 2026.
Two-column property fact table on the left with a building photograph on the right
Four-storey high-specifications industrial building in Ang Mo Kio Industrial Estate with about 42 years of land lease left. Sale price S$21.3 million versus valuation S$15.8 million (30 Jun 2026) and purchase price S$18.3 million (2008); GFA 9,797 sqm; occupancy 0%; pro forma FY 2025 impact +S$0.2 million NPI and +0.006 cents DPU; completion 4Q 2026.
Fact table on the left with exterior photograph on the right
Seven ongoing projects with an estimated total cost of S$847.7 million: acquisitions under development S$350.1 million (Manton Wood S$87.2 million, Towcester S$262.9 million, UK); redevelopments S$476.7 million (2 Clementi Loop S$136.2 million, Hawleys Lane S$76.2 million, 29 International Business Park S$264.3 million); AEI S$20.9 million (5005 and 5010 Wateridge, San Diego; 1-5 Thomas Holt Drive, Sydney). Stabilised yields on cost expected 6% to 8%.
Bullets on the left; grouped table on the right with category subtotal rows, cost, country, segment dot and completion
Repositioning into a logistics facility with flexible mid-box units, targeting BREEAM Excellent; NLA 293,654 sqft; cost S$76.2 million; estimated completion 2H 2028. Decommissioned for redevelopment on 30 Jul 2026.
Fact table on left; two artist's impression images (exterior and aerial) stacked on right
Formerly Acer Building; a future gateway to International Business Park integrating Work, Learn and Play. Plot ratio rises from 2.5 to 3.5, adding about 14,000 sqm of GFA, of which 11,500 sqm (82%) is for retail, F&B and lifestyle amenities. Targets BCA Green Mark Platinum; GFA 43,200 sqm; cost S$264.3 million; completion 1H 2030.
Fact table with long description on left; two artist's impressions on right
Recent developments in stabilisation show healthy leasing: 1, 1A and 1B Science Park Drive (committed occupancy 80.8%, NLA up 384% to 103,200 sqm), 5 Toh Guan Road East (64.8%, NLA 46,972 sqm), Summerville Logistics Center, Charleston (9.0%) and 27 IBP (19.0%, NLA up 120% to 20,095 sqm).
Three bullets above a table with completion date, previous occupancy, previous and new NLA, increase and committed occupancy
Section divider for Capital Management.
Section divider with large section number and title on a terracotta/peach background, CapitaLand Ascendas REIT logo bottom left, and decorative circles
As at 30 Sep 2026 versus 30 Jun 2026: aggregate leverage 41.8% vs 39.7%; interest coverage ratio 3.4x vs 3.5x (sensitivity 3.1x for a 10% EBITDA decrease, 2.7x for a 100 bps rate rise); weighted average all-in debt cost 3.4% vs 3.5%; debt tenure 2.6 vs 2.5 years; fixed rate debt 70.1%; net debt/annualised EBITDA 9.3x vs 8.6x; unencumbered properties 99.6%. Moody's A3 rating cited. Detailed footnotes.
Bullets on the left; metric table with two period columns on the right; long footnote list
Average debt maturity 2.6 years, longest maturing FY 2034; green financing of S$3.0 billion is about 33% of borrowings. Stacked bars show borrowings due by year (FY 2026 S$1,865 million (22%), FY 2027 726, FY 2028 1,223, FY 2029 1,330, FY 2030 967, FY 2031 1,416, FY 2032 815, FY 2034 300) split by revolving credit facilities, committed loans and medium term notes; donut shows financial resources mix 51%, 27% and 22%.
Stacked bar chart with leaf icons for green debt, donut chart at top right, legend and footnotes
About 73% natural hedge for overseas investments. Paired bars of AUM versus borrowings: AUD 62% (A$2.5b vs A$1.6b), USD 69% (US$1.7b vs US$1.2b), GBP 69% (GBP 0.7b vs 0.5b), EUR 100% (EUR 0.4b each), JPY 98% (JPY 82.0b vs 80.9b).
Five shaded currency panels each with two bars (AUM vs borrowings) and percentage headers
About 70% of borrowings are fixed rate (average term 2.9 years). A 50 bps rise on variable debt reduces distribution by S$11.9 million or 0.26 cents DPU; S$447 million due for refinancing in FY 2026, with a 50 bps rise costing S$2.2 million or 0.05 cents DPU. Two sensitivity tables cover +50 to +200 bps.
Two side-by-side columns, each with bullets and a four-row sensitivity table
Section divider for Portfolio Management.
Section divider with large section number and title on a terracotta/peach background, CapitaLand Ascendas REIT logo bottom left, and decorative circles
Portfolio AUM of S$20.7 billion as at 30 Sep 2026: Singapore S$13.8 billion (66%), Australia S$2.3 billion (11%), United States S$2.2 billion (11%), UK/Europe S$1.9 billion (9%), Japan S$0.6 billion (3%). 236 properties; multi-tenant buildings 70.0% of AUM.
Country list on the left, donut chart with legend lines on the right
Business Space and Life Sciences 43% (S$8.8 billion; Business Space 34%, Life Sciences 9%), Logistics 27% (S$5.5 billion), Industrial and Data Centres 30% (S$6.4 billion; Industrial 18%, Data Centres 12%). Portfolio steered towards digitalisation and e-commerce demand.
Text and segment list on the left, segment donut chart on the right
Tenant industries by monthly rental income: Logistics and Supply Chain Management 13.5%, Data centres 12.6%, Engineering 11.7%, Biomedical Sciences 9.6%, Electronics 9.3%, ICT 7.2%, Government 6.7%, and more than 20 industries in total. 67.4% of customers are from Technology (44.3%), Logistics and Life Sciences.
Horizontal bar chart of 24 industries on the left; pie chart callout on the right
1,829 tenants; top 10 customers account for 18.2% of monthly gross revenue; weighted average security deposit 4.9 months. Top customers: SEA Group 3.2%, Global Technology Company 2.2%, DSO National Laboratories 2.0%, Toll 1.9%, DHL 1.8%, Global Technology Company 1.8%, Stripe 1.7%, Entserv UK 1.3%, Seagate Singapore 1.2%, DBS Bank 1.1%.
Three KPI icon blocks across the top and a column chart of top 10 customers below
Occupancy at Sep-26 vs Jun-26 vs Sep-25: Singapore 90.9% / 90.1% / 90.4% (+0.8 ppt QoQ); United States 82.3% / 80.9% / 85.3% (+1.4 ppt); Australia 91.1% / 91.1% / 94.8%; UK/Europe 96.3% / 93.1% / 98.8% (+3.2 ppt); Japan 100.0%; Total portfolio 90.1% / 89.1% / 91.3% (+1.0 ppt). Total GFA 5,790,876 sqm.
Clustered column chart by region with QoQ change arrows above and GFA row below
Occupancy up 0.8 ppt QoQ to 90.9% thanks to fully occupied new acquisitions and higher logistics occupancy. Same-store 90.3%; recent investments and redevelopments 94.8%; Singapore MTB occupancy 88.9% (30 Jun 2026: 87.7%). GFA 3,496,183 sqm.
Commentary bullet on left; three-period table on right; long footnotes on property changes
Occupancy up 1.4 ppt QoQ to 82.3%, driven by logistics: 13144 South Pulaski Road, Chicago (100% vs 78.8%), Summerville Logistics Center, Charleston (9.0% vs 0%), North Topping, Kansas City (100% vs 77.5%). Same-store 85.6%; GFA 886,121 sqm.
Bullets with sub-bullets on left; table on right
Occupancy stable at 91.1% (Sep 2025: 94.8%); GFA 780,234 sqm; same-store 91.1%.
Single bullet left, three-period table right
Occupancy healthy at 96.3% (Jun 2026: 93.1%; Sep 2025: 98.8%); same-store 95.5%; GFA 607,269 sqm; includes six Grade A logistics properties in Spain acquired 27 Feb 2026.
Single bullet left, table right with footnotes
New demand by gross rental income in 3Q 2026. Singapore: Lifestyle, Retail and Consumer Products 24.6%, Government and IO/NGOs/NPOs 23.5%, Financial and Professional Services 13.5%, Engineering 11.7%, IT and Data Centers 7.0%. Overseas: Logistics and Supply Chain Management 39.9%, Engineering 24.4%, Financial and Professional Services 13.6%, Education and Media 13.2%.
Two horizontal bar charts, Singapore on top and Overseas below, colour-coded by industry group
Average portfolio rental reversion of renewed leases was 9.9% in 3Q 2026 and 9.0% for 9M 2026. By country 3Q 2026: Singapore 4.3%, US 6.4%, Australia 32.5%, UK/Europe no renewals; total 9.9% vs 5.2% (2Q 2026) and 7.6% (3Q 2025). FY 2026 reversion expected to remain positive in the high single-digit range.
Bullets left, hierarchical table by country and segment across three quarters
Portfolio WALE by gross revenue remained at 4.1 years at 30 Sep 2026: Singapore 3.8, US 4.0, Australia 3.5, UK/Europe 4.7, Japan 13.5.
One bullet left, simple two-column table right
WALE 4.1 years; 6.6% of gross rental income due for renewal in rest of FY 2026; expiries FY27 19.9%, FY28 18.1%, FY29 13.7%, FY30-FY48 41.7%. New leases signed in 9M 2026 had a 3.0-year average term and 4.1% of gross revenue. Remaining FY 2026 expiries by segment and geography (Singapore 84.8%).
Bullets, stacked column chart (single vs multi-tenant) and two donut charts at right
Section divider for Sustainability.
Section divider with large section number and title on a terracotta/peach background, CapitaLand Ascendas REIT logo bottom left, and decorative circles
Green-certified properties 75% by GFA (169 properties at Q3); green lease coverage 69% of NLA; 12 more Singapore properties with solar panels in 2026 (42 total), solar generation estimated at 35 GWh for FY 2026, enough for over 8,200 four-room HDB flats; green financing about S$3 billion, 33% of borrowings.
Dashboard of five bordered tiles with big figures and mini bar charts, plus two property photos
Section divider for Market Outlook.
Section divider with large section number and title on a terracotta/peach background, CapitaLand Ascendas REIT logo bottom left, and decorative circles
Per the IMF, global growth is projected to slow to 3.1% in 2026 from 3.5% in 2025, reflecting a drawn-out war in the Middle East and trade tensions, offset by AI-driven technology momentum.
Heading with icon and a single text card
3Q 2026 GDP grew 5.4% YoY (2Q: 6.2%); inflation 2.2% in Sep 2026; MAS kept policy unchanged in Oct 2026. CLAR SG portfolio S$13.8 billion, 66% of total, with continued redevelopments, AEIs and divestments planned.
Two left cards (growth; inflation and rates) and one orange right card for the CLAR portfolio
2Q 2026 GDP up 2.2% annualised; IMF expects 2.3% for 2026; core CPI 2.6%; Fed held the funds rate at 3.75%-4.00%. CLAR US portfolio S$2.2 billion, WALE 4.0 years, no leases due in the rest of FY 2026.
Same two-plus-one card layout
2Q 2026 economy grew 0.4% QoQ; IMF 2026 GDP 1.9%; CPI 4.3%; RBA raised cash rate 25 bps to 4.60% in Sep 2026. CLAR AU portfolio S$2.3 billion, occupancy 91.1%, WALE 3.5 years.
Same two-plus-one card layout
UK grew 0.5% QoQ in 2Q 2026, Bank Rate held at 3.75%; EU grew 0.7% QoQ, 2026 growth forecast 1.1%, ECB raised rates 25 bps in Sep 2026. CLAR UK/EU portfolio S$1.9 billion in logistics and data centres.
UK and EU cards on top with flag icons, full-width orange portfolio card below
2Q 2026 economy grew 0.4% QoQ; 2026 GDP forecast 0.9%; CPI 2.1% in Sep 2026; BOJ lifted policy rate 25 bps to 1.25%. CLAR JP portfolio S$0.6 billion: 49% of a Tier III hyperscale data centre in Greater Osaka with a 13.5-year WALE.
Two left cards and one orange right card
IMF sees uneven global prospects with downside risks from the Middle East. CLAR's S$20.7 billion portfolio spans five developed geographies anchored in Singapore, aligned with knowledge, innovation, digital and e-commerce economies.
Two-column layout: Global Environment card and CLAR Portfolio orange card
Section divider for Appendix.
Section divider with large section number and title on a terracotta/peach background, CapitaLand Ascendas REIT logo bottom left, and decorative circles
CLAR vs JTC statistics at 30 Sep 2026: Business Space and Life Sciences 80.2% vs 77.2%; Industrial and Data Centres 93.7% vs 90.3%; Logistics 97.8% vs 89.7%.
Clustered column chart with two series
Rental index of all Singapore industrial property reached 113.80 in 2Q 2026. Average gross rents per sq ft per month (CBRE): Business Park (City Fringe) $6.15, Business Park (Rest of Island) $3.55, High-Specifications $3.54, Logistics $1.91, Light Industrial $1.81.
Two line charts: a long-run index from 2000 and segment rents from 2015
Potential new supply of 3.59 million sqm (6.6% of existing stock) over the next four years, about 83% pre-committed; island-wide occupancy 89.1% as of 30 June 2026, +0.2 ppt QoQ. Table by sector and year (2026 264 thousand sqm, 2027 883, 2028 1,135, >2029 1,309).
Two bullets over a table of supply by sector and year with pre-commitment rows
Projects above 50,000 sqm with expected completion 2027-2031 include Micron North Coast Drive additions (279,980 and 632,830 sqm), STA Pharmaceutical, AstraZeneca, Malkoha and SSCK; total 1,617,140 sqm, 85% pre-committed.
Table of completion year, project, developer, location, GFA and pre-commitment
Six logistics projects from 2026 to 2029 totalling 621,920 sqm, 81% pre-committed, including PSA Corporation Tuas South Ave 5 (230,690 sqm) and CLAR's own Clementi Loop warehouse (58,820 sqm, 0%).
Table of projects with developer, location, GFA and pre-commitment
Purchase consideration S$133.9 million (1.5% discount to valuation), total cost S$136.5 million, vendor Hup Hin Transport; 100% occupied, WALE 5 years, 2.0% escalation, triple-net; NPI yield 6.6%; DPU accretion 0.2% or 0.033 cents. Seven-storey ramp-up logistics property in Tuas, completed 2021.
Fact table left, aerial photo and highlighted callout right
Purchase consideration S$504.2 million (2.7% discount to valuation), total cost S$536.9 million, seller and master lessee Toll; GFA 165,711 sqm, NLA 197,800 sqm; WALE 13.4 years with 2.5% annual escalation; NPI yield 6.9%; sale and leaseback on a 12-year absolute triple-net lease.
Fact table left, location map showing about 15 minutes to Changi Airport, building photo and callout
Six acquisitions totalling S$1,783.7 million: DHL Canal Winchester 94.5, six Grade A logistics properties in Spain 185.4, Ascent (50%) 245.0, Osaka Data Centre 1 (49%) 620.7, 5 Tuas Avenue 5 133.9, 25 Loyang Crescent 504.2.
Numbered table with total row and segment legend
Sale price S$200.4 million, a 32% premium to valuation (S$151.8 million) and double the 2005 purchase price (S$100.0 million); 10-storey data centre, GFA 35,456 sqm; FY 2025 pro forma impact -S$10.0 million NPI and -0.203 cents DPU; completion 4Q 2026.
Fact table left, building photo right
Singapore WALE 3.8 years; 7.9% of gross rental income due in FY 2026; FY27 20.9%, FY28 20.5%, FY29 14.1%, FY30-FY48 36.6%. Donuts show segment mix of FY 2026 and FY 2027 expiries.
Stacked column chart with two donut charts
US WALE 4.0 years; nothing due in FY 2026; FY27 32.7%, FY28 10.8%, FY29 8.3%, FY30-FY40 48.2%. Donut breaks FY 2027 expiries by segment and city (San Francisco, San Diego, Chicago and others).
Stacked column chart and nested donut
Australia WALE 3.5 years; no renewals in FY 2026; FY27 13.6%, FY28 23.5%, FY29 16.1%, FY30-FY37 46.8%. FY 2027 expiries split by Brisbane 72.1%, Sydney 26.7%, Melbourne 1.2%.
Stacked column chart and nested donut
UK/Europe WALE 4.7 years; 11.5% of gross rental income due in the rest of FY 2026; FY27 7.4%, FY28 7.7%, FY29 18.4%, FY30-43 55.0%. Donuts split FY 2026 and FY 2027 expiries between UK and the Netherlands, logistics and data centres.
Stacked column chart with two nested donuts
Definitions of key acronyms (AUM, DPU, EBITDA, GFA, ICR, MTB, NLA, WALE, ppt, QoQ, YoY, etc.) and key currencies (AUD, EUR, GBP, JPY, SGD, USD).
Three-column acronym list and a currency list
Closing slide with investor relations contact for CapitaLand Ascendas REIT Management Limited and website capitalandascendasreit.com.
Full-bleed blue-tinted night photograph of Galaxis with 'Thank You' and contact block
Perguntas comuns sobre este slide e o conteúdo da apresentação subjacente.
It is CapitaLand Ascendas REIT's (CLAR) 60-slide business update for the third quarter of 2026, dated 29 October 2026 and lodged with SGX. It covers acquisitions, divestments, development projects, capital management, portfolio performance, sustainability and market outlook.
It is an attachment to CLAR's announcement on the Singapore Exchange (SGX). Singapore REITs on half-yearly reporting publish a business update rather than full results for Q1 and Q3, so this deck is the quarterly update.
3Q 2026 acquisitions of S$638.1 million (S$ = Singapore dollars) and divestments of S$281.7 million; portfolio occupancy 90.1% and rental reversion +9.9%; aggregate leverage 41.8%; cost of debt 3.4%; portfolio AUM of S$20.7 billion.
Occupancy is the share of leasable space that is rented. Rental reversion is the percentage change in rent when a lease is renewed. Aggregate leverage is total borrowings as a share of total assets. DPU is distribution per unit, the cash paid out per unit held.
3Q 2026 and 9M 2026 (nine months to 30 September 2026), with balance sheet and occupancy figures as at 30 Sep 2026 compared with 30 Jun 2026 and 30 Sep 2025. FY 2025 pro forma figures are used for divestment impact.
Singapore (66% of AUM), Australia, the United States, UK/Europe and Japan, including 5 Tuas Avenue 5, 25 Loyang Crescent, Hawleys Lane and 29 International Business Park.
The deck can be viewed page by page as images, downloaded as a PDF and downloaded as an editable PPTX file.
Yes, the investor-update structure (highlights, KPI cards, charts, property fact sheets, outlook) works as a layout reference. Logos, trademarks and figures belong to CapitaLand Ascendas REIT and should not be reused as your own.

Create Your Own Slides
Turn your ideas into professional presentations in seconds with 2slides AI.
Referencie designs profissionais, escolha seu estilo e gere slides com renderização de texto perfeita. Alimentado por Nano Banana—comece a criar sua apresentação agora.
Seu Agente IA para slides. Economize tempo, brilhe mais rápido com criação inteligente de apresentações.


© 2026 2slides. Todos os direitos reservados.