
Faz parte de Exemplos de apresentações para investidores
Banco Santander 9M'26 (Q3 2026) Earnings Presentation, January-September 2026 results, dated 28 October 2026, filed with the SEC as an exhibit to Form 6-K
Usa a capa desta apresentação como referência de estilo para slides criados a partir do seu próprio conteúdo. Ou escolha qualquer página abaixo para usar o layout dela como referência.
Navegação Rápida
Tags
Compartilhar os slides
Banco Santander 9M'26 (Q3 2026) Earnings Presentation, January-September 2026 results, dated 28 October 2026, filed with the SEC as an exhibit to Form 6-K
Visualização detalhada de cada página de slide, incluindo layout, conteúdo principal e elementos visuais.
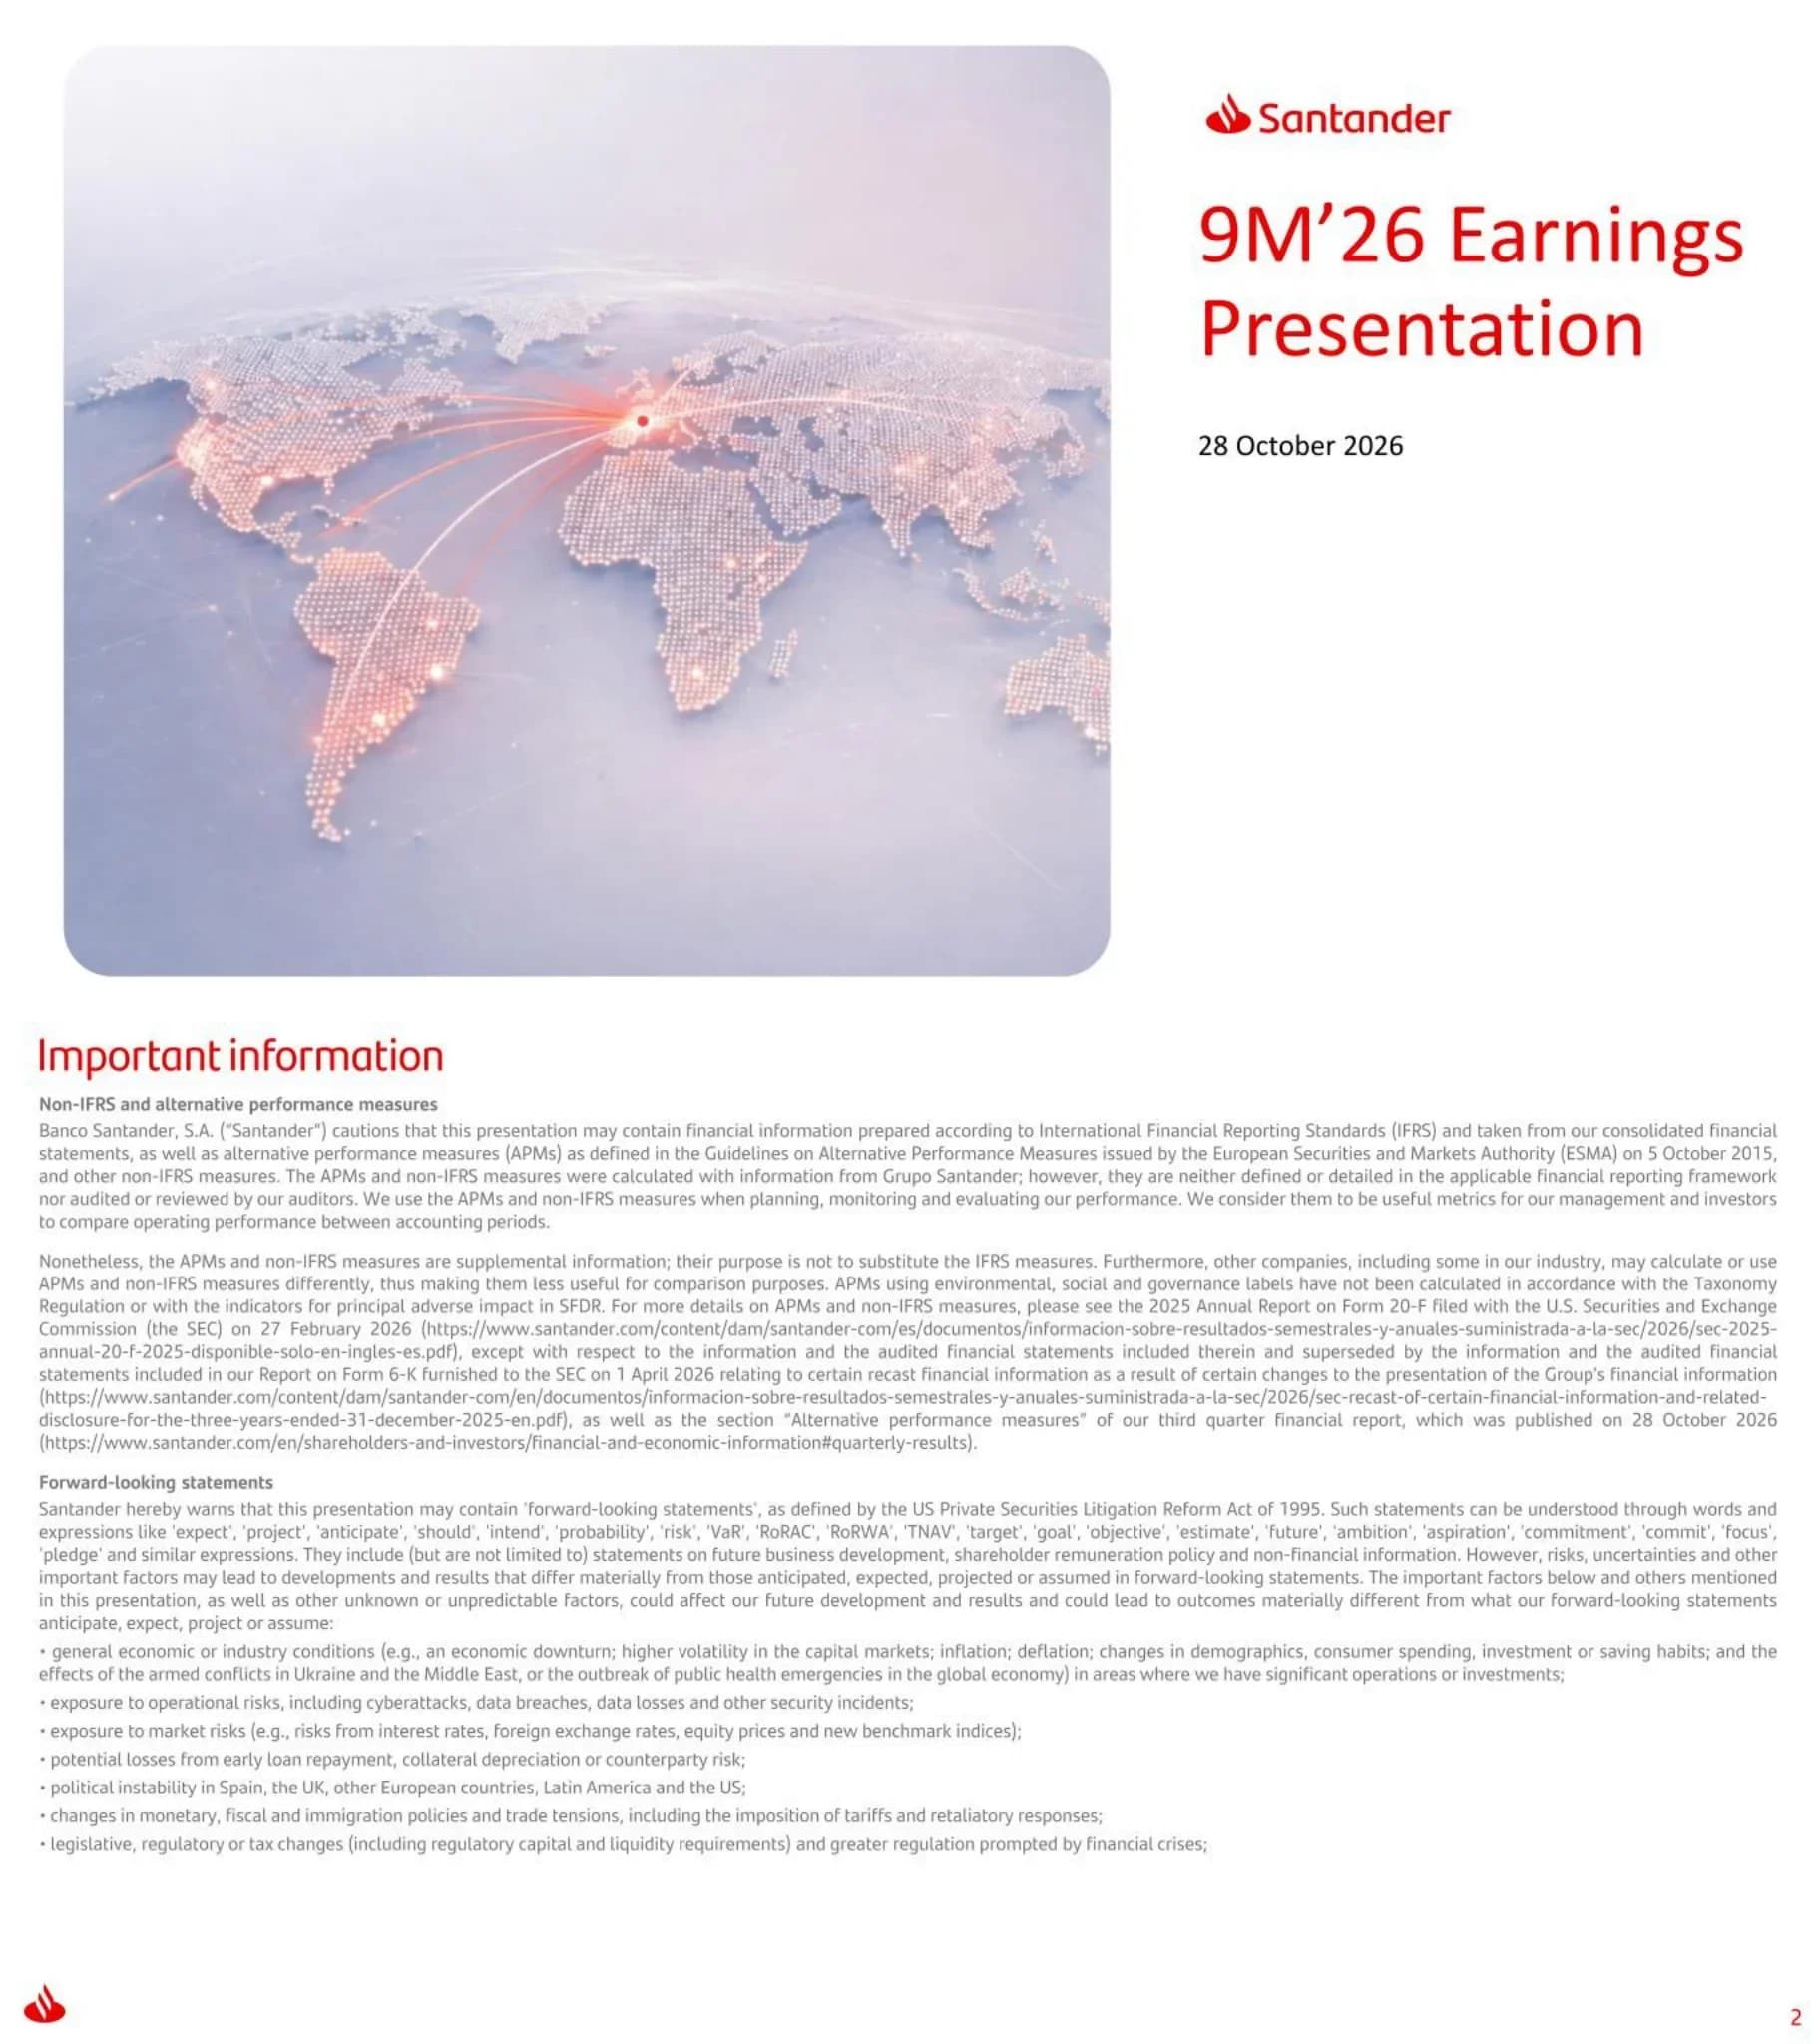
Title slide of Banco Santander's 9M'26 Earnings Presentation dated 28 October 2026.
Left rounded photo of a dotted world map with red connecting lines converging on Europe; right column with Santander logo, red title and date.
Legal disclaimer on non-IFRS and alternative performance measures (APMs) and the start of the forward-looking statements, listing risk factors such as economic conditions, inflation, market risks, cyberattacks and political instability. Small print.
Dense text page with bold red-free section headings and bullet list.
Continues forward-looking statements (climate, sustainability information, liquidity and funding), then no offer or solicitation, past performance does not indicate future outcomes, and third-party information disclaimers.
Dense text page with bold section labels and bullets.
Agenda with four sections: 1 9M'26 Highlights / Progress on our strategy (highlighted in red), 2 Group review, 3 Final remarks, 4 Appendix.
Four rounded cards in a row on light grey background; active card solid red.
Q3'26 underlying profit EUR 3.8bn (+19%) and 9M'26 underlying profit EUR 11.2bn (+16%); attributable profit EUR 3.4bn and EUR 12.4bn. Efficiency 42.6% (-2.8pp), underlying RoTE 16.0% (+1.1pp), cost of risk 1.16% (+3bps), CET1 12.7%, underlying EPS +21% (statutory +25%), TNAVps + DPS +11%. 17 million new customers YoY.
Four horizontal bands each with a message on the left and two red KPI tiles on the right.
Group P&L in EUR million: NII 34,614 (31,599), net fee income 10,349 (9,462), total revenue 46,807 (43,243), total costs -19,925, net operating income 26,882, LLPs -10,060, underlying attributable profit 11,176 (9,624, +16% current, +14% constant), attributable profit 12,405. Extra columns exclude TSB and Webster. Box explains items excluded from underlying profit.
Large P&L table with current/constant % columns plus grey ex-TSB and Webster columns; red outline note box below.
Formula slide: scale, customer focus and diversification plus customer growth, ONE Transformation and network businesses equals revenue +5% and costs -2% every year, underlying RoTE +1.1pp and value creation +11%. Webster acquisition completed; AI business value EUR 194mn in 9M'26; front book RoTE 21%.
Equation-style graphic with grey and orange tiles and three red/pink banner rows at the bottom.
Active customers 111mn (+10mn, c.125mn in 2028); customers 189mn (+17mn, >210mn in 2028); fees per active customer EUR 129 (+2%, c.135 in 2028); cost per active customer EUR 249 (-5%, c.220 in 2028); revenue +5% and costs -2%. Gravity and One App serve 54% of retail customers (>80% in 2028).
Four-quadrant grey panels around a central circular cycle graphic with red nodes and a bottom pill.
Efficiency ratio walk from 45.3% in 2025 to 42.6% in 9M'26 (2028 target c.36%): ONE Transformation -1.8pp (c.-3pp target), AI -0.2pp (c.-1pp), Global Tech -0.4pp (c.-2pp), network businesses -0.6pp (c.-1pp), announced bolt-ons +0.2pp (c.-2pp). AI business value EUR 194mn.
Waterfall chart of orange steps between grey 2025 and red 9M'26 bars, with five columns of initiative bullets above.
9M'26 table by business (revenue EUR bn / efficiency / underlying profit EUR bn / RoTE / FY'28 RoTE target): Retail 26.3 / 39.9% / 6.4 / 17.7% / >21%; Openbank 10.1 / 40.4% / 2.5 / 18.0% / c.16%; CIB 6.9 / 42.6% / 2.4 / 19.2% / >20%; Wealth 3.2 / 34.6% / 1.7 / 58.2% / >60%; Payments 1.2 / 85.1% / 0.1 / 34.0% / c.45%; Group 46.8 / 42.6% / 11.2 / 16.0% / >20%.
Scorecard table with network businesses bracket and a highlighted RoTE column.
Retail 9M'26: loans EUR 697bn (+16%, +3% ex M&A), deposits EUR 711bn (+16%), CoR 1.20%, efficiency 39.9% (-2.9pp), profit EUR 6,445mn (+12%), RoTE 17.7%. Fees EUR 5,084mn (+8%), revenue EUR 26,277mn (+6%), costs EUR 10,497mn (-1%).
Left execution bullets, right KPI tiles, bottom small bar charts for operating targets and operational leverage.
Openbank 9M'26: loans EUR 231bn (+7%), deposits EUR 177bn (+37%), CoR 2.10%, efficiency 40.4%, PBT EUR 2,544mn (+13% ex Motor Finance), operating profitability 18.0%. Total customers 32.2mn (+23%); revenue EUR 10,062mn (+5%), costs EUR 4,066mn (-3%). Motor Finance and end of US EV incentives affected profit.
Same Retail template in burgundy/purple accent.
Santander US 9M'26: loans EUR 175bn (+59%; EUR 125bn ex Webster), deposits EUR 158bn (+84%), CoR 1.39%, efficiency 44.7%, profit EUR 1,514mn (+32%), RoTE 12.6% (+2.1pp). Loan-to-deposit ratio from 113% to <100%; RoTE path 10% in 2025 to 15% in 2028 standalone and c.18% with Webster; c.$800mn cost synergies.
KPI tiles, funding profile bar charts and a RoTE improvement path chart with green uplift blocks.
CIB 9M'26: loans EUR 178bn (+28%), deposits EUR 150bn (+12%), CoR 0.32%, efficiency 42.6% (-3.8pp), profit EUR 2,433mn (+15%), RoTE 19.2%. Gross collaboration revenue EUR 2,196mn (+7%); fees EUR 1,995mn (+7%); costs EUR 2,956mn (+5%).
Retail template in teal accent.
Wealth 9M'26: AuMs EUR 588bn (+11%), CAL (PB) EUR 388bn (+13%), gross written premiums EUR 10.0bn (+20%), efficiency 34.6%, profit EUR 1,651mn (+19%), RoTE 58.2%. Distribution fees EUR 1,978mn (+9%); Private Banking revenue EUR 1,870mn (+4%); Insurance and AM Solutions EUR 1,272mn (+26%).
Retail template in dark teal accent.
Payments 9M'26: Getnet TPV EUR 198bn (+9%), Getnet Platforms 14bn transactions (3x), Ebury active customers 29k (+25%). Transactions 25.5bn (+37%), cost per transaction 1.5 EUR cents (-39%); revenue EUR 1,175mn (+15%), EBITDA margin 34.0% (+2.4pp), profit EUR 105mn (2x).
Retail template in green accent.
CET1 from 13.5% (Dec-25) to 12.7% (Sep-26): M&A -1.63, pro forma ex M&A 11.8, net organic generation +0.75, regulatory and models +0.20, markets and others -0.09. Underlying RoTE 14.9% to 16.0%; TNAVps + cash DPS EUR 5.56 to 6.17 (+11%). Share buybacks: c.EUR 9bn delivered of the at least EUR 10bn 2025-26 commitment.
Three panels: CET1 waterfall, RoTE bars, TNAVps bars, with red delivery bar at bottom right.
Agenda with section 2 'Group review' highlighted in red.
Four rounded cards; second card red.
Same 9M'26 P&L table as page 6 (revenue EUR 46,807mn, underlying attributable profit EUR 11,176mn) plus a line chart of quarterly underlying profit from Q1'25 EUR 3,165mn to Q3'26 EUR 3,848mn (+19% YoY, +2% QoQ); constant euro series reaching EUR 3,827mn (+14% YoY).
Left P&L table, right grey panel with two quarterly series charts.
Total revenue constant EUR: Q3'26 EUR 15,866mn (+8% YoY); 9M'26 EUR 46,807mn (+7%). Walk from 9M'25 EUR 43,927mn: Retail +1,466, Openbank +459, CIB +840, Wealth +285, Payments +150, Corporate Centre -322. c.95% of revenue is customer related.
Quarterly bar chart and waterfall on the left; two grey commentary panels (Group, Detail by business) on the right.
NII constant EUR: Q3'26 EUR 11,833mn (+11% YoY); 9M'26 EUR 34,614mn (+8%). NIM line from 2.65% to 2.60% in Q3'26; 9M'26 NIM flat YoY. c.90% of NII from Retail and Openbank. Walk from EUR 32,093mn: Retail +1,397, Openbank +417, CIB +894.
NIM line over NII bar chart, waterfall below, commentary panels right.
Net fee income constant EUR: Q3'26 EUR 3,478mn (+7% YoY); 9M'26 EUR 10,349mn (+7%) from EUR 9,644mn: Retail +362, Openbank +10, CIB +133, Wealth +138, Payments +50, CC +12. Detail by business bullets.
Quarterly bars, waterfall, and grey commentary panel.
Group revenue +7%, total costs 0% (-5% in real terms), efficiency 12M rolling falling from 46.5% to 43.2%, NOI up 12% to EUR 9,194mn in Q3. Retail and Openbank are c.75% of Group costs; combined efficiency 40.1%, revenue EUR 36,339mn (+6%), costs EUR 14,563mn (-2%).
Left stacked quarterly charts, right cost commentary and Retail and Openbank pie and bars.
CoR rose from 1.12% (Q1'25) to 1.16% (Q3'26); LLPs EUR 3,463mn in Q3 (+10%). Table Sep-25/Jun-26/Sep-26: NPL ratio 2.91%/2.93%/2.90%, coverage 67%/64%/64%, Stage 1 EUR 1,155bn, Stage 2 EUR 95bn, Stage 3 EUR 39bn. Excluding Argentina CoR 1.09%.
CoR line, LLP bars, credit metrics table and commentary panels.
CET1 from 14.0% (Jun-26) to 12.7% (Sep-26) with Webster -1.47, profit +0.59, ordinary capital distribution -0.33; +19bps net organic generation in the quarter (+75bps in 9M'26); 2026 target 12.8-13%. Front book RoTE 21%, asset rotation c.EUR 4.5bn capital generated, 90% of RWAs with RoRWA above CoE.
Waterfall chart on left, three-metric panel on right, long footnote on distribution policy.
Agenda with section 3 'Final remarks' highlighted.
Four rounded cards; third card red.
9M'26 delivery vs 2026 targets: revenue +5% ex TSB and Webster (mid-single digit), costs -2% (down), underlying profit EUR 11.0bn ex TSB and Webster (up vs EUR 14.1bn in 2025), CET1 12.7% (12.8-13%), TNAVps + cash DPS +11% (at least double digit).
Left bullet card and right table of delivery chevrons leading to target tiles.
CET1 c.13% (12-13% operating range); profit >EUR 20bn and RoTE >20% by 2028; shareholder payout 50% and cash DPS >x2 by 2028; reinvesting capital organically at >20% RoTE; TNAVps + DPS accelerating to high teens and EPS double-digit annual growth 2026-28; cash dividend payout to 35% from 2027.
Four quadrants around a central circular graphic.
Agenda with section 4 'Appendix' highlighted.
Four rounded cards; fourth card red.
Appendix list: 2028 Investor Day targets summary (highlighted), Group P&L QoQ variations, loans by global business, detail by global business, detail by country, balance sheet and capital management, reconciliation, glossary and additional notes.
Rounded pink panel with eight list items and Santander flame.
Table 2025 / 9M'26 / 2028 targets: underlying profit EUR 13.2bn / 11.2bn / >EUR 20bn; RoTE 15.2% / 16.0% / >20%; underlying EPS +17% / +21%; payout 50%; customers 174mn / 189mn / >210mn; active customers 102mn / 111mn / c.125mn; fees per active customer 130 / 129 / c.135; cost per active customer 264 / 249 / c.220; efficiency 45.3% / 42.6% / c.36%; CET1 13.5% / 12.7% / c.13%; RoTE new business 22% / 21% / >20%; TNAVps + cash DPS +14% / +11% / high teens.
Grouped table by theme (Profitability, Customers, ONE Transformation, Capital, Value creation).
Appendix list with 'Group P&L QoQ variations including and excluding M&A' highlighted.
Rounded pink panel with list.
Q3'26 vs Q2'26 Group P&L variations (current/constant, with and without TSB and Webster): revenue +2%/+1% (-1%/-2% ex), costs -0%/-1%, underlying attributable profit +2% (-1% ex). Quarterly series ex TSB and Webster: NII EUR 11,220mn (-2% QoQ), fees EUR 3,421mn, revenue EUR 15,196mn, costs EUR 6,340mn, LLPs EUR 3,407mn.
Left variation table and right grey panel with five quarterly line charts.
Appendix list with 'Loans by global business' highlighted.
Rounded pink panel with list.
Total loans EUR 1,143bn (+16%, +6% ex M&A): Retail 61% (+16%, +3% ex M&A), Openbank 20% (+7%, +3% ex Webster), CIB 16% (+28%), Wealth 3% (+13%). More than 80% of the loan portfolio is Retail and Openbank.
Single stacked column with growth bubbles beside it and commentary panel.
Appendix list with 'Detail by global business' highlighted.
Rounded pink panel with list.
Key data: loans EUR 697bn (+16%), deposits EUR 711bn (+16%), mutual funds EUR 125bn (+14%), efficiency 39.9%, CoR 1.20%, RoTE 17.7%. Underlying P&L: Q3'26 revenue EUR 9,141mn, 9M'26 revenue EUR 26,277mn, underlying profit EUR 2,321mn in Q3 and EUR 6,445mn in 9M (+12.5%).
KPI tiles, P&L table and highlights panel.
Retail Spain: loans EUR 159bn (+2%), deposits EUR 240bn (+5%), efficiency 31.2%, 9M'26 PBT EUR 3,220mn (+29%). Retail UK: loans EUR 277bn (+22%), deposits EUR 263bn (+25%), efficiency 51.0%, 9M'26 PBT EUR 1,699mn.
Two side-by-side country panels with KPI tiles, small P&L tables and bullets.
Retail Mexico: loans EUR 40bn (+3%), deposits EUR 40bn (+6%), efficiency 39.6%, 9M'26 PBT EUR 1,318mn (+6%). Retail Brazil: loans EUR 70bn, deposits EUR 68bn (+10%), efficiency 43.1%, 9M'26 PBT EUR 961mn (-17%).
Two side-by-side country panels.
Key data: loans EUR 231bn (+7%), deposits EUR 177bn (+37%), new lending EUR 67bn (+9%), efficiency 40.4%, CoR 2.10%, RoTE 9.0%. 9M'26 revenue EUR 10,062mn, underlying profit EUR 1,407mn (-9.3%). Motor Finance, Webster integration and the end of US EV incentives affected profit.
KPI tiles, P&L table and highlights.
Openbank Europe: loans EUR 147bn (+3%), deposits EUR 80bn, efficiency 44.5%, 9M'26 PBT EUR 1,090mn (-10.8%, +9% ex Motor Finance). Openbank US: loans EUR 60bn (+19%), deposits EUR 96bn (+107%), efficiency 40.1%, PBT EUR 923mn (+43.5%).
Two side-by-side panels.
Key data: loans EUR 178bn (+28%), deposits EUR 150bn (+12%), efficiency 42.6%, CoR 0.32%, RoTE 19.2%. 9M'26 revenue EUR 6,936mn (+13.8%), underlying profit EUR 2,433mn (+15%); Q3'26 profit EUR 691mn. Covers GTB, GB and GM.
KPI tiles, P&L table, highlights.
Net new money (PB) EUR 17.2bn, net sales (AM) EUR 7.9bn, GWP EUR 10.0bn (+20%), AuMs EUR 588bn (+11%), efficiency 34.6%, RoTE 58.2%. 9M'26 revenue EUR 3,198mn, underlying profit EUR 1,651mn (+18.8%), contribution to profit EUR 2,968mn.
KPI tiles, P&L table, highlights.
Getnet TPV EUR 198bn (+9%), Getnet Platforms 14bn transactions (3x), Ebury 29k active customers (+25%), EBITDA margin 34.0% (+2.4pp). 9M'26 revenue EUR 1,175mn, underlying profit EUR 105mn (+147%); Q3'26 profit EUR 27mn.
KPI tiles, P&L table, highlights.
Corporate Centre underlying P&L (EUR mn) 9M'26 vs 9M'25: NII -544 vs -364, gains/losses on financial transactions -704 vs -135, total costs -298 vs -285, underlying profit -865 vs -1,059. Highlights on funding costs, FX hedges and improved LLPs.
P&L table left, highlights panel right.
Appendix list with 'Detail by country' highlighted.
Rounded pink panel with list.
Spain: loans EUR 256bn (+10%), deposits EUR 331bn, efficiency 34.1%, CoR 0.43%, RoTE 25.6%, 9M'26 underlying profit EUR 3,695mn (+14.3%). UK: loans EUR 279bn (+21%), deposits EUR 270bn, efficiency 50.6%, CoR 0.12%, RoTE 12.8%, underlying profit EUR 1,282mn.
Two country panels.
Portugal: loans EUR 43bn, deposits EUR 43bn, efficiency 28.1%, CoR 0.06%, RoTE 29.8%, underlying profit EUR 712mn (-6.9%). US: loans EUR 175bn (+59%), deposits EUR 158bn (+84%), efficiency 44.7%, CoR 1.39%, RoTE 12.6%, underlying profit EUR 1,514mn (+31.8%).
Two country panels.
Mexico: loans EUR 53bn (+11%), deposits EUR 48bn, efficiency 40.3%, CoR 2.73%, RoTE 21.2%, underlying profit EUR 1,402mn (+7.3%). Brazil: loans EUR 100bn, deposits EUR 95bn, efficiency 40.1%, CoR 4.25%, RoTE 13.9%, underlying profit EUR 1,596mn (-5.0%).
Two country panels.
Chile: loans EUR 43bn (+10%), deposits EUR 31bn (+20%), efficiency 31.1%, CoR 1.28%, RoTE 20.3%, underlying profit EUR 648mn (+19.5%). Argentina: loans EUR 11bn, deposits EUR 12bn, efficiency 38.5%, CoR 10.80%, RoTE 16.1%, underlying profit EUR 341mn.
Two country panels.
Appendix list with 'Balance sheet and capital management' highlighted.
Rounded pink panel with list.
SREP capital requirements and MDA (Sep-26): regulatory requirement 14.12%, Group ratio 17.01% (CET1 12.69%, AT1 1.55%, Tier 2 2.78%), 2026 target >16%. Distance to MDA 254bps; CET1 management buffer 282bps; minimum CET1 9.86%.
Three stacked columns (requirements, Group ratios, 2026 target) with gap bubbles and three callouts.
Bond portfolios (Sep-26) EUR 182bn: liquidity portfolio EUR 50bn and ALCO IRRBB EUR 132bn; HTC EUR 143bn (79%). By country: Spain 44%, US 16%, Brazil 8%, Mexico 8%, UK 6%, Chile 6%, Portugal 5%, Openbank Europe 4%, rest 3%. HTC&S duration 1.8 years.
Stacked column, donut chart and three callouts.
EUR 42.8bn issued in public markets in 9M'26 by instrument (covered bonds 11.2, senior 17.4, senior non-preferred 11.4, AT1 0.7, Tier 2 1.5) and maturity profile 2026 to >2030 by instrument. Footnotes partly small print.
Left stacked bar chart by country; right four mini maturity bar charts.
Funding plan table (EUR bn): total plan 25-35, issued 33.2; AT1 + Tier 2 plan 1-2.5 issued 1.7; SNP + senior plan 17-23.5 issued 21.6; covered bonds plan 7-9 issued 10.0, by Banco Santander S.A., UK and SHUSA.
Red-header table plus callout on plan assumptions.
TLAC 26.1% of RWAs (requirement 22.5%) and 7.1% of leverage exposure; MREL 40.3% of RWAs (requirement 35.7%), 14.7% of LE, MREL instruments EUR 180.1bn. Distance to M-MDA: EUR 11.2bn (361bps) and EUR 4.0bn (35bps) for TLAC; EUR 20.7bn (464bps) and EUR 35.0bn (286bps) for MREL.
Stacked columns for TLAC and MREL with bottom metric tiles.
Liquidity balance sheet Sep-26 EUR 1,763bn: loans EUR 1,207bn vs customer deposits EUR 1,222bn; HQLAs EUR 346bn (cash EUR 156bn). LCR table by country: Group LCR 145% (Sep-26) vs 154% (Jun-26); Spain 141%, UK 172%, Portugal 134%, US 135%; Group NSFR 124%.
Stacked assets/liabilities columns, HQLA box and LCR/NSFR table.
Appendix list with 'Reconciliation of underlying results to statutory results' highlighted.
Rounded pink panel with list.
EUR mn, January-September 2026: statutory NII 34,545, underlying 34,614; total income 46,713 vs 46,807; net operating income 27,741 vs 26,882; profit attributable to the parent 12,405 (statutory) vs 11,176 (underlying), adjustments -1,229. January-September 2025: 10,337 vs 9,624.
Two-period table with statutory, adjustments and underlying columns.
Appendix list with 'Glossary and additional notes' highlighted.
Rounded pink panel with list.
Three-column list of acronyms, e.g. AuMs assets under management, CET1 common equity tier 1, CoR cost of risk, LLPs loan-loss provisions, NII net interest income, RoTE return on tangible equity, TNAV tangible net asset value, TPV total payment volume, YTD year to date.
Three bullet columns of acronym definitions.
Definitions of underlying RoTE, RoRWA, efficiency, loans, deposits, NPL ratio and coverage, cost of risk, TNAV per share, Group LCR and consolidated LCR. Footnotes not legible at this resolution.
Text sections with headings.
Notes on phased-in CET1 ratio and capital distribution policy (about 50% payout 2026-28; from 2027 around 35% cash dividends and 15% buybacks) and explanation of adjustments for 9M 2026 and 9M 2025, including the EUR 1,895 million Poland disposal gain and EUR 666 million M&A charges. Small print.
Dense text page with numbered notes.
Closing slide with the text Thank you and Santander flame logo.
Centred red pill on white background.
Perguntas comuns sobre este slide e o conteúdo da apresentação subjacente.
It covers Banco Santander's results for the first nine months of 2026 with Q3 2026 detail: group P&L, strategy progress under ONE Transformation, the five global businesses (Retail, Openbank, CIB, Wealth, Payments), country detail, capital, liquidity and funding, plus a reconciliation of underlying to statutory results. The presentation is dated 28 October 2026.
Underlying profit was EUR 3.8bn in Q3'26 (+19%) and EUR 11.2bn in 9M'26 (+16%). Efficiency was 42.6%, underlying RoTE 16.0%, cost of risk 1.16% and CET1 12.7%. Amounts are in euros (EUR), as stated in the deck.
9M'26 is the first nine months of 2026 (January to September). Q3 is the third quarter, July to September 2026.
It is Banco Santander's 9M'26 Earnings Presentation in English, filed with the SEC as an exhibit to Form 6-K. It has 64 slides, rasterised as images from the SEC filing.
The deck is available as a PDF and as slide images on this page. No PowerPoint (PPTX) file is attached.
Yes. It is a good reference for structuring a bank earnings presentation: KPI tiles, waterfall charts, business scorecards and appendix tables. Logos, trademarks and figures belong to Banco Santander and should not be reused as your own.
ONE Transformation, AI deployment, network businesses, the Webster acquisition, customer growth to 189mn customers, and 2028 Investor Day targets such as underlying profit above EUR 20bn and RoTE above 20%.
Yes. The appendix gives results for Spain, the UK, Portugal, the US, Mexico, Brazil, Chile and Argentina, plus Retail by country and Openbank Europe and US.

Create Your Own Slides
Turn your ideas into professional presentations in seconds with 2slides AI.
Referencie designs profissionais, escolha seu estilo e gere slides com renderização de texto perfeita. Alimentado por Nano Banana—comece a criar sua apresentação agora.
Seu Agente IA para slides. Economize tempo, brilhe mais rápido com criação inteligente de apresentações.


© 2026 2slides. Todos os direitos reservados.