
Axon's August 2026 investor presentation (Q2 2026 investor deck) — a 36-slide standing company deck covering the mission to cut gun-related deaths between police and public by 50% by 2033, a $159 billion total addressable market, the Sense–Respond–Resolve product ecosystem spanning TASER devices, body cameras, drones, counter-drone and real-time crime centres, customer proof points across state and local, federal, international and enterprise segments, the Officer Safety Plan subscription ladder from $99 to $569 per user, 2025 revenue of $2.78 billion up 33% with a 25.5% adjusted EBITDA margin, Q2 2026 quarterly revenue of $904 million up 35%, forward indicators including $15.1 billion of future contracted bookings and 126% net revenue retention, raised FY2026 guidance of 32–34% growth, a 2028 target model of $6 billion revenue at a 28% adjusted EBITDA margin, and a six-page appendix of statistical definitions and non-GAAP reconciliations.
Navegação Rápida
Tags
Compartilhar os slides
Axon's August 2026 investor presentation (Q2 2026 investor deck) — a 36-slide standing company deck covering the mission to cut gun-related deaths between police and public by 50% by 2033, a $159 billion total addressable market, the Sense–Respond–Resolve product ecosystem spanning TASER devices, body cameras, drones, counter-drone and real-time crime centres, customer proof points across state and local, federal, international and enterprise segments, the Officer Safety Plan subscription ladder from $99 to $569 per user, 2025 revenue of $2.78 billion up 33% with a 25.5% adjusted EBITDA margin, Q2 2026 quarterly revenue of $904 million up 35%, forward indicators including $15.1 billion of future contracted bookings and 126% net revenue retention, raised FY2026 guidance of 32–34% growth, a 2028 target model of $6 billion revenue at a 28% adjusted EBITDA margin, and a six-page appendix of statistical definitions and non-GAAP reconciliations.
Visualização detalhada de cada página de slide, incluindo layout, conteúdo principal e elementos visuais.
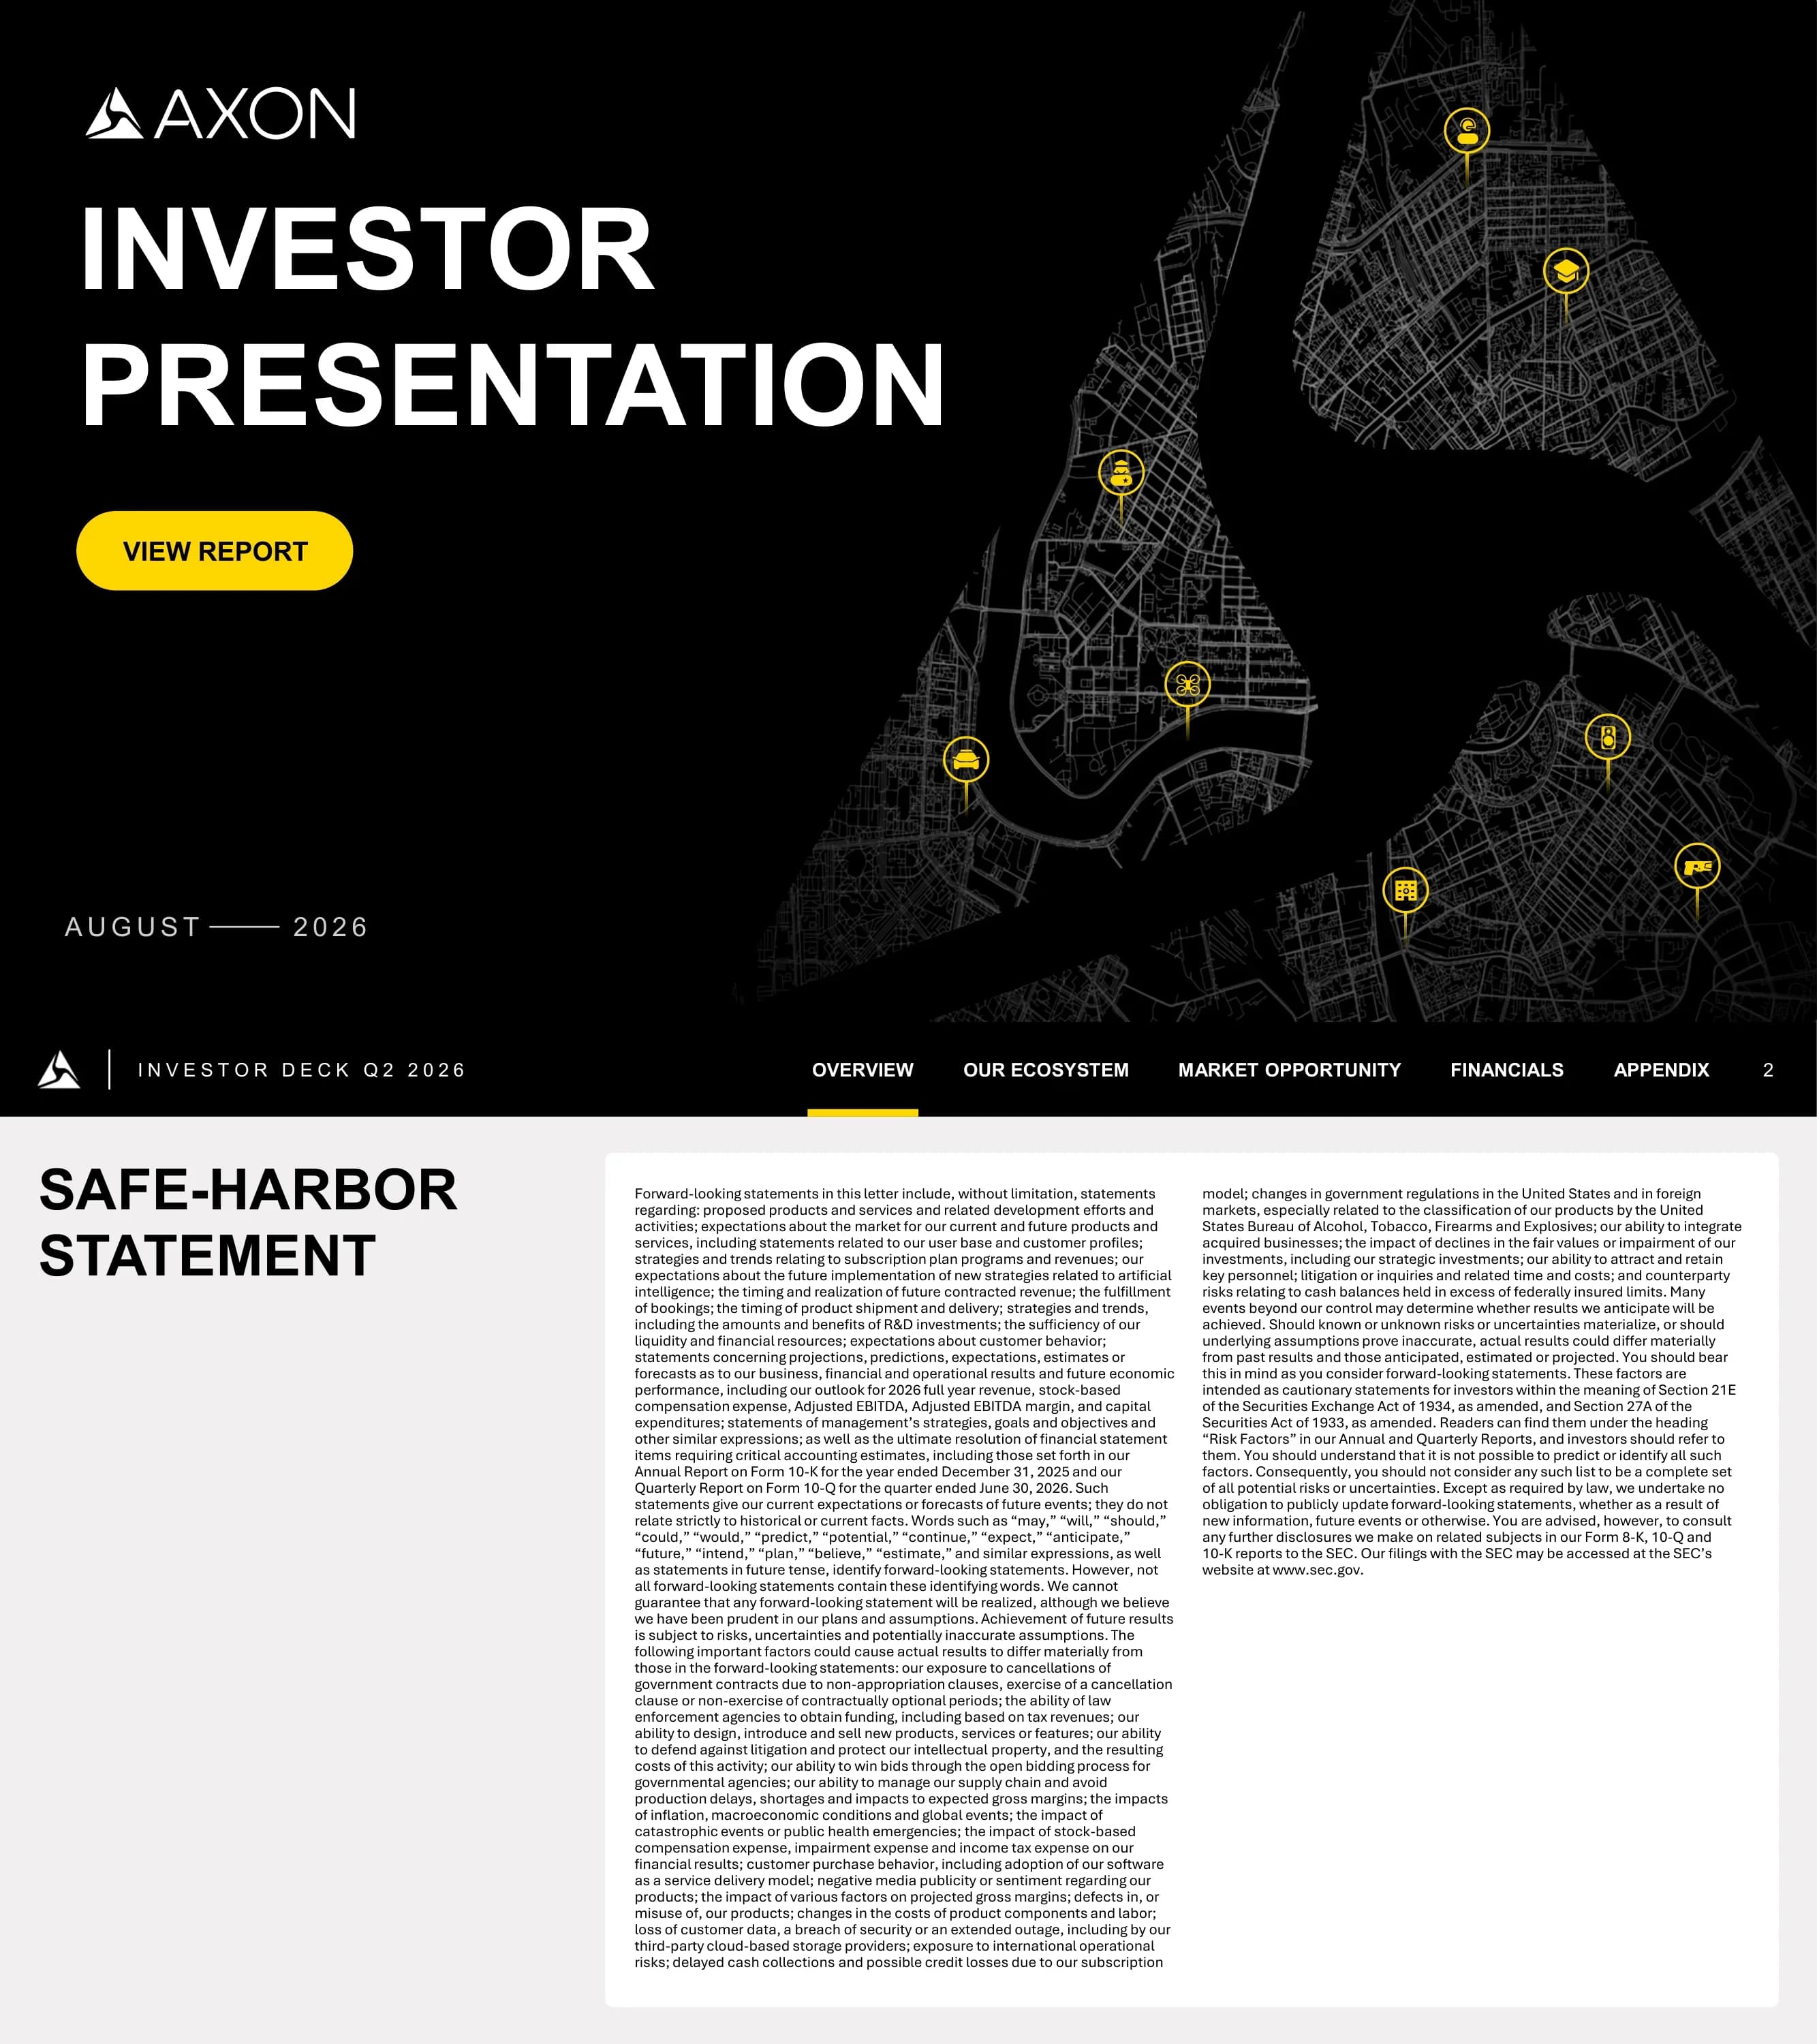
Cover slide for Axon's investor presentation, dated August 2026, with a 'View Report' call to action.
Black field with the Axon delta logo and wordmark at the upper left, a two-line title in heavy white capitals beneath, and a yellow pill button. The right half is a fine grey street map of a city rendered inside the negative space of the Axon delta mark, with yellow map pins marking different product use cases.
Forward-looking statements notice covering proposed products and development, market expectations, user base and customer profiles, subscription plan strategies, AI implementation, contracted revenue timing, the 2026 full year revenue, stock-based compensation, Adjusted EBITDA, Adjusted EBITDA margin and capital expenditure outlook, followed by the risk factors and a pointer to the Form 10-K for the year ended December 31, 2025 and the Form 10-Q for the quarter ended June 30, 2026.
A black navigation bar runs across the top carrying the deck name, five section tabs — Overview, Our Ecosystem, Market Opportunity, Financials, Appendix — with the active tab underlined in yellow, and the page number. Below, a heavy black title at the left and a white card holding two columns of small justified text.
Section divider introducing the overview.
Three rounded panels: a large black one at the left carrying the yellow Axon wordmark and the section title over the street-map-in-logo artwork, and two black-and-white photographs stacked at the right — a hand holding a body camera and a patrol vehicle in motion.
The company's stated moonshot, set against a chart of combined gun fatalities from 2015 to 2025 that rises through 2024 and then turns down. A callout notes that fatalities between police and the public in the United States declined nearly 10% in 2025, and a quote from a sheriff at a major US county sheriff's office reads: 'In 2025, we held a 42% reduction in deputy-involved shootings. We believe TASER 10 was a contributing factor.'
Black slide with 'OUR MOONSHOT' as a small eyebrow, the goal set in heavy white capitals with '50% BY 2033' picked out in yellow, and a line chart running across the right half where the recent downturn is drawn in yellow against a grey history. A photographic moon fills the upper right; two text panels overlay it.
Axon is building the operating system for public safety. Four claims: a technology platform revolutionising public safety; mission-driven to protect life, capture truth and accelerate justice; market leader in cloud-powered integrated hardware and software for public safety; and an attractive financial profile with high revenue growth, attractive gross margins and significant profitability. By the numbers: a $159 billion total addressable market, more than 1 million software users and more than 1 million TASER devices sold.
Three columns — a title and photograph of an officer with a tablet at the left, four tick-marked claims separated by hairlines in the middle, and two stacked cards at the right: a black one holding the TAM figure over concentric arcs, and a yellow one holding the two user counts under a 'By the numbers' pill.
Four customer segments. U.S. State & Local — trusted by over 17,000 state and local public safety agencies, supporting law enforcement, corrections, justice and fire and EMS. U.S. Federal — FedRAMP High cloud services and leading counter-drone provider, with growing applications across U.S. federal civilian and the Department of Defense. International — deployed in more than 85 countries, with large international police forces and enterprises investing in new technologies. Enterprise — workplace safety as a top priority for retail, healthcare, logistics and other frontline workers, as public and private safety efforts converge.
Four equal cards in a row, each with a yellow header band, a monochrome portrait of a worker in that segment, and two short paragraphs separated by a hairline.
Six headline figures: $2.8 billion of 2025 annual revenue, $1.6 billion of annual recurring revenue, a $159 billion total addressable market, a 25.5% 2025 annual Adjusted EBITDA margin, 126% net revenue retention and $15.1 billion of future contracted bookings.
A title and a photograph of an officer launching a drone at the left, and six white cards in a three-by-two grid at the right, each with an oversized black figure over a two-line caption.
Section divider introducing the product ecosystem.
The three-panel divider construction repeated with a drone photograph and a night-time officer photograph at the right.
Axon products are everywhere and coming to more places. Six metrics as of December 31, 2025: one live TASER 10 cartridge fired nearly every 30 seconds in the US; more than 400,000 VR training sessions; over 60 million hours of recordings from Axon Body 3 and Axon Body 4; 1 million monthly Fusus livestreams; more than 300,000 community cameras connected; and 200,000 monthly Axon Assistant messages. The right column shows the integrated hardware and software ecosystem organised under Protect Life, Capture Truth and Accelerate Justice.
Three columns — title and a city skyline photograph at the left, six tick-marked metrics separated by hairlines in the middle, and a mosaic at the right combining a black ecosystem panel with yellow label tiles and product photographs.
A human-centred platform with a mission to protect life. Sense — see and detect in real time: fixed cameras with automatic license plate reading, drones for aerial awareness, body cameras for first-person perspective, in-car cameras for real-time alerts, the emergency call center for calls, location, text and data, and real-time crime centers connecting all sensors under one pane of glass. Respond — coordinate the right response: TASER devices as less-lethal tools to de-escalate, drones as first responder to assess before the team is on scene, counter-drone to detect, track and mitigate, tactical drones for indoor response, training for preparation, and communications for secure voice, video and real-time data. Resolve — learn, improve and deliver closure. The Axon Platform Foundation comprises Axon Records, AI Era, Axon Fusus, Axon Justice, Axon Evidence and Axon 911.
A full-bleed render of a glowing brain-shaped data network with the yellow Axon mark and 'Protect Life' at its centre. Blue Sense products stream in from the left, orange Respond products stream out to the right, and purple Resolve flows down to a monitoring wall. A trapezoid platform foundation bar across the bottom lists six platform products with icons.
An incident timeline: a 911 call is received and initiates an AI-assisted workflow to gather critical information; the real-time crime center pulls location and available camera feeds into view; a remotely operated drone is dispatched to the scene; the drone arrives and streams live data to the RTCC operator; vehicle intelligence fixed and fleet in-car cameras provide additional live data streams; an officer is deployed with body-worn camera activated with AI Assistant; the officer is equipped with TASER to de-escalate; video evidence automatically uploads to Evidence.com; and reports are generated and uploaded to records and justice workflows.
A yellow audio-waveform band runs across the lower third, with SENSE, RESPOND and RESOLVE labelled beneath it in heavy white capitals and an officer standing at the centre. Nine annotations hang above on stems, alternating white and yellow, each with a small product photograph.
A four-minute counter-drone timeline: a drone threat is detected through Dedrone Tracker AI; the location of the aircraft, flight path and origin point of the operator are identified; stadium security arrives at the pilot location with law enforcement support on the way; Dedrone Defender aims directly at the drone delivering precise interference; and the disruption is ended.
The waveform timeline repeated with a 0:00 to 3:00 axis, five annotations on stems, a render of a mast-mounted counter-drone array at the right, a drone with yellow interference marks above it, and a stadium on a globe at the far right.
A retail incident timeline: retail associates regularly train to ensure effective and safe response; an incident occurs in a retail store and an associate calls for help; the enterprise security team receives an alert and investigates; details are summarised and the emergency is reported; law enforcement dispatches to help; a post-incident report connects the occurrence to a series of crime; and details are investigated and justice is served. A callout notes that a body-worn camera plus AI Assistant helps the associate communicate and document.
The waveform timeline a third time with a Pre-incident to Post-incident axis, a retail associate wearing a body camera at the left connected to a yellow callout box, and seven annotations on stems above.
Six customer quotes with named agencies: decrease time spent redacting evidence by 75% with Redaction Assistant (Rowlett Police Department); decrease time spent writing incident reports by 67% through Draft One (Fort Collins Police Department); Fleet 3 ALPR covers equivalent to five officers in the field (Fairfax County Police Department); over 400 unauthorized drone detections with Dedrone (Tulsa State Fair); TASER 10 was a no-brainer (Scottsdale Police Department); and increase the recovery of a stolen vehicle by 32 minutes with Fusus (Cobb County Police Department).
Title and a photograph at the left; six white cards in a three-by-two grid at the right, each with a yellow product icon, a quote with the key figure in bold, and the agency name in italic beneath.
Section divider introducing the market section.
The three-panel divider construction with an aerial campus photograph and a dispatcher photograph at the right.
Five drivers, each with a consequence. Upgrade products — Axon relentlessly innovates and improves existing products, with public safety adoption typically gradual and durable over many years, so customers upgrade to latest products over time. Create new categories — the ecosystem provides a seamlessly integrated experience for customers exploring AI, drones and robotic security, so innovation drives net new product introductions. Modernize antiquated technologies — legacy solutions are implemented for decades and see little investment, so optimised products help prioritise existing resources. Solve universal problems — safety challenges span beyond law enforcement into corrections, fire, EMS and enterprise, so safety needs expand beyond law enforcement. Expand globally — products have universal global applications, giving a massive global user base.
Five columns, each with a yellow header band, a monochrome photograph, a white explanatory card and a grey consequence footer in bold capitals.
A $159 billion total addressable market. By end customer in billions: U.S. State & Local $19, Enterprise $48, International Government $76, U.S. Federal $12 and Civilian $5, with law enforcement use cases accounting for approximately 50% of TAM and the U.S. State & Local law enforcement opportunity at approximately $15 billion — described as under 15% penetrated. By product area in billions: DEMS plus add-ons $41, TASER and training $14, body camera $13, AI plans $17, real-time operations $25, drones and robotics $20 and vehicle intelligence $30, with DEMS, software add-ons, TASER, training, body camera and AI Era Plan user solutions accounting for approximately 50% of TAM.
Two horizontal stacked bars — one by end customer, one by product area — each with values inside the segments and a legend beneath, plus a yellow callout banner on the first. A large yellow circle at the right holds the $159B figure, connected to both bars by dotted lines.
U.S. public safety spend is resilient and growing: a chart from 1978 to 2020 indexes state and local corrections, state and local public safety aggregate, U.S. GDP, state and local fire protection and state and local police, with corrections rising nearly 400% and the public safety aggregate above 200%. A banner reads 'Durable State & Local budget growth over the last 40+ years'. On the right, a pie chart of opportunity for efficiency with technology spend — not dependent on budget growth — shows Axon today as a sliver against premium bundle adoption and other spend, with a banner reading 'Axon captures less than 1% of the average customer budget with the potential to reach 3% with premium product adoption'.
Two white cards side by side — a five-line index chart at the left with a five-item legend, and a pie chart at the right with a three-item legend — each with a yellow claim banner beneath.
Five verticals with a headline statistic each. International law enforcement — 8 in 10 police officers in the United Kingdom stated body-worn cameras make officers feel safer, make their jobs easier and improve trust in the public. U.S. Federal — DHS enterprise-wide IDIQ allowing body-worn cameras and software licenses. Enterprise — 60% of CEOs have increased their budgets in support of technology software and solutions to prevent theft and crime. Corrections — 70% reduction in excessive force upon implementing body-worn cameras and TASER devices in correctional facilities. Justice — $3 million savings across the state of Tennessee upon implementing Axon Justice to help with evidence management and discovery compared to legacy methods.
Five columns matching the growth drivers slide — yellow header band, monochrome photograph, an oversized statistic and an explanatory paragraph in a white card.
Subscription offerings grow as Axon releases new products, shown as three tiers: OSP 1.0 from 2017 at $99, including TASER, body camera and digital evidence management; OSP 10 Premium at $370, adding VR training, Respond, Performance, auto-tagging, Redaction, Citizen, Records, Standards, My90, Fusus, Dedrone and Outpost; and OSP 10 Premium with AI Era Plan at $569, adding transcription, Draft One, Axon Assistant, live translation, policy chat, Brief One, Form One, smart detection, Smart Capture, prepared 911 assist and more. Supporting metrics: 126% net revenue retention, a net promoter score above 60, and more than 95% of revenue tied to customers on subscription plans.
A four-stage flywheel diagram circling the Axon mark at the left; three pricing columns at the right in grey, dark grey and yellow headers, each with a price and a tick-list; two metric strips beneath, one white and one yellow.
Section divider introducing the financial section.
The three-panel divider construction with military police and dispatcher photographs at the right.
Subscription plans support high visibility with annual recurring software revenue and regular hardware upgrades. Hardware — revenue recognised on delivery following scheduled shipment cycles: TASER 10, cartridges, virtual reality headsets, Axon Body 4, Axon Air hardware and DedroneBeyond radar. Software and services — ratable SaaS revenue recognition: evidence management, records management, real-time operations, Axon Performance, Redaction Assistant, Community Request, auto-tagging and VR training. AI Era Plan — an optional add-on SaaS offering: transcription, Draft One, live translation, CAD Q&A, policy chat and more over the life of the contract. An illustrative five-year revenue recognition chart shows hardware spiking in years 1 and 3 while software and AI Era recur every year, with more than 75% software revenue over the five-year term and more than 95% of revenue tied to subscription customers.
Three labelled revenue-type blocks down the left, and a white card at the right holding a five-year stacked column chart with a three-item legend, above two yellow claim tiles.
Segment quarterly revenue in millions: $669 in Q2 2025 ($376 connected devices plus $292 software and services), $711 in Q3 2025, $797 in Q4 2025, $807 in Q1 2026 and $904 in Q2 2026 ($507 plus $398) — 35% year-over-year revenue growth. Annual revenue: $1,187 million in 2022, $1,561 million in 2023, $2,083 million in 2024, $2,780 million in 2025 and $3,219 million on a trailing-twelve-month basis — a 33% revenue CAGR from 2022 to 2025. Q2 2026 gross margin: connected devices 51.9%, software and services 71.3%, total 60.4%, with adjusted gross margins of 53.4%, 75.1% and 62.9%. FY2025 gross margin: 48.7%, 74.0% and 59.7%, with adjusted margins of 51.2%, 77.5% and 62.6%.
Two stacked-bar charts side by side — quarterly at the left, annual at the right with the TTM column in yellow — over two margin tables, each with a yellow callout tile carrying the growth or CAGR figure.
Four charts. Total annual revenue: $1,187 million in 2022, $1,561 million in 2023, $2,083 million in 2024 and $2,780 million in 2025 — $2.8 billion in 2025. Annual revenue growth: 37%, 31%, 33% and 33%. Connected devices revenue: $964 million in 2023, $1,221 million in 2024 and $1,577 million in 2025 — $1.6 billion. Software and services revenue: $597 million, $861 million and $1,203 million — $1.2 billion.
A two-by-two grid of white cards, each with a caption, an oversized figure marked by a short yellow rule, and a bar chart whose final column is yellow.
Four margin charts for 2022 to 2025. GAAP gross margin 61.2%, 61.2%, 59.6% and 59.7%. Adjusted gross margin 61.8%, 61.8%, 63.2% and 62.6%. GAAP net income margin 12.4%, 11.3%, 18.1% and 4.5%. Adjusted EBITDA margin 19.5%, 21.2%, 25.0% and 25.5%.
The two-by-two card grid repeated for margins, with the 2025 column in yellow in each chart.
Four charts. Future contracted bookings in billions: $3.3 in Q2 2022, $5.2 in Q2 2023, $7.5 in Q2 2024, $10.7 in Q2 2025 and $15.1 in Q2 2026. Net revenue retention: 119%, 122%, 122%, 124% and 126%. Annual recurring revenue in millions: $398, $590, $850, $1,183 and $1,639. Revenue from customers on subscription plans: 88% in 2021, 92% in 2022, 95% in 2023, more than 95% in 2024 and more than 95% in 2025.
The two-by-two card grid a third time, each chart with five columns and the latest in yellow.
Prior guidance from May 6, 2026 against FY 2026 guidance from August 5, 2026: revenue 30% to 32% annual growth raised to 32% to 34%; Adjusted EBITDA approximately 25.5% margin, unchanged; capital expenditures $160 million to $190 million, unchanged; free cash flow approximately $450 million, unchanged.
A four-row table with a yellow header band carrying both guidance dates, alternating white and light grey rows, and a single-line forward-looking note beneath. Most of the lower half is empty.
A $6 billion 2028 annual revenue target at a 28% Adjusted EBITDA margin. Additional 2028 targets: average annual free cash flow conversion of 60% of Adjusted EBITDA, and annual dilution from stock-based compensation of less than 2.5%. A chart shows 2025 revenue of $2.8 billion at a 25.5% margin rising to $6 billion at 28.0%.
Two white metric cards and a yellow-headed additional-targets table down the left; a white card at the right with two bars — grey for 2025 and yellow for 2028 — joined by a thin margin trend line.
Section divider introducing the appendix.
The three-panel divider construction for the fifth and final time, with a tablet and a VR training photograph at the right.
Three definitions. Annual recurring revenue — a performance indicator giving visibility into growth of revenue from the highest margin recurring services, calculated as monthly recurring license, integration, warranty and storage revenue annualized, and to be viewed independently of revenue and deferred revenue. Net revenue retention — dollar-based, calculated as software, camera and TASER warranty subscription and support revenue from a base set of agency customers in the last month of a quarter divided by the same revenue from the year-ago month for that customer base, excluding the lower-margin hardware subscription component and the benefit of new customer acquisition, and inclusive of customer churn. Future contracted bookings — total unfulfilled contracted bookings including remaining performance obligations plus contracts with termination clauses, updated from Q3 2025 to include cumulative gross bookings including third-party agent arrangements.
A heavy black title at the left and a white card at the right holding three bold-headed definition paragraphs.
Explains the non-GAAP measures presented — EBITDA, Adjusted EBITDA, Adjusted EBITDA margin, adjusted gross margin, non-GAAP net income, non-GAAP diluted EPS, free cash flow and adjusted free cash flow — and three methodology updates: from the quarter ended March 31, 2026 Adjusted EBITDA excludes all components of other income (loss) net; from the same quarter non-GAAP net income and diluted EPS exclude amortisation of acquired intangibles; and from the quarter ended June 30, 2026 Adjusted EBITDA and adjusted gross margin exclude additional jurisdiction-specific compensation-related taxes from Employee XSP vesting. A caution section lists five limitations, followed by definitions of each measure.
A four-line heavy black title at the left and a dense white text card at the right with three paragraphs, a caution block with five bullets and a definitions block with eight bullets.
Three months ended June 30, 2026 and 2025 and twelve months ended December 31 for 2025 through 2022, in thousands. Net sales $904,389 and $668,538 for the quarters; $2,779,536, $2,082,526, $1,560,699 and $1,187,143 for the years. Gross margin $546,447 and $403,743; $1,658,125, $1,241,380, $955,453 and $726,113. Adjustments comprise stock-based compensation expense, amortisation of acquired intangible assets, compensation taxes related to Employee XSP vesting, severance costs and inventory step-up amortisation, giving adjusted gross margin of $569,123 and $422,978 for the quarters and $1,739,093, $1,315,447, $965,192 and $733,383 for the years. Gross margin percentage 60.4%, 60.4%, 59.7%, 59.6%, 61.2% and 61.2%; adjusted 62.9%, 63.3%, 62.6%, 63.2%, 61.8% and 61.8%.
A six-column table with a yellow header band, alternating white and grey rows, bold subtotal rows and italic percentage rows at the foot. Three-months and twelve-months column groups are marked by rules above the headers.
Same six periods. Net income $29,427 and $36,117 for the quarters; $124,656, $377,034, $175,783 and $146,930 for the years. Adding depreciation and amortisation, interest expense, investment interest income and provision for income taxes gives EBITDA of $85,585 and $(14,126) for the quarters and $124,570, $401,724, $147,587 and $216,325 for the years. Further adjustments — other income/loss net, stock-based compensation of $144,320 in the quarter, compensation taxes on Employee XSP vesting, transaction costs, non-qualified deferred compensation adjustments, litigation and regulatory costs, severance, disposal and impairment losses, inventory step-up amortisation and loss recoveries — give Adjusted EBITDA of $242,024 and $171,632 for the quarters and $710,155, $521,375, $331,396 and $232,033 for the years, at margins of 26.8%, 25.7%, 25.5%, 25.0%, 21.2% and 19.5%.
The same six-column table, longer, with two bold subtotal rows — EBITDA and Adjusted EBITDA — and the margin row in italic at the foot.
Same six periods. Net income $29,427 and $36,117 for the quarters, adjusted for income or losses from investments and marketable securities, stock-based compensation, amortisation of acquired intangibles, compensation taxes on Employee XSP vesting, transaction costs, litigation and regulatory costs, severance, debt inducement expense, disposal and impairment losses, inventory step-up amortisation, loss recoveries and income tax effects, giving non-GAAP net income of $155,477 and $178,785 for the quarters and $586,416, $479,208, $317,044 and $161,716 for the years. Non-GAAP net income margin 17.2%, 26.7%, 21.1%, 23.0%, 20.3% and 13.6%; weighted average diluted shares 82,541, 82,062, 82,370, 78,558, 75,456 and 72,534 thousand; non-GAAP EPS $1.88, $2.18, $7.12, $6.10, $4.20 and $2.23.
The same six-column table with one bold subtotal, an italic margin row, a share count row and a per-share row at the foot.
Same six periods. Net cash provided by (used in) operating activities $20,077 and $(91,704) for the quarters; $211,339, $408,312, $189,263 and $235,361 for the years. Less purchases of property and equipment of $(21,049) and $(22,953) for the quarters and purchases of intangible assets in the earlier years, giving free cash flow of $(972) and $(114,657) for the quarters and $75,081, $329,527, $128,993 and $179,252 for the years. Adding bond premium amortisation and net campus investment gives adjusted free cash flow of $(710) and $(110,715) for the quarters and $85,639, $344,304, $148,111 and $196,614 for the years.
The shortest of the four reconciliation tables — seven rows across six columns with two bold subtotals, negative figures in parentheses.
Closing slide.
A single black rounded panel with the yellow Axon wordmark at the upper left, 'THANK YOU' in heavy white capitals beneath, and the street-map-in-logo artwork filling the right half — the cover construction without the button.
Perguntas comuns sobre este slide e o conteúdo da apresentação subjacente.
The full 36-slide Axon investor presentation as a PDF, plus a page-by-page preview. This one is PDF only — no PowerPoint is included, because at 21.8 MB the source file is over the 15 MB ceiling of the conversion tool used to produce the editable versions.
Yes. The PDF is the investor deck Axon published on its investor relations site, dated August 2026 and labelled Investor Deck Q2 2026.
2025 annual revenue of $2.78 billion, up 33%, with a 25.5% adjusted EBITDA margin and $1.6 billion of annual recurring revenue. Q2 2026 quarterly revenue was $904 million, up 35% year over year. Future contracted bookings reached $15.1 billion, net revenue retention was 126%, and more than 95% of revenue is tied to customers on subscription plans.
FY2026 guidance was raised on August 5, 2026 from 30–32% to 32–34% annual revenue growth, with Adjusted EBITDA margin unchanged at approximately 25.5%, capital expenditures of $160–190 million and free cash flow of approximately $450 million. The 2028 target model is $6 billion of revenue at a 28% Adjusted EBITDA margin, with 60% free cash flow conversion and annual dilution below 2.5%.
Three Officer Safety Plan tiers priced per user: OSP 1.0 at $99 with TASER, body camera and digital evidence management; OSP 10 Premium at $370 adding VR training, Respond, Redaction, Records, Fusus, Dedrone and more; and OSP 10 Premium with AI Era Plan at $569 adding transcription, Draft One, Axon Assistant, live translation and further AI features. Slide 22 shows how hardware revenue recognises on delivery while software recurs, giving more than 75% software revenue over a five-year term.
A $159 billion total addressable market. By end customer: international government $76 billion, enterprise $48 billion, U.S. state and local $19 billion, U.S. federal $12 billion and civilian $5 billion. By product area, DEMS and add-ons are the largest at $41 billion. Axon describes the U.S. state and local law enforcement TAM as under 15% penetrated and says it captures less than 1% of the average customer budget today.
It is the best template here for a standing investor deck rather than a quarterly pack. Three things transfer well: the persistent section-tab bar across the top so a long deck stays navigable; the incident-timeline slide that runs one story along a waveform with products appearing where they are used; and customer proof given as quoted results with named agencies instead of a logo wall.
Black, white and one yellow, used with discipline. Yellow marks only three things — the active section tab, the current period in every chart, and the claim the company most wants you to remember. The street-map-inside-the-logo artwork recurs on the cover, every section divider and the closing slide, so the deck's five sections each open the same way.
Original PDF published by Axon on its investor relations site.

Create Your Own Slides
Turn your ideas into professional presentations in seconds with 2slides AI.
Referencie designs profissionais, escolha seu estilo e gere slides com renderização de texto perfeita. Alimentado por Nano Banana—comece a criar sua apresentação agora.
Your AI Agent for slides. Save time, shine faster with intelligent presentation creation.




© 2026 2slides. All rights reserved.