
Należy do zbioru Przykłady prezentacji dla inwestorów · Przykłady prezentacji dla inwestorów spółek półprzewodnikowych
TSMC (Taiwan Semiconductor Manufacturing Company) 2026 Third Quarter Earnings Conference presentation, held October 15, 2026, covering 3Q26 results and 4Q26 guidance; filed on Taiwan's Market Observation Post System (MOPS) for the Q3 2026 investor conference (法說會).
Używa okładki tej prezentacji jako wzoru stylu dla slajdów tworzonych z Twojej treści. Możesz też wybrać dowolną stronę poniżej i użyć jej układu jako wzoru.
Szybka Nawigacja
Tagi
Udostępnij slajdy
TSMC (Taiwan Semiconductor Manufacturing Company) 2026 Third Quarter Earnings Conference presentation, held October 15, 2026, covering 3Q26 results and 4Q26 guidance; filed on Taiwan's Market Observation Post System (MOPS) for the Q3 2026 investor conference (法說會).
Szczegółowy widok każdej strony slajdu, w tym układu, kluczowej treści i elementów wizualnych.
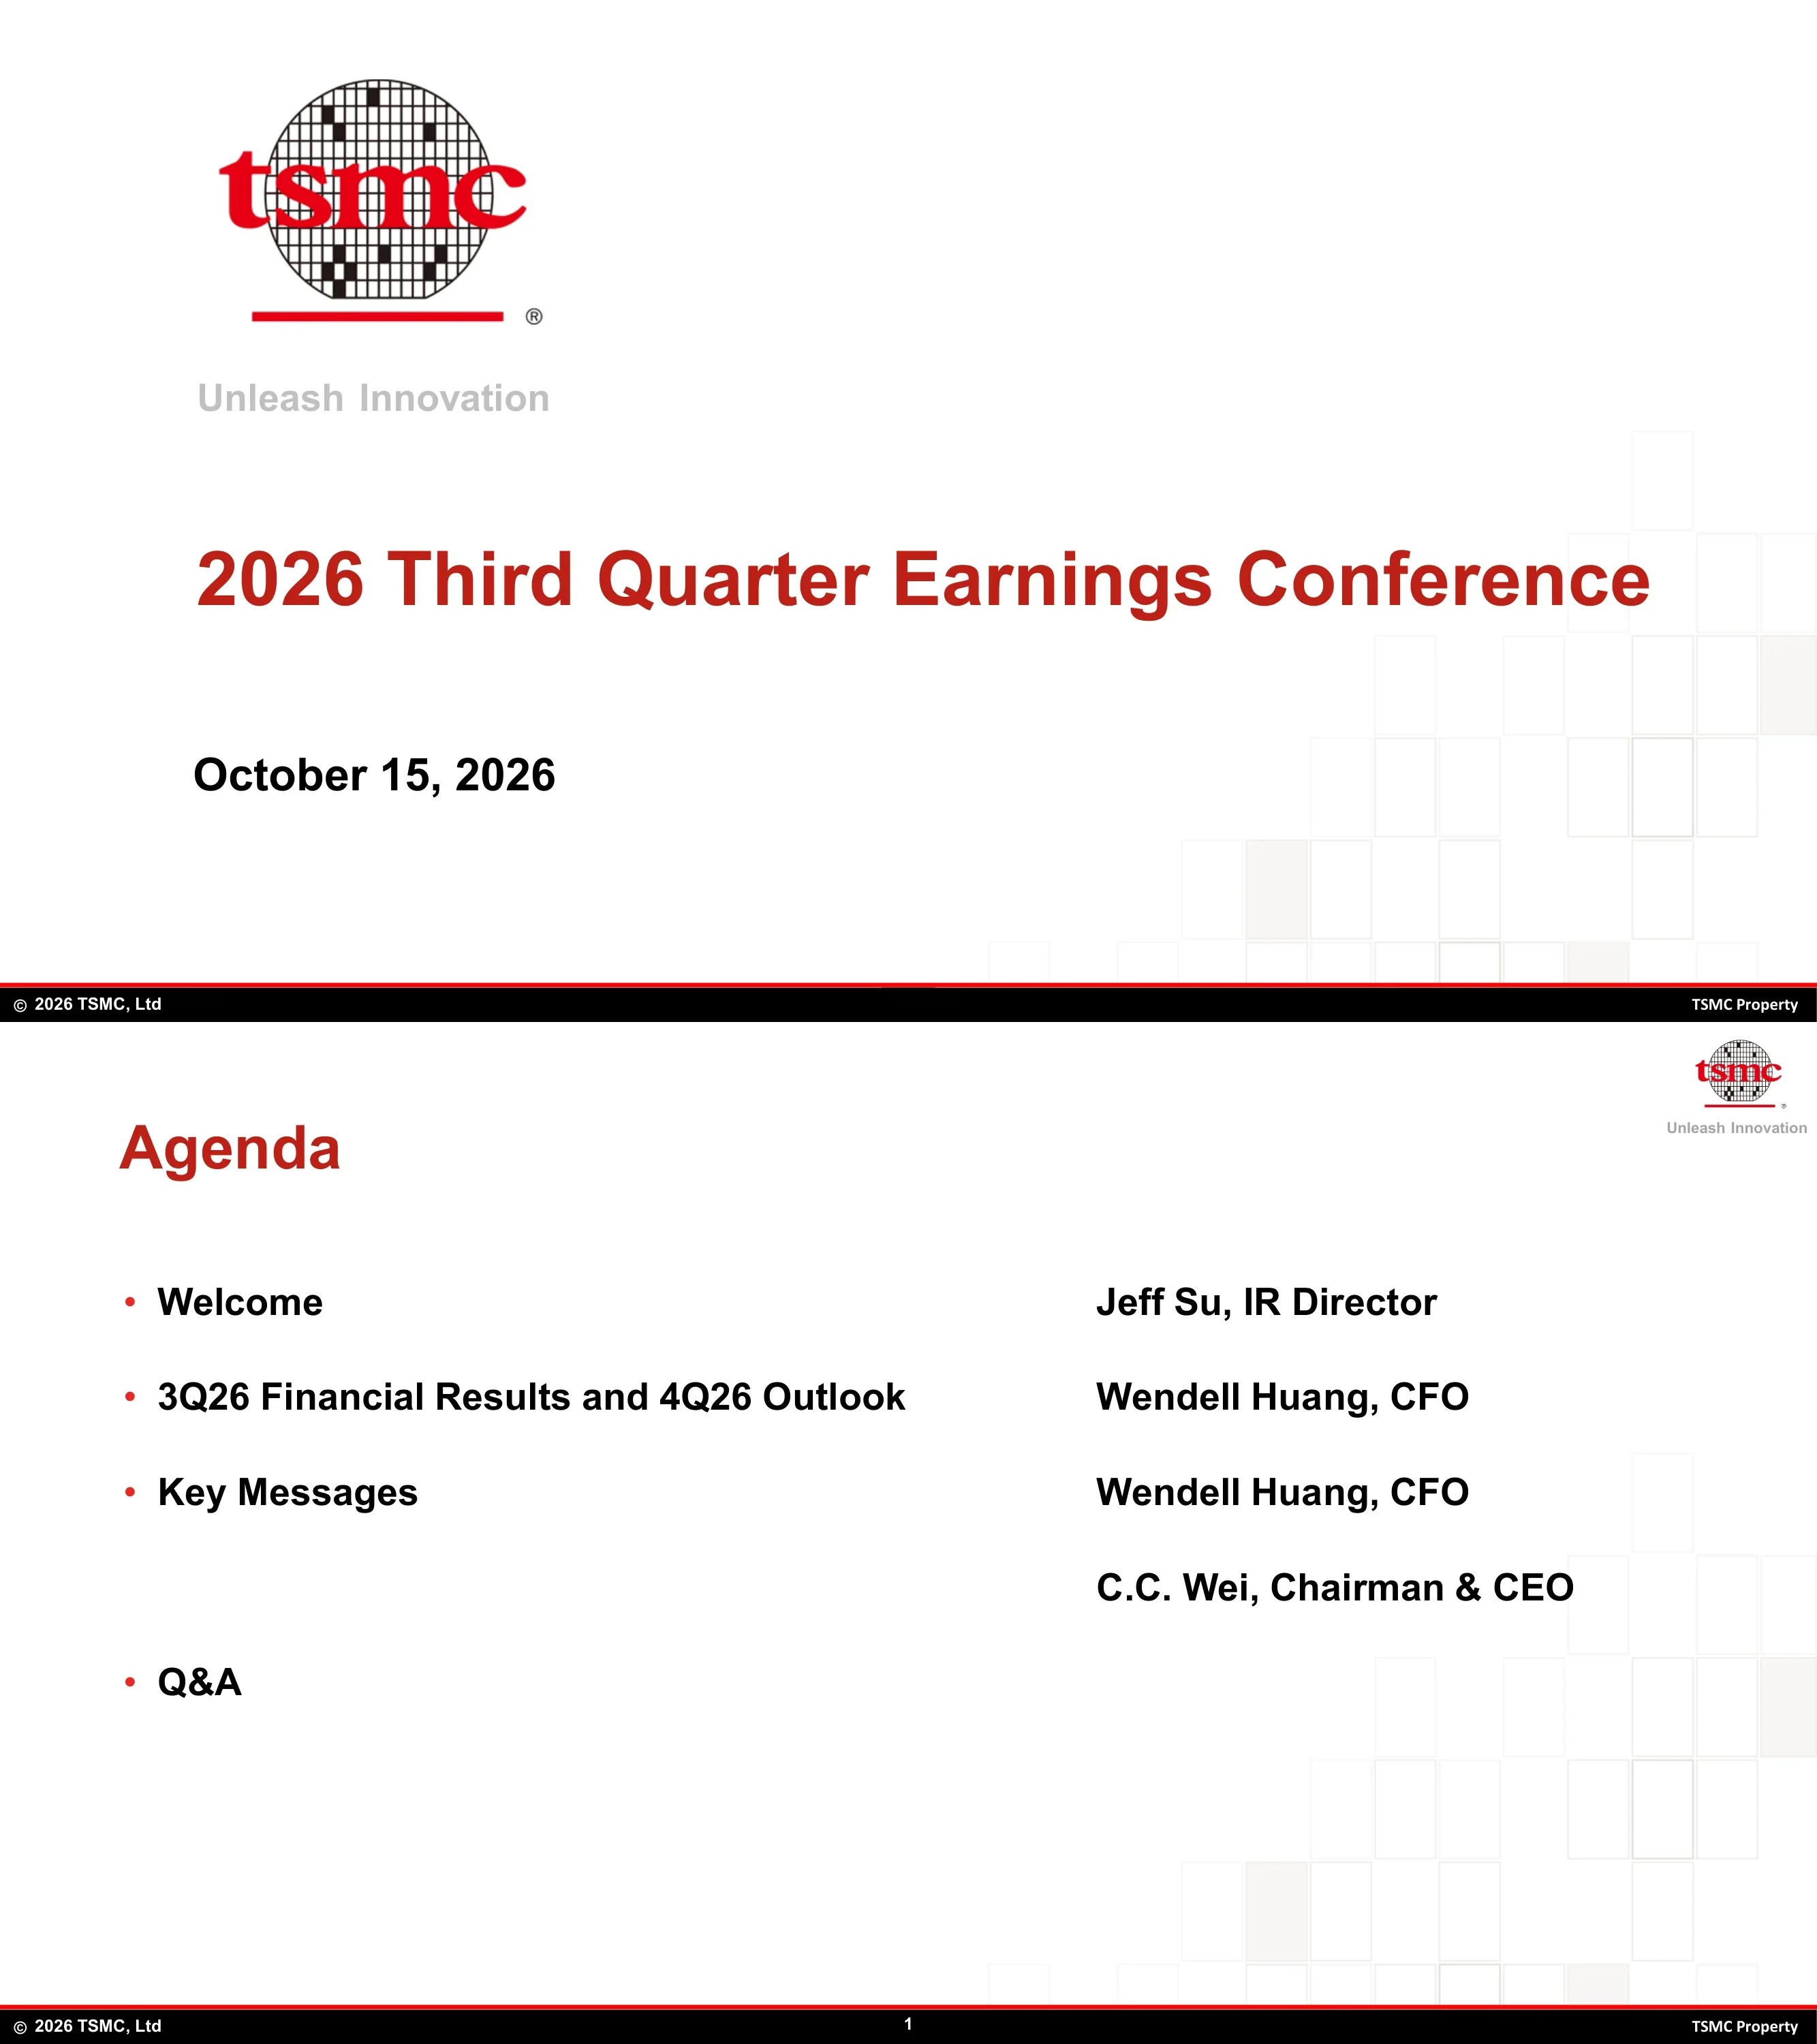
Title slide for TSMC's 2026 Third Quarter Earnings Conference, dated October 15, 2026, with the tagline 'Unleash Innovation'.
White slide with the red TSMC wafer logo and tagline at top left, a large red title and a bold black date below, faint grey block pattern at bottom right, black footer bar reading '(c) 2026 TSMC, Ltd' and 'TSMC Property'.
Agenda in four items with presenters: Welcome (Jeff Su, IR Director); 3Q26 Financial Results and 4Q26 Outlook (Wendell Huang, CFO); Key Messages (Wendell Huang, CFO, then C.C. Wei, Chairman & CEO); Q&A.
Red left-aligned title; two-column list with agenda items on the left and speaker names and titles on the right; logo top right.
Forward-looking statements are subject to significant risks and uncertainties and actual results may differ materially. Risk factors are in TSMC's 2025 Annual Report on Form 20-F filed with the U.S. SEC on April 16, 2026. TSMC undertakes no obligation to update forward-looking statements except as required by law.
Red title with three full-width bullet paragraphs of legal text.
Selected income statement items in NT$ billions (NT$ = New Taiwan dollars) with the 3Q26 column highlighted by a red box, compared with 3Q26 guidance, 2Q26 and 3Q25. Net revenue US$46.72 billion (guidance US$44.6-45.8 billion; 2Q26 US$40.20 billion; 3Q25 US$33.10 billion), up 16.2% QoQ and 41.2% YoY. Net revenue NT$1,494.24 billion (+17.6% QoQ, +50.9% YoY). Gross margin 66.4% (guidance 65.0%-67.0%; 2Q26 67.7%; 3Q25 59.5%). Operating expenses NT$116.43 billion. Operating margin 58.7% (guidance 56.0%-58.0%). Non-operating items NT$34.59 billion. Net income attributable to parent shareholders NT$763.06 billion (+8.0% QoQ, +68.7% YoY). Net profit margin 51.1%. EPS NT$29.43. ROE 45.5% (annualized). Shipments 4,476 Kpcs of 12-inch-equivalent wafers (+3.2% QoQ, +9.6% YoY). Average exchange rate USD/NTD 31.98 (guidance 32.0). Footnotes: diluted weighted average shares 25,932 million; ROE annualized.
Rounded grey table panel with line items as rows and columns for 3Q26, 3Q26 guidance, 2Q26, 3Q25, QoQ and YoY change; key margin rows in bold; red outline on the 3Q26 column; footnotes below.
Left: 3D pie chart of 3Q26 wafer revenue by process node: 3nm 33%, 5nm 28%, 7nm 10%, 2nm 8%, 16/20nm 6%, 28nm 6%, 65nm 4%, 40/45nm 2%, 90nm-0.13um 1%, 0.15um and above 2%. Right: stacked column chart titled '7nm and Below Revenue' in NT$ billions from 1Q24 to 3Q26, with 7nm, 5nm, 3nm and 2nm series; totals rise to roughly NT$950 billion in 3Q26 with a 2nm segment now visible. Exact per-bar values are not labelled.
Two-panel slide: color-coded 3D pie chart with callout leader lines on the left, stacked column chart with legend on the right.
Left: pie chart of 3Q26 revenue by platform: HPC 68%, Smartphone 21%, IoT 4%, Automotive 4%, DCE 1%, Others 2%. Right: bar chart 'Growth Rate by Platform (QoQ)': HPC +22%, Smartphone +10%, IoT +5%, Automotive +23%, DCE -12%, Others -10%.
Two-panel slide with a 3D pie chart on the left and a vertical bar chart with positive and negative bars on the right.
Selected balance sheet items in NT$ billions for 3Q26, 2Q26 and 3Q25, with amount and share of total assets. 3Q26: cash and marketable securities 4,016.98 (39.9%); accounts receivable 483.56; inventories 427.75; long-term investments 224.63; net PP&E 4,526.49 (45.0%); total assets 10,052.89; current liabilities 1,967.75; long-term interest-bearing debts 818.38 (8.1%); total liabilities 3,009.66 (29.9%); total shareholders' equity 7,043.23 (70.1%). Key indices for 3Q26: A/R turnover 28 days, inventory turnover 82 days, current ratio 2.6x, asset productivity 1.4x. Footnotes: 25,932 million shares outstanding at 9/30/26; asset productivity = annualized net revenue / average net PP&E.
Grey table panel with three period column pairs (Amount and %), 3Q26 highlighted with a red box, Key Indices block at the bottom, footnotes below.
Cash flow summary in NT$ billions for 3Q26, 2Q26 and 3Q25. 3Q26: beginning balance 3,134.22; cash from operating activities 919.77; capital expenditures (443.21); cash dividends (155.59); bonds payable (0.85); investments and others 167.55; ending balance 3,621.89; free cash flow 476.56 (2Q26: 287.36; 3Q25: 139.38). Free cash flow = cash from operating activities minus capital expenditures.
Grey rounded table with three columns, outflows shown in red parentheses, 3Q26 column outlined in red, footnote below.
Management expects 4Q26 revenue between US$52.3 billion and US$54.3 billion. Based on an exchange rate assumption of 1 US dollar to 31.8 NT dollars, gross profit margin between 65% and 67% and operating profit margin between 56.5% and 58.5%.
Red title with an intro sentence and three square-bulleted guidance lines on white.
Management expects 2026 revenue to increase by around 44% in US dollar terms.
Red title with one intro sentence and a single square-bulleted statement, large white space below.
Three events: ASML and TSMC announced an initiative to move the industry to large-format photomasks for High NA EUV (2026/09/08); Sony Semiconductor Solutions and TSMC agreed to establish a joint venture for next-generation image sensors (2026/08/11); the Board approved a NT$7.00 cash dividend for 2Q26 with ex-dividend date December 10, 2026, record date December 16, 2026 and distribution date January 7, 2027 (2026/08/11). Footnote points to tsmc.com and the Market Observation Post System (mops.twse.com.tw).
Red title with three bold bullet paragraphs and a small footnote bullet at the bottom.
Closing slide with the TSMC logo and contact details: https://www.tsmc.com and invest@tsmc.com.
Centered logo on the left with website and investor email in red on the right, white background.
Częste pytania dotyczące tego slajdu i podstawowej treści prezentacji.
This 12-slide deck from TSMC's October 15, 2026 earnings conference covers 3Q26 financial results (income statement, revenue by technology and platform, balance sheet, cash flows), 4Q26 guidance, the full-year 2026 outlook and a recap of recent major events.
As the deck states: net revenue of US$46.72 billion (NT$1,494.24 billion), gross margin 66.4%, operating margin 58.7%, net profit margin 51.1%, net income attributable to the parent NT$763.06 billion and EPS of NT$29.43. NT$ means New Taiwan dollars.
Management expects 4Q26 revenue of US$52.3-54.3 billion, gross margin of 65%-67% and operating margin of 56.5%-58.5%, assuming 1 US dollar = 31.8 NT dollars. For full-year 2026, revenue is expected to grow around 44% in US dollar terms.
TSMC reports on calendar quarters, so 3Q26 is July 1 to September 30, 2026, and 2Q26 and 3Q25 are the comparison periods used throughout the deck.
It is the English version of the slides TSMC uploaded to Taiwan's Market Observation Post System (MOPS, 公開資訊觀測站) for its Q3 2026 investor conference (法說會), which every TWSE-listed company must hold. A Chinese version is also filed on MOPS.
By technology, 3nm was 33%, 5nm 28%, 7nm 10% and 2nm 8% of wafer revenue. By platform, HPC was 68%, Smartphone 21%, IoT 4%, Automotive 4%, DCE 1% and Others 2%.
The deck can be viewed as slide images and downloaded as the original PDF and an editable PPTX from this page.
Yes, you can use its structure (title, agenda, financial tables, chart slides, guidance and outlook, closing) as a layout reference for your own earnings presentation. TSMC's logos, trademarks and figures belong to TSMC and should not be reused as your own.

Create Your Own Slides
Turn your ideas into professional presentations in seconds with 2slides AI.
Odwołuj się do profesjonalnych projektów, wybierz swój styl i generuj slajdy z idealnym renderowaniem tekstu. Napędzane przez Nano Banana—zacznij tworzyć swoją prezentację teraz.
Twój Agent AI dla slajdów. Oszczędzaj czas, błyszcz szybciej dzięki inteligentnemu tworzeniu prezentacji.


© 2026 2slides. Wszelkie prawa zastrzeżone.