
Należy do zbioru Przykłady prezentacji dla inwestorów · Przykłady prezentacji dla inwestorów z Japonii
Toyota Motor H1 FY2026 Earnings Presentation (fiscal year ending March 2027, second-quarter results): a Japanese-language deck originally published on TDnet (Tokyo Stock Exchange Timely Disclosure) on November 5, 2026. It covers first-half operating income of ¥2.19 trillion (21,911 ¥100 million), up ¥185.4 billion year on year, a full-year operating income forecast raised to ¥3.9 trillion, a higher dividend and an expanded ¥1.3 trillion share buyback, plus an update on Toyota's business restructuring: regional strategy for North America, China and the Global South, value-chain earnings, robotics and capital allocation.
Używa okładki tej prezentacji jako wzoru stylu dla slajdów tworzonych z Twojej treści. Możesz też wybrać dowolną stronę poniżej i użyć jej układu jako wzoru.
Szybka Nawigacja
Tagi
Udostępnij slajdy
Toyota Motor H1 FY2026 Earnings Presentation (fiscal year ending March 2027, second-quarter results): a Japanese-language deck originally published on TDnet (Tokyo Stock Exchange Timely Disclosure) on November 5, 2026. It covers first-half operating income of ¥2.19 trillion (21,911 ¥100 million), up ¥185.4 billion year on year, a full-year operating income forecast raised to ¥3.9 trillion, a higher dividend and an expanded ¥1.3 trillion share buyback, plus an update on Toyota's business restructuring: regional strategy for North America, China and the Global South, value-chain earnings, robotics and capital allocation.
Szczegółowy widok każdej strony slajdu, w tym układu, kluczowej treści i elementów wizualnych.
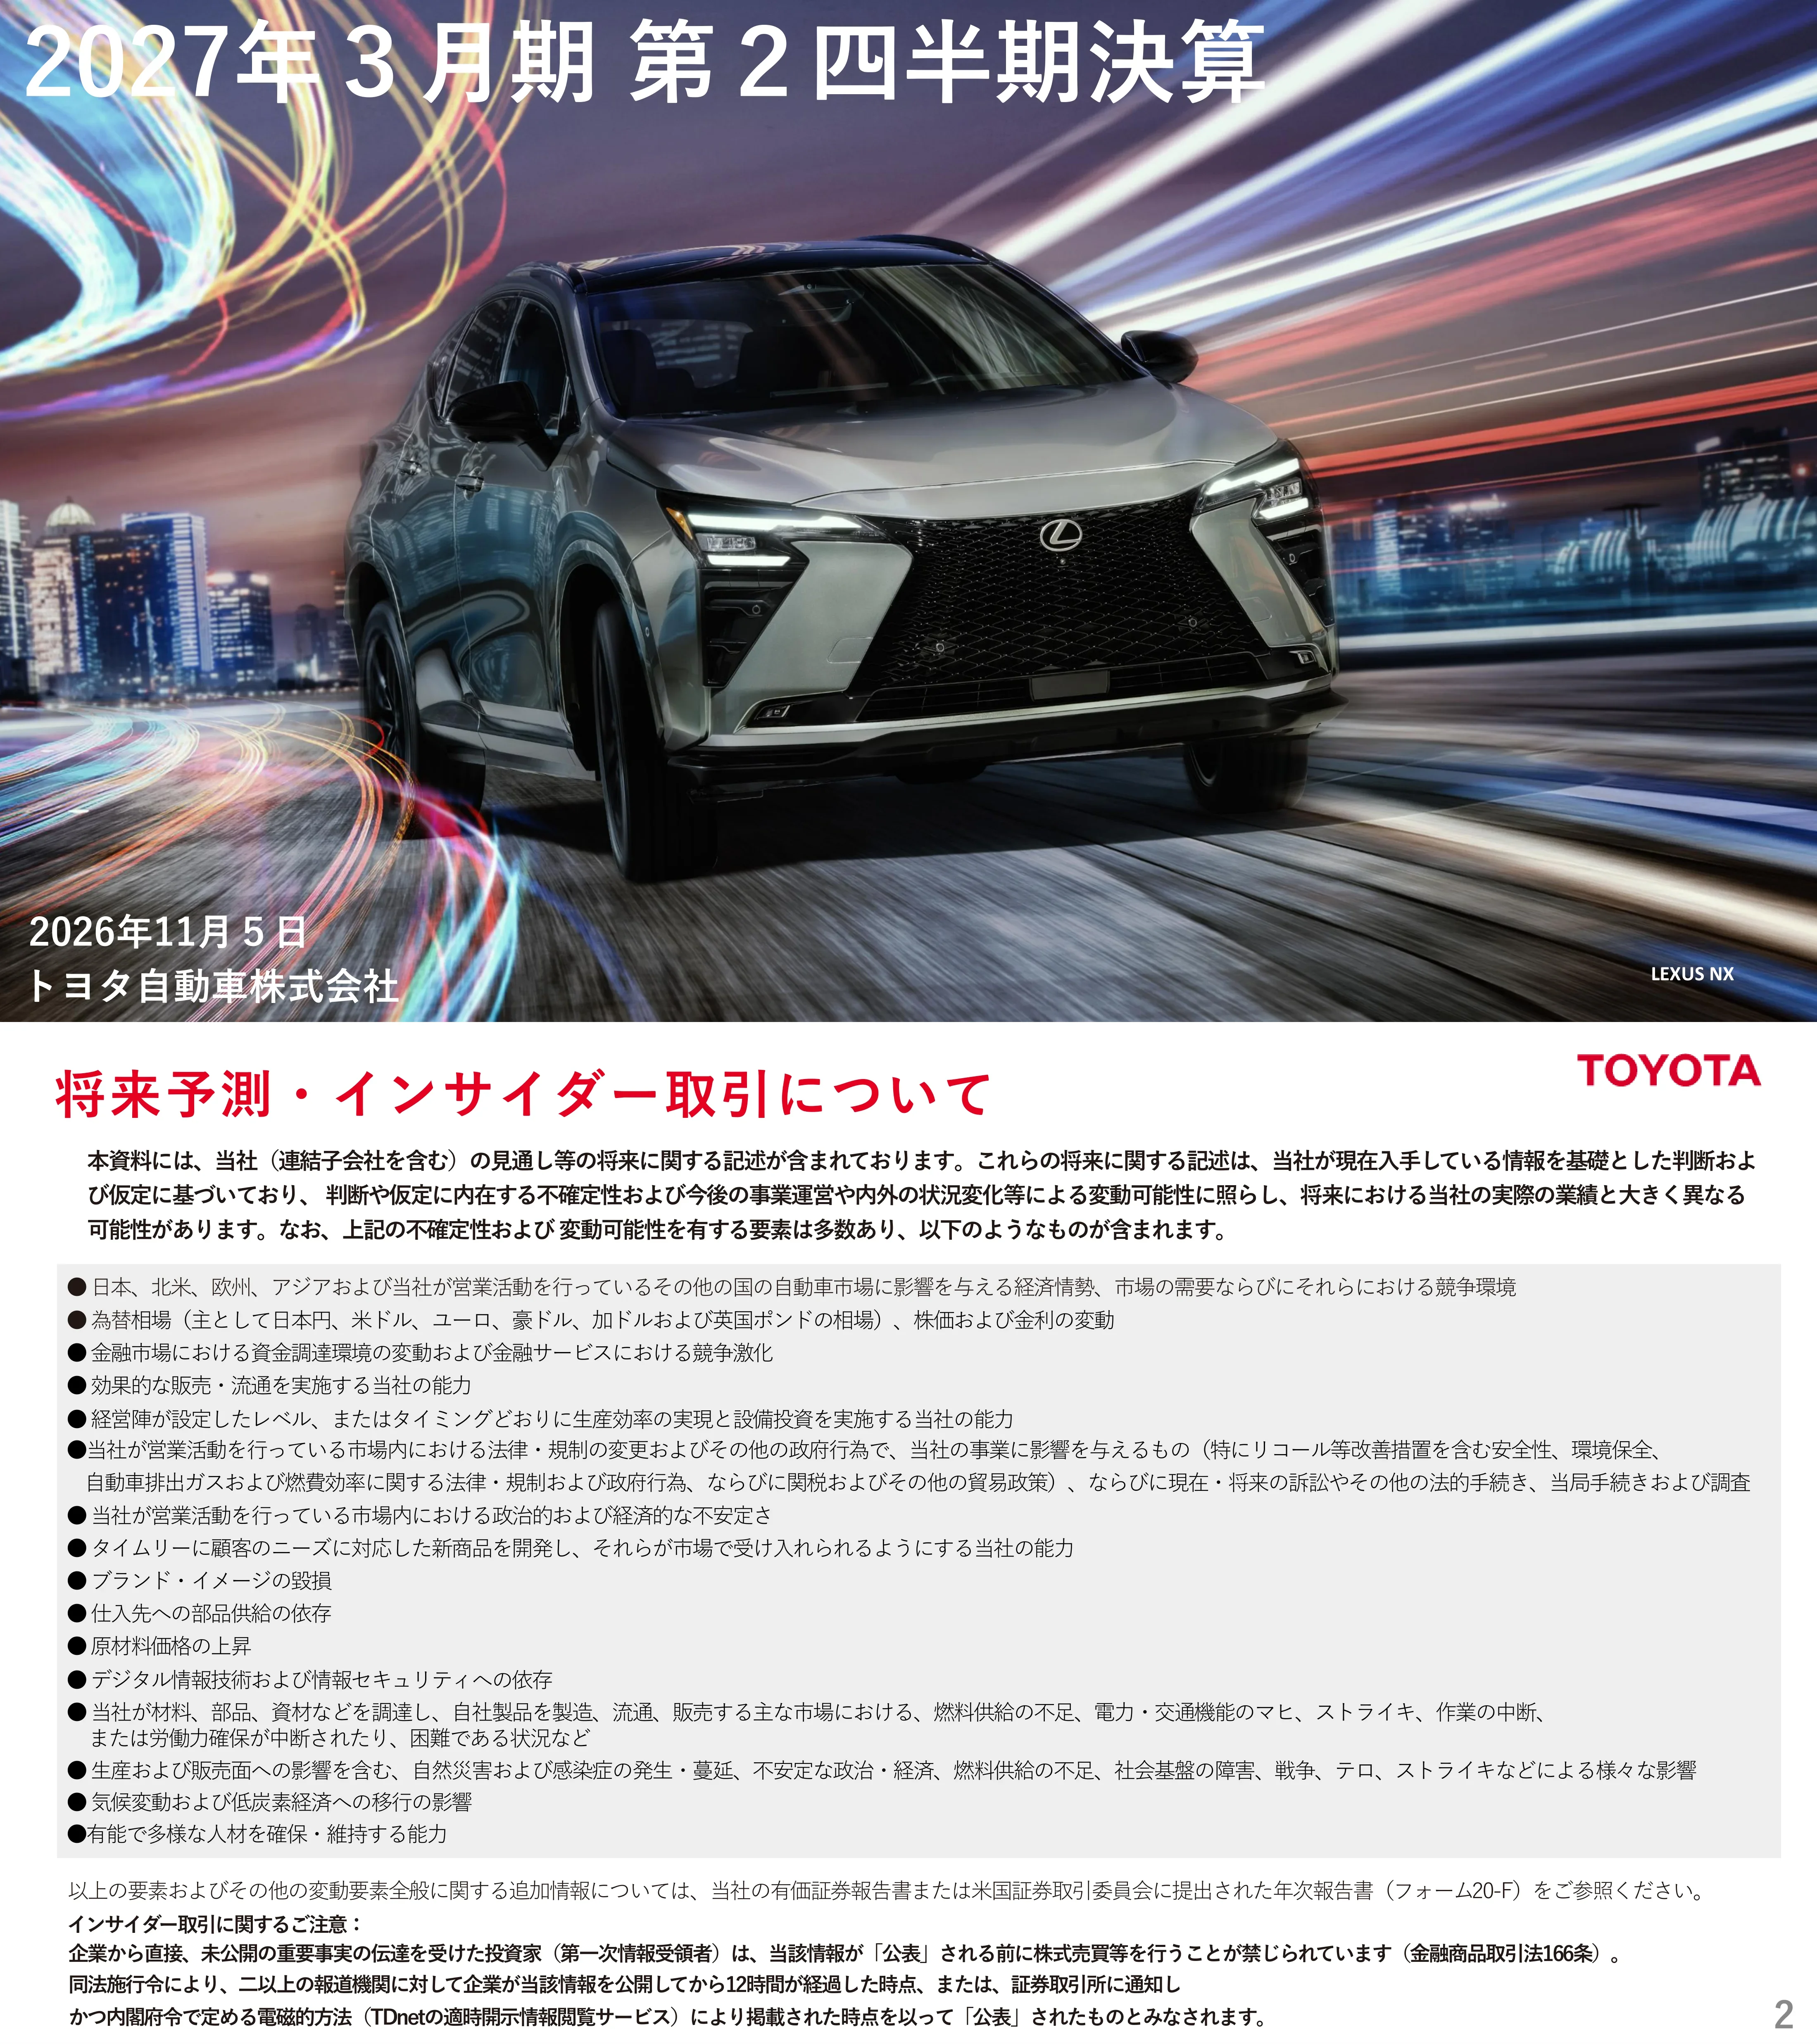
Title slide dated November 5, 2026, from Toyota Motor Corporation, with a full-bleed photo of a Lexus NX against light-trail city streaks.
Full-bleed hero photograph with large white title text top-left and date and company name bottom-left.
Legal disclaimer listing risk factors (markets, FX, financing, regulation including tariffs, supply chain, raw materials, disasters, climate transition, talent) and a notice that information counts as public once posted on TDnet, under Article 166 of the Financial Instruments and Exchange Act.
Red title, bold intro paragraph, grey box with a bulleted list of risks, and footer text on insider-trading rules.
Headline: steady improvement despite tough competition, higher profit year on year and an upgraded outlook. H1 operating income ¥2.2 trillion (+¥0.2 trillion); full-year forecast ¥3.9 trillion (+¥0.5 trillion vs. prior forecast, +¥0.1 trillion vs. last year); interim dividend ¥50 (+¥5), annual forecast ¥100; buyback ceiling up ¥300 billion to ¥1.3 trillion; additional 1 billion shares cancelled (1.2 billion this year).
Three red label blocks on the left (H1 results, full-year outlook, shareholder returns) with bullet text on the right, key phrases highlighted in red.
Section break introducing the results for the second quarter of the fiscal year ending March 2027.
Centered red title on white with the Toyota logo top-right.
Consolidated sales 4,758 thousand units vs. 4,783 (99.5%): Japan 1,024 (105.6%), North America 1,530, Europe 589 (102.8%), Asia 857, Other 758 (88.8%). Toyota/Lexus retail sales 5,059 (96.0%); electrified vehicles 2,811 (55.6% share, +14.2%), including HEV 2,450, PHEV 130 and BEV 231 (227.4%).
Two stacked bar columns by region with year-on-year percentages, legend at right, and a retail sales table by powertrain below.
In ¥100 million: operating revenue 269,624 (+23,317), operating income 21,911 (+1,854, margin 8.1%), non-operating income 7,632, equity-method income 3,583, pre-tax income 29,544, net income attributable to owners 22,364 (+4,630, margin 8.3%). FX ¥159/USD and ¥184/EUR, 13 and 16 yen weaker.
Financial table with prior-year, current (red-outlined) and change columns, plus an FX-rate block.
Bridge from 20,056 to 21,911 (¥100 million): FX +6,850, cost reduction efforts -3,400 (materials -4,650 including Middle East -1,250, cost reduction +1,250), marketing efforts +1,650 (Middle East -850), fixed costs -200, other -3,046. Excluding FX and swaps: -1,950.
Waterfall chart with red increases and grey decreases, callout boxes, and four breakdown tables for footnoted items underneath.
Excluding swap valuation (¥100 million): Japan 12,572 (+1,387, 10.7% margin), North America 1,320 vs. -1,341 (+2,662), Europe 2,077 (+132), Asia 4,340 (-111), Other 2,158 (+167). Consolidated unit volumes and income including swaps are shown for each region.
Five paired bar groups (prior grey, current red) with arrow callouts for the change, unit-volume dot lines above, and a grey data strip below.
China: consolidated subsidiaries' operating income fell from 1,222 to 650 and equity-method income from 480 to 286 (¥100 million); Toyota/Lexus sales 685 thousand (74.9%). Financial services operating income rose from 3,773 to 4,423 (+649) on higher loan balances.
Split slide: stacked bars with a volume line on the left, simple two-bar comparison on the right.
Section break introducing the full-year forecast.
Centered red title on white.
Full-year consolidated sales forecast unchanged at 9,700 thousand units (Japan 1,640, North America 1,740, Europe 1,220, Asia 3,000, Other 2,100) vs. 9,595 last year. Toyota/Lexus retail cut to 10,300 from 10,500; electrified vehicles 5,741 (55.7%), with BEV trimmed to 463 from 533.
Three stacked bars (previous forecast, current forecast, prior year) with ratios, plus a retail powertrain table.
Forecast in ¥100 million: revenue 535,000 (-5,000), operating income 39,000 (+5,000, margin 7.3%), pre-tax income 49,600, net income 35,700 (+3,200), dividend ¥100. Assumed FX ¥157/USD and ¥182/EUR. Prior year: revenue 506,849, operating income 37,662.
Table comparing previous forecast, current forecast (red outline), change and prior-year actual.
From 37,662 to 39,000 (+1,338): Middle East impact -5,050, raw-material prices -9,800, improvement efforts +10,850 (marketing +8,600, cost reduction +2,250), FX +7,350, fixed costs +1,250, other -3,262.
Simplified waterfall chart with a red-outlined callout for improvement efforts.
Section break for dividends and share buybacks.
Centered red title on white.
Policy of stable, continuous dividend increases for long-term shareholders. Annual dividend rose from ¥60 to ¥75, ¥90, ¥95 and a forecast ¥100; interim ¥50 (+¥5). Total interim dividend payout 5,889 (¥100 million).
Bullet statements at the top, stacked bar chart of interim and year-end dividends over five years, payout table at the bottom.
Buyback ceiling raised by ¥300 billion to ¥1.3 trillion to meet shareholders' sale requests; 1 billion shares cancelled (1.2 billion this year, about ¥3.5 trillion at end-September prices). History: 2,999, 10,999, 1,999, 36,568 (including the Toyota Industries tender offer) and 13,000 (¥100 million).
Three bullet statements over a bar chart with a broken axis for the outsized prior-year bar.
Section break introducing the strategy update on business structural reform.
Centered red title on white.
New-vehicle business combined with value-chain business (FY2026: 10.5 million units, ¥3.8 trillion operating income), plus robotics (factory automation FA1.0–3.0) and new domains (space, land-sea-air with Lexus Journey and Joby). The base is unchanged principles: ever-better cars, carbon neutrality by 2050, people first.
Framework diagram: two red-headed panels joined by × and + symbols, concentric circle for the value chain, photos of FA stages, and a navy foundation band.
Five-brand strategy led by Century to cover a wide range of customer needs; maximize existing capacity and marginal profit per vehicle. Global sales grow from 10.5 million units in 2025 toward 2030; electrified sales rise from HEV 462 / PHEV 18 / BEV 24 (2025) to HEV 501 / PHEV 27 / BEV 46 (2026, ten-thousand units).
Left half: brand-positioning diagram and pillars graphic; right half: 2025 vs. 2030 bar chart with an electrified sales box.
North America swung to an operating loss of 2,986 (¥100 million) in FY2026 on tariffs, after 5,249 two years earlier. Recovery levers: lower attrition (25% to 12%), 96.4% utilization, HEV share rising to 15.6%, inventory days down 70% and incentives down 60%, HEV battery output in North Carolina, Tacoma production moved to Texas, and more robotics.
Three-column layout with red chevron headers; small bar and line charts, a US map, factory photos, and a profit history chart on the right.
Toyota's China share fell from 9.1% and stabilized at 7.8% as NEVs grew. Locally developed NEVs (bZ3X, bZ5, bZ7) roll out, with a counter-offensive from 2027 using JV partners GAC, FAW and BYD, Chinese chief engineers, competitive local suppliers and an 18-month shorter lead time.
Three panels: market and share chart, a four-step learning list with a cycle graphic and Gantt bars, and a sales/powertrain pie and bar chart.
A new multi-pathway platform (Innovative Multi-pathway Vehicles) covers A–C segments with HEV, BEV, PHEV and ICE/carbon-neutral fuels; A–C is about 60% of Asia, with BEVs at 23%. China lessons spread to Asia and the Global South, where Toyota sells 1.5 million A–C cars and 600,000 IMV vehicles.
Two red chevron headers over bullets; platform chassis image with powertrain icons, donut chart, world map and 3D bar chart.
Value-chain profit grows by about ¥150 billion a year from ¥1.0 trillion (FY2021) to ¥2.1 trillion (FY2026) and onward to FY2031, as vehicles in use rise from 120 million to 150 million and 180 million, with higher capture rates and longer retention. Services include extended warranty, prepaid maintenance, KINTO and SDV.
Left: formula of three red boxes multiplied together, with small charts and service tiles; right: three-bar growth chart with arrows.
Toyota pre-empts technology, talent and opportunity through ¥510 billion of commitments across 100+ partners: Woven Capital (¥250 billion), Toyota Ventures (¥120 billion), Toyota Invention Partners (¥100 billion) and a ¥40 billion future fund, in AI, robotics, quantum, semiconductors, space and energy.
Lifecycle chevrons across the top, nested rounded boxes for investment vehicles, photos of an air taxi, robotaxi and rocket, and summary bars at the bottom.
Vision of robots that work alongside people and contribute to the mass production of happiness, spanning the factory automation domain (craftsmanship, TPS, robots) and daily life (life partners, delivery, household tasks).
Vision statement box at the top, two domain panels with circular arrows between them and six photos.
FA1.0 rule-based robots, FA2.0 synchronized logistics and FA3.0 human-robot collaboration, built on a factory control platform (50% shorter lead time), Arene software, reliable hardware, a robot foundation model and data from 60 plants and 18,000 skilled workers.
Top row of three FA stage photos; stacked colored strength bands below.
Internal factory-automation demand from Toyota, the group and suppliers: 400,000 robots from 2028 to 2040 (150,000 in the group, 250,000 at suppliers) and about ¥1 trillion a year of replacement investment. Sales grow from 2030 to 2035 and then expand to other industries. A dedicated Toyota Robotics organization launches in January 2027.
Two grey panels: KPI tiles with photos on the left and an illustrative rising sales chart on the right; bold closing statement at the bottom.
ROE is used as the gauge of progress toward a mobility company: grow profit by investing in new vehicles, the value chain, robotics and land-sea-air, while deliberately managing equity through buybacks and steady dividend increases, backed by emergency reserves that take credit ratings into account.
ROE fraction graphic on the left; balance-scale diagram on the right weighing growth investment against returns.
Priority order: emergency funds and financial soundness, capex and R&D, growth investment, steady dividend increases, then flexible buybacks. Over FY2021–FY2025, ¥38 trillion was allocated (net cash 15, capex/R&D 16, returns 7); FY2026–FY2030 plans capex/R&D of 22, returns of 11–14 and reserves of 7 (trillion yen).
Numbered priority list on the left; two stacked bars comparing five-year periods on the right.
Detailed version of the full-year bridge: FX +7,350, cost reduction -11,000 (materials -13,250 including Middle East -3,450), marketing +7,000 (Middle East -1,600), fixed costs +1,250, other -3,262. Excluding FX and swaps: -2,750 (¥100 million).
Waterfall chart with callouts and four breakdown tables.
Forecast raised from 34,000 to 39,000: FX +200, cost reduction +50, marketing +1,400 (volume/mix +800, value chain +250), fixed costs +3,650, other -300. Excluding FX and swaps: +5,100.
Waterfall chart with breakdown tables.
Q2 (July–September 2026) consolidated sales 2,364 thousand units vs. 2,372 (99.7%); Japan 500 (102.3%). Toyota/Lexus retail 2,507 (95.6%); electrified 1,401 (55.9%, +16.1%), BEV 117 (215.5%).
Stacked regional bars with ratios and a retail powertrain table.
Q2 in ¥100 million: revenue 134,370 (+10,596), operating income 11,276 (+2,881, margin 8.4%), non-operating loss -1,371, pre-tax income 9,905 (-2,354), net income 7,594 (-1,726). FX ¥159/USD, ¥183/EUR.
Financial table with the current quarter outlined in red.
Q2 bridge from 8,395 to 11,276: FX +3,400, cost reduction -2,550 (materials -3,250 including Middle East -1,000), marketing +950, fixed costs +1,700, other -619. Excluding FX and swaps: +100.
Waterfall chart with callouts and breakdown tables.
Q2 excluding swaps: Japan 7,185 (+2,434, 12.1%), North America 67 vs. -704 (+772), Europe 944 (-26), Asia 2,245 (+1), Other 1,148 (+141) (¥100 million).
Paired regional bars with arrow labels and volume dot lines, data strip below.
China subsidiaries' operating income 235 (-436) and equity-method income 125 (-120); Toyota/Lexus sales 361 thousand (77.8%). Financial services operating income 2,125 (+232) (¥100 million).
Split comparison charts, matching page 9.
Five-year trends: consolidated sales 8,822 to 9,700 thousand; revenue ¥37.2 trillion to ¥53.5 trillion; operating income peak 53,529 in FY2023 to 39,000 forecast; net income 35,700; R&D 16,000; capex 23,000; depreciation 16,500; total liquidity and shareholder returns (¥100 million).
Eight small-multiple bar charts in a 4×2 grid, forecast bars in red, with footnotes.
Toyota/Lexus production forecast cut to 9,800 thousand (Japan 3,400, overseas 6,400); retail sales 10,300 (Japan 1,550, overseas 8,750); group retail 10,990 (-190).
Table of previous forecast, current forecast (red outline), change and prior year.
Flow diagram showing how consolidated sales, Toyota/Lexus sales and group total sales are defined across Toyota and Lexus vehicles (including non-consolidated Chinese JVs) and Daihatsu-brand vehicles, through distributors to customers.
Left source panels with brand logos, vertical red bars for each metric, arrows to the customer box.
Częste pytania dotyczące tego slajdu i podstawowej treści prezentacji.
The deck is in Japanese. It is Toyota's 決算報告プレゼンテーション資料 (earnings presentation materials) for the second quarter of the fiscal year ending March 2027, released on November 5, 2026 on TDnet, the Tokyo Stock Exchange's Timely Disclosure network. The page-by-page guide on this page is in English, and figures are kept in Toyota's own units.
Toyota's fiscal year runs from April to March, and the company names it after the closing month: 2027年3月期 means the fiscal year ending March 2027. Here, FY2026 refers to that same year, April 2026 to March 2027. H1 is the first six months, April to September 2026, which Toyota reports as its second-quarter cumulative results.
Most tables are in 億円 (¥100 million). For example, H1 operating income of 21,911 means about ¥2.19 trillion, and the full-year forecast of 39,000 means ¥3.9 trillion. Headline slides use 兆円 (trillion yen). The symbol △ means a negative number.
H1 revenue was 269,624 and operating income 21,911 (¥100 million), up 1,854 year on year with an 8.1% margin. The full-year operating income forecast was raised by 5,000 to 39,000 on lower tariff costs and value-chain gains, while revenue guidance was trimmed to 535,000 and the US dollar assumption moved to ¥157.
The interim dividend rises ¥5 to ¥50 and the annual forecast is ¥100. The share buyback ceiling increases by ¥300 billion to ¥1.3 trillion for the year, and 1 billion more treasury shares will be cancelled, bringing this year's total to 1.2 billion shares.
Slides 17 to 29 cover business restructuring: the five-brand lineup, a North America recovery plan after tariff-driven losses, China NEV launches from 2027, a multi-pathway platform for Asia and the Global South, value-chain profit growing about ¥150 billion a year, ¥510 billion in venture commitments, a robotics business with a new Toyota Robotics unit in January 2027, and an ROE-based capital allocation plan.
Yes, as design reference. The deck has clean waterfall bridges, paired regional bar charts, small-multiple KPI dashboards and strategy frameworks in a restrained red-and-grey palette. These layouts suit any quarterly earnings or investor update. Use your own data and branding.
Toyota usually publishes English IR materials on its global investor relations site. This page hosts the original Japanese TDnet version, with an English slide-by-slide guide to help non-Japanese readers follow every chart and table.
Official IR site with financial results, presentations and the English-language materials.

Create Your Own Slides
Turn your ideas into professional presentations in seconds with 2slides AI.
Odwołuj się do profesjonalnych projektów, wybierz swój styl i generuj slajdy z idealnym renderowaniem tekstu. Napędzane przez Nano Banana—zacznij tworzyć swoją prezentację teraz.
Twój Agent AI dla slajdów. Oszczędzaj czas, błyszcz szybciej dzięki inteligentnemu tworzeniu prezentacji.


© 2026 2slides. Wszelkie prawa zastrzeżone.