
Należy do zbioru Przykłady prezentacji dla inwestorów · Przykłady prezentacji dla inwestorów z Japonii · Przykłady prezentacji dla inwestorów spółek półprzewodnikowych
SUMCO Q3 FY2026 Earnings Presentation is the Japanese-language results briefing deck (2026年12月期 第3四半期 決算説明会資料) that SUMCO Corporation, a silicon wafer maker for semiconductors, released on TDnet, the Tokyo Stock Exchange timely-disclosure service, on 11 November 2026. SUMCO's fiscal year is the calendar year, so the quarter covers July to September 2026. The 23 slides cover the market backdrop, Q3 results, the Q4 forecast and a quarterly trend appendix.
Używa okładki tej prezentacji jako wzoru stylu dla slajdów tworzonych z Twojej treści. Możesz też wybrać dowolną stronę poniżej i użyć jej układu jako wzoru.
Szybka Nawigacja
Tagi
Udostępnij slajdy
SUMCO Q3 FY2026 Earnings Presentation is the Japanese-language results briefing deck (2026年12月期 第3四半期 決算説明会資料) that SUMCO Corporation, a silicon wafer maker for semiconductors, released on TDnet, the Tokyo Stock Exchange timely-disclosure service, on 11 November 2026. SUMCO's fiscal year is the calendar year, so the quarter covers July to September 2026. The 23 slides cover the market backdrop, Q3 results, the Q4 forecast and a quarterly trend appendix.
Szczegółowy widok każdej strony slajdu, w tym układu, kluczowej treści i elementów wizualnych.
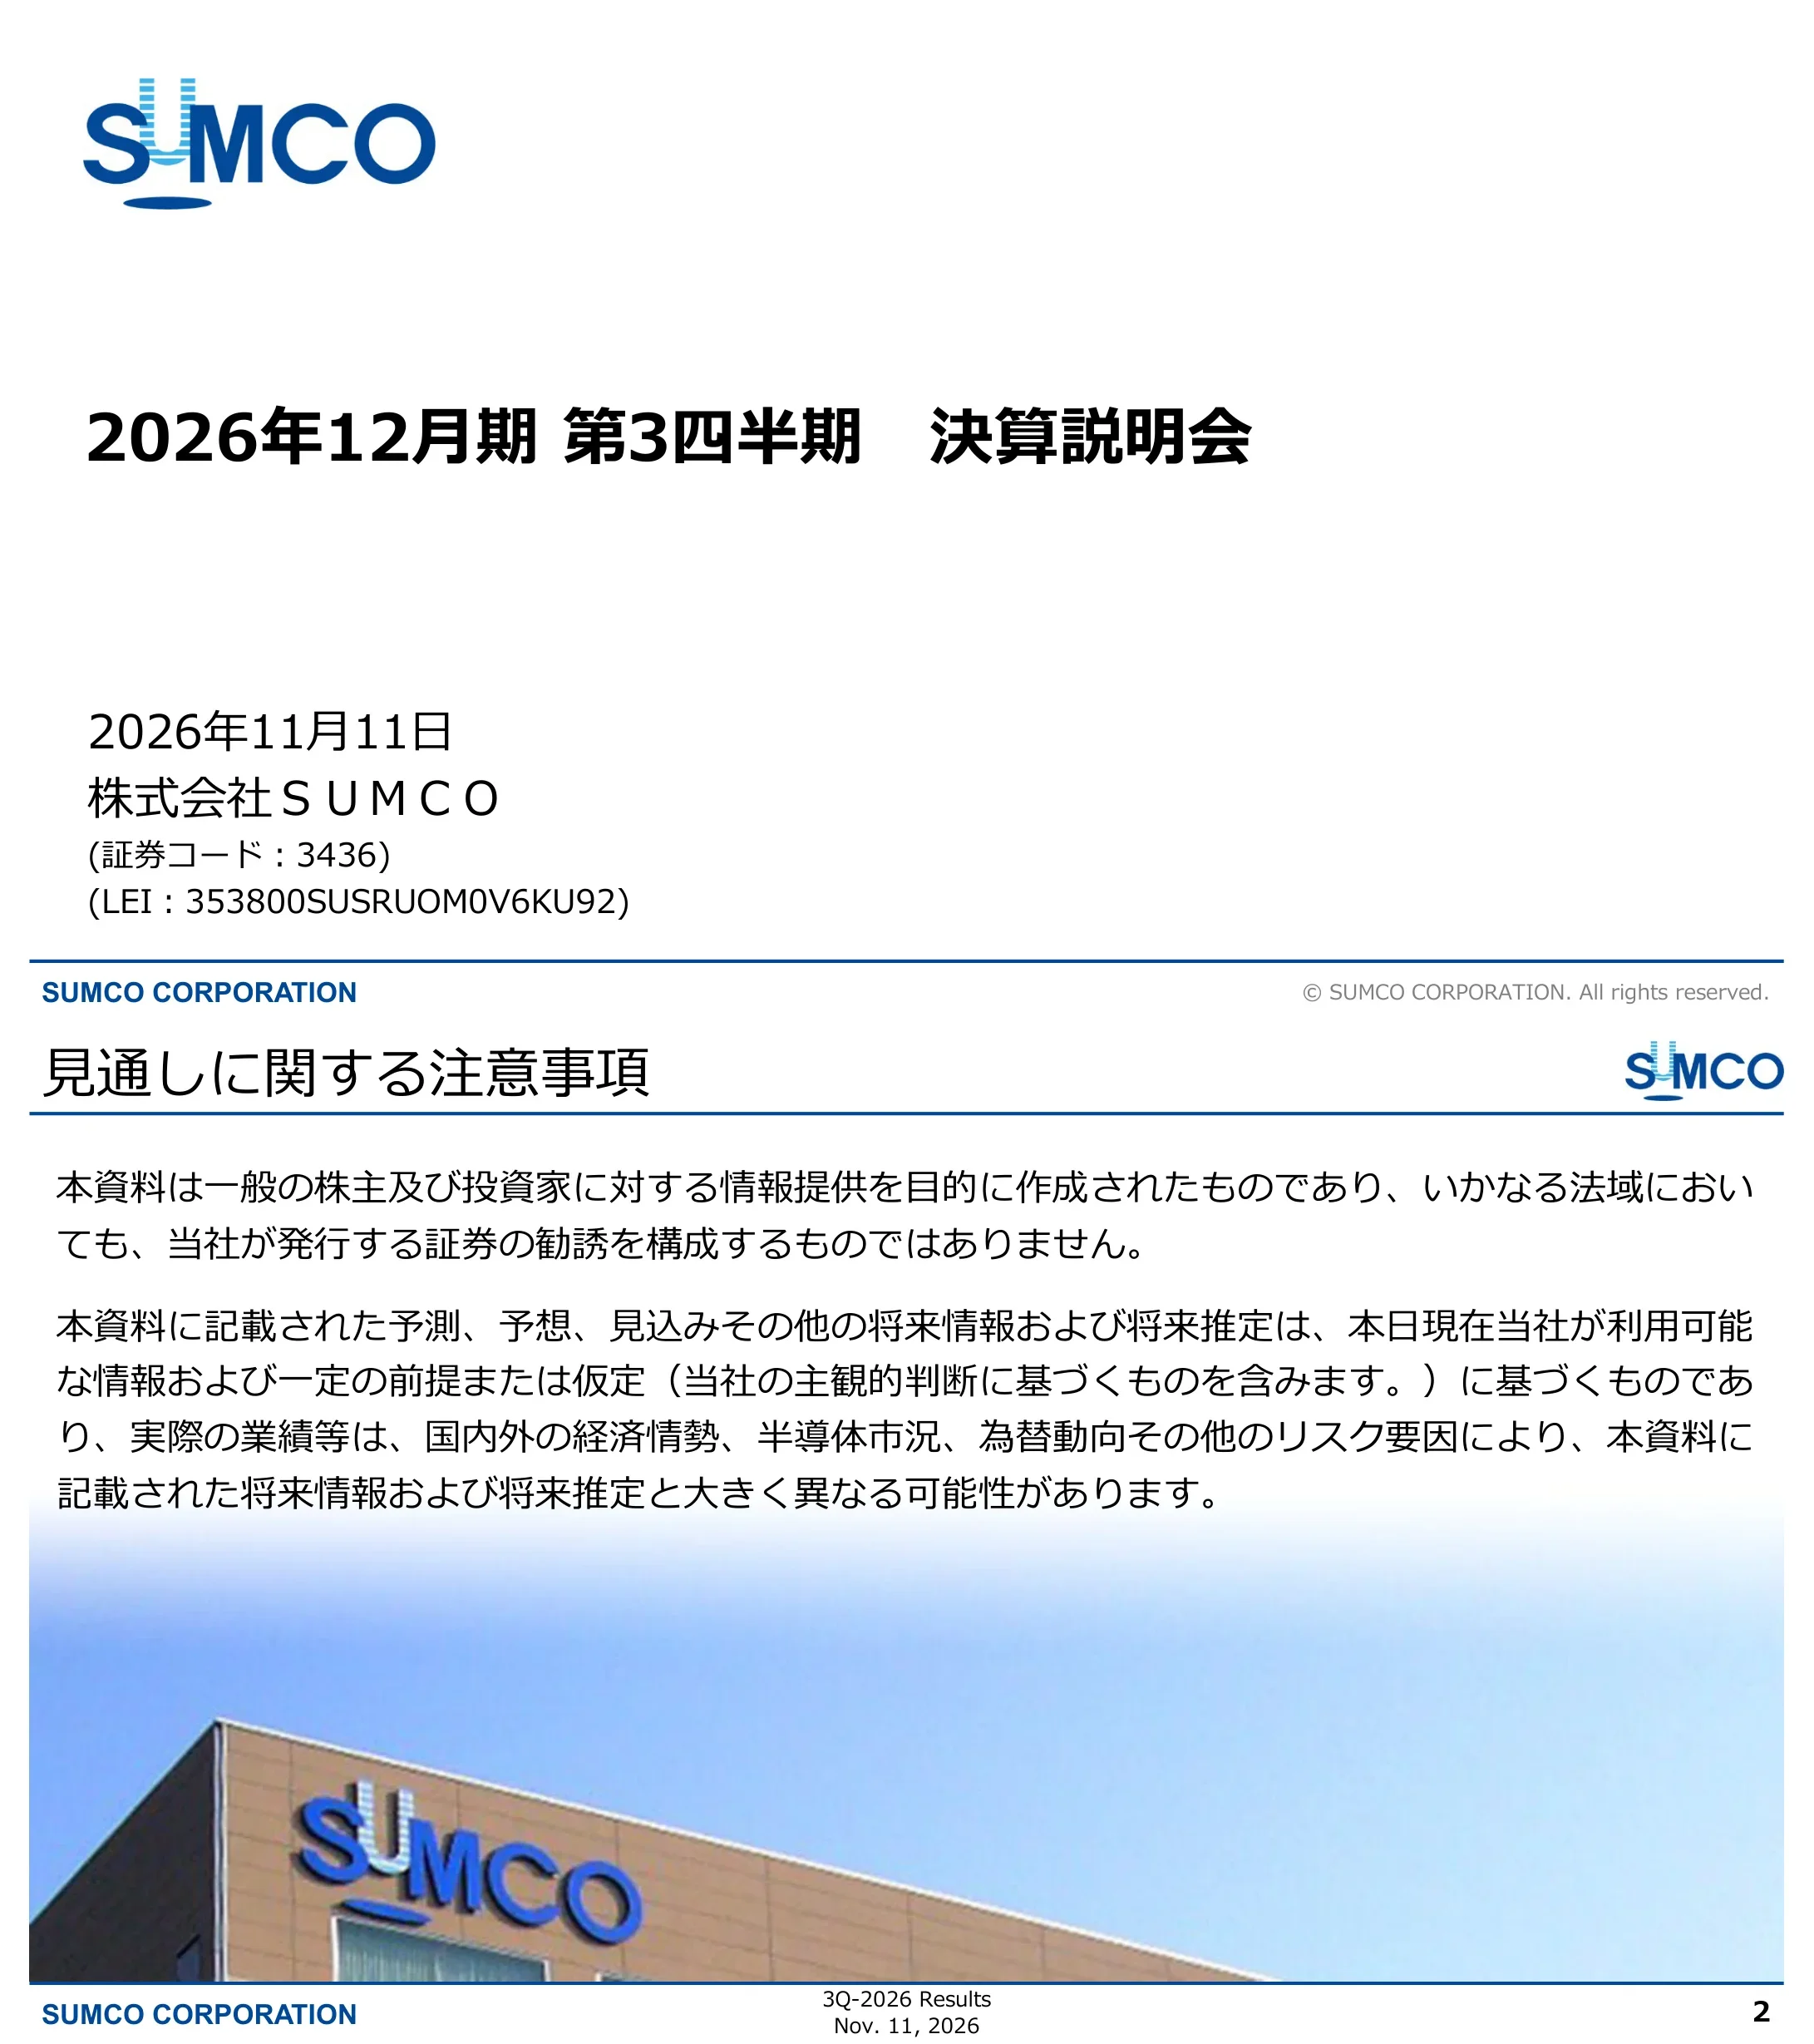
Title slide of SUMCO Corporation's earnings briefing for the third quarter of the fiscal year ending December 2026, dated 11 November 2026. It shows the Japanese securities code 3436 and the company's LEI.
Logo at top left, large bold left-aligned title in the middle, and date, company name and identifiers stacked at bottom left above a blue footer rule.
Standard disclaimer: the material is for information only and is not a solicitation to buy securities in any jurisdiction. Forecasts and other forward-looking statements rest on information and assumptions available today and actual results may differ materially due to economic conditions, the semiconductor market, exchange rates and other risks.
Two paragraphs of text at the top over a full-width photo of the SUMCO-branded building against a blue sky.
Lists the deck's sections: summary and market environment; Q3 FY2026 results (consolidated), covering results, operating-profit analysis, and balance sheet and cash flow; Q4 FY2026 forecast (consolidated), covering the forecast and operating-profit analysis; and reference material.
Bulleted two-level list on the left with square blue markers; a monochrome photo of silicon ingots and wafers at bottom right.
Section divider for the summary and market environment part, presented by the Representative Director and President (named on the slide as Jiro Tatsuta).
Mostly blank white slide with a bold section title at the middle left and the presenter's title and name below.
Q3 net sales were 1,175 (units of ¥100 million, 億円) against a forecast of 1,180; operating profit was 20 against 0; ordinary profit 23 against 10; net profit attributable to owners of the parent 54 against 0; EBITDA margin 29.8% (forecast 28.6%) at ¥161.0/US$. The Q4 forecast is net sales 1,070, operating profit 10, ordinary profit 45, net profit 40 and EBITDA margin 30.0% at ¥160.0/US$. A note says FST was moved from consolidated subsidiary to equity-method affiliate after a partial share sale announced on 27 August 2026, effective 30 September 2026, so Q4 guidance excludes FST sales and operating profit.
Two side-by-side comparison tables (Q3 forecast vs actual; Q3 actual vs Q4 forecast) with red triangles for decreases, and a text note box below.
Dividend history by fiscal term. Annual dividend per share: ¥81 (term 24, Dec 2022), ¥55 (term 25), ¥21 (term 26), ¥20 (term 27, Dec 2025) and a forecast of ¥20 for term 28 (Dec 2026), split ¥10 interim and ¥10 year-end. Total annual dividends were 283, 192, 73 and 70, with 70 forecast for Dec 2026 (units of ¥100 million). Dividends are decided with profit level, outlook, capital spending needs, free cash flow, EBITDA and distributable funds in mind.
Single wide table with five term columns, the forecast column outlined in a red box, and a one-sentence policy note beneath.
Two line charts of quarterly wafer volume (thousand wafers per month, SUMCO estimate) for 2019 to 2026. The 300mm chart shows 2026 as the highest line, rising from about 7,800 in Q1 to about 9,000 in Q3. The 200mm chart shows 2026 around 3,900 to 4,500, below the 2019 to 2022 levels but above 2025.
Two side-by-side line charts, each with a multi-year legend, the 2026 series in bold red.
Combined chart of major customers' 300mm wafer inventory, showing input volume, purchase volume, inventory volume and inventory months from Q1 2014 to Q3 2026 (SUMCO estimate). Inventory surged from 2023, peaked around 2025 Q4 to 2026 Q1, and has declined over the latest quarters. No numeric axis values are shown.
One full-width combo chart with bars (blue, light blue, green) and a navy line with markers, with a legend box at top left.
Splits the customer inventory estimate into wafers for logic and wafers for memory, with the same four series over 2014 to Q3 2026. The logic inventory has fallen from a peak in the last few quarters; the memory inventory has stayed elevated but eased slightly. No axis values are given.
Two stacked combo charts, logic above and memory below, each with its own legend and shared quarterly axis.
Q3 2026 actual: 300mm shipments rose sharply on strong advanced logic and memory demand; 200mm demand for AI-related power devices is picking up; long-term agreement (LTA) prices were maintained. Q4 forecast: 300mm demand led by AI is outstripping supply, and 200mm is expected to exceed current supply; extra demand will be met on existing customer relationships and prices. Outlook: the semiconductor market should keep growing on AI, but expanding 300mm capacity is not economically justified at current prices and costs and would take years, so supply and demand should tighten further.
Three blue-square headed text blocks (Q3 actual, Q4 forecast, outlook), each with volume and price bullets.
Four checkmarks: training compute is rising, agentic AI increases inference compute, AI servers drive overall server growth, and AI servers use high-performance advanced logic. The left chart shows compute for training and inference growing from 2025 to 2029. The right chart shows server shipments (million units) rising from about 14 in 2025 to about 21 in 2029, with general-purpose servers flat near 10 to 11 and AI servers (training and inference) growing. Source: research-firm data, SUMCO estimate.
Checklist at top; below, a stacked area chart on the left and a stacked bar chart on the right.
Explains that AI servers use advanced GPUs and CPUs: the GPU handles massive parallel computation for AI training and inference while the CPU controls the whole server system. Each is built from chiplets made at the process generation best suited to each function, then combined on an interposer. Labels include GPU core at 3nm to 2nm, I/O at 5nm and HBM for GPU; CPU core at 2nm to 1.4nm, cache at 3nm and I/O at 7nm.
Two-column boxed diagram (GPU left, CPU right), each an isometric illustration of chiplets flowing onto an interposer, under a two-point checklist.
Chiplet-based GPUs and CPUs increase wafer demand across a wide range of process generations. A stacked area chart (thousand wafers per month) shows server-logic wafer demand rising from about 280 in 2025 to about 760 in 2029, split into 7nm, 5nm, 3nm, 2nm and 1.4nm. The company states it will upgrade manufacturing equipment to better respond to growing advanced-product demand. Source: research-firm data, SUMCO estimate.
Centered stacked area chart with a legend inside the plot, a checkmark sentence above and an arrow conclusion below.
Divider for the consolidated Q3 results section, presented by the Representative Director, Vice President and Chief Financial Officer (named on the slide as Shinichi Kuboizoe).
Blank slide with a two-line bold title in the middle and the presenter's title and name below.
Nine-month net sales were 3,325 (+281 vs 3,044) with quarterly figures 1,014, 1,136 and 1,175 (units of ¥100 million). Operating profit was a loss of 43 for nine months (Q3: +20) versus profit of 58 a year earlier. Q3 included an extraordinary gain of 136 from the sale of FST shares and an extraordinary loss of 37 from ending wafer production at the Miyazaki plant. Q3 net profit attributable to owners was 54 (nine months: loss of 74). EBITDA was 350 in Q3 and 889 for nine months; Q3 EBITDA margin 29.8%; FX ¥161.0/US$; Q3 EPS ¥15.65. A footnote gives sensitivity of about ¥1.2 billion (12 億円) of annual operating profit per ¥1 move against the dollar.
A dense full-width table with columns for 2025 nine-month, 2026 Q1, Q2, Q3, nine-month total and change, plus four footnotes below.
Quarter on quarter, operating profit improved by 31 from a loss of 11 to 20: costs -31, depreciation -14, sales/production and other +71, FX effect +5. Year on year for nine months, operating profit fell by 101 from 58 to a loss of 43: costs -71, depreciation -157, sales/production and other +17, FX +110. Net sales rose +39 quarter on quarter (1,136 to 1,175) and +281 year on year (3,044 to 3,325).
Two columns, each with a small comparison table on top and a waterfall chart below using blue, pink and green bars and large arrows for the net change.
Between end-December 2025 and end-September 2026, cash rose by 455 to 1,207, total assets fell by 2,036 to 9,243, interest-bearing debt fell by 1,029 to 2,508, and net assets fell by 822 to 5,655 (units of ¥100 million). Equity ratio was 61.2% (51.3%); gross D/E 0.44; net D/E 0.23. Nine-month operating cash flow was 770, investing cash flow -289 and free cash flow 481, with dividends paid of 81 and cash increase of 455.
Balance sheet table on the left and cash-flow table on the right, both with blue headers and red negative values.
Divider for the Q4 forecast section of the fiscal year ending December 2026. No figures are shown.
Blank slide with a two-line bold title in the middle left and standard header and footer.
Full-year 2026 forecast: net sales 4,395 (+299 vs 4,096 in 2025), operating loss of 33 (vs profit of 13), ordinary loss of 53, net loss attributable to owners of 34, EBITDA 1,210 (margin 27.5%) at ¥159.1/US$ (units of ¥100 million). Q4 forecast: net sales 1,070, operating profit 10, ordinary profit 45, net profit 40, EBITDA 321 (margin 30.0%), EPS ¥11.50. A note says FST is excluded from consolidation from Q4.
A wide table with columns for 2025 actual, Q1 to Q3 actual, Q4 forecast, full-year forecast and change, plus FX sensitivity and FST notes beneath.
Quarter on quarter, operating profit goes from 20 in Q3 to 10 in Q4 (down 10): costs etc. -14, depreciation -25, sales/production and other +32, FX -3. Year on year, full-year operating profit goes from 13 in 2025 to a forecast loss of 33 (down 46): costs etc. -128, depreciation -168, sales/production and other +117, FX +133. A note says the FST effect is included in costs etc.
Mirrors page 16: two comparison tables above and two waterfall charts below with yellow down-arrows.
Divider introducing the appendix. No figures are shown.
Blank white slide with a single bold title at middle left and standard header and footer.
Chart of quarterly net sales, operating profit, EBITDA and EBITDA margin from Q1 2021 to the Q4 2026 forecast (units of ¥100 million). Net sales peaked at 1,174 in Q4 2022, fell to 935 in Q1 2024, and recovered to 1,175 in Q3 2026, with 1,070 forecast for Q4. EBITDA margin peaked at 39.4% in Q3 2022, hit 23.1% in Q1 2026, and is 29.8% in Q3 2026 with 30.0% forecast. Operating profit was 302 in Q3 2022 and 20 in Q3 2026.
One combo chart with yellow and blue bars for operating profit and EBITDA, purple line for net sales and red line for margin, grouped by fiscal year along the bottom.
Closing slide with the SUMCO logo and the Japanese tagline meaning that silicon wafers move the world. It contains no figures.
Centered logo with the tagline beneath on an otherwise empty white slide.
Częste pytania dotyczące tego slajdu i podstawowej treści prezentacji.
It is SUMCO's Japanese-language Q3 FY2026 results briefing (決算説明会資料), released on TDnet, the Tokyo Stock Exchange timely-disclosure service, on 11 November 2026. The company's fiscal year is the calendar year, so Q3 covers July to September 2026. The slide text is Japanese with a few English footers; this page describes it in English.
Q3 net sales were 1,175 (in units of ¥100 million, 億円), operating profit 20, ordinary profit 23 and net profit attributable to owners of the parent 54. EBITDA was 350 with a margin of 29.8% at an average rate of ¥161.0/US$.
The Q4 forecast is net sales 1,070, operating profit 10, ordinary profit 45 and net profit 40. For the full year the deck shows net sales of 4,395 and an operating loss of 33, against net sales of 4,096 and operating profit of 13 in 2025.
The deck says SUMCO sold part of its holding in FORMOSA SUMCO TECHNOLOGY CORPORATION (FST), announced on 27 August 2026, and reclassified FST from a consolidated subsidiary to an equity-method affiliate as of 30 September 2026. FST's sales and operating profit are therefore not in the Q4 consolidated forecast.
The forecast annual dividend for the year ending December 2026 is ¥20 per share (¥10 interim and ¥10 year-end), about 70 in total (¥100 million units), the same as the prior year. The slide lists the earlier years back to 2022 for comparison.
It covers seasonal wafer volumes for 300mm and 200mm, estimated customer 300mm wafer inventory for logic and memory, and the effect of AI servers on advanced logic wafer demand. Company statements say 300mm demand is outstripping supply and LTA prices were maintained.
Yes. It follows a classic Japanese format: disclaimer, agenda, section dividers with presenter names, dense financial tables, waterfall bridges, market charts, an appendix trend chart and a logo closing slide, all in a consistent blue corporate style. Note that the content is the company's own disclosure and is not investment advice.
The tables and labelled charts are legible at slide resolution. The customer inventory charts on pages 8 and 9 have no numeric axes, so only their trends can be described, not values.

Create Your Own Slides
Turn your ideas into professional presentations in seconds with 2slides AI.
Odwołuj się do profesjonalnych projektów, wybierz swój styl i generuj slajdy z idealnym renderowaniem tekstu. Napędzane przez Nano Banana—zacznij tworzyć swoją prezentację teraz.
Twój Agent AI dla slajdów. Oszczędzaj czas, błyszcz szybciej dzięki inteligentnemu tworzeniu prezentacji.


© 2026 2slides. Wszelkie prawa zastrzeżone.