
Należy do zbioru Przykłady prezentacji konsultingowych
Oliver Wyman Global Travel Retail Pulse 2026 (Opportunities in customer growth): a 72-page consulting report deck published by Oliver Wyman with TFWA (Tax Free World Association) in September 2026, sizing the US$76 billion duty free and travel retail market, its US$5.0 billion post-COVID conversion gap, the shift of growth from APAC to Europe and to Gen Z travelers, and a discovery-led playbook (Invite, Surprise, Engage, Fix the basics) for airports, retailers and brands.
Używa okładki tej prezentacji jako wzoru stylu dla slajdów tworzonych z Twojej treści. Możesz też wybrać dowolną stronę poniżej i użyć jej układu jako wzoru.
Szybka Nawigacja
Tagi
Udostępnij slajdy
Oliver Wyman Global Travel Retail Pulse 2026 (Opportunities in customer growth): a 72-page consulting report deck published by Oliver Wyman with TFWA (Tax Free World Association) in September 2026, sizing the US$76 billion duty free and travel retail market, its US$5.0 billion post-COVID conversion gap, the shift of growth from APAC to Europe and to Gen Z travelers, and a discovery-led playbook (Invite, Surprise, Engage, Fix the basics) for airports, retailers and brands.
Szczegółowy widok każdej strony slajdu, w tym układu, kluczowej treści i elementów wizualnych.
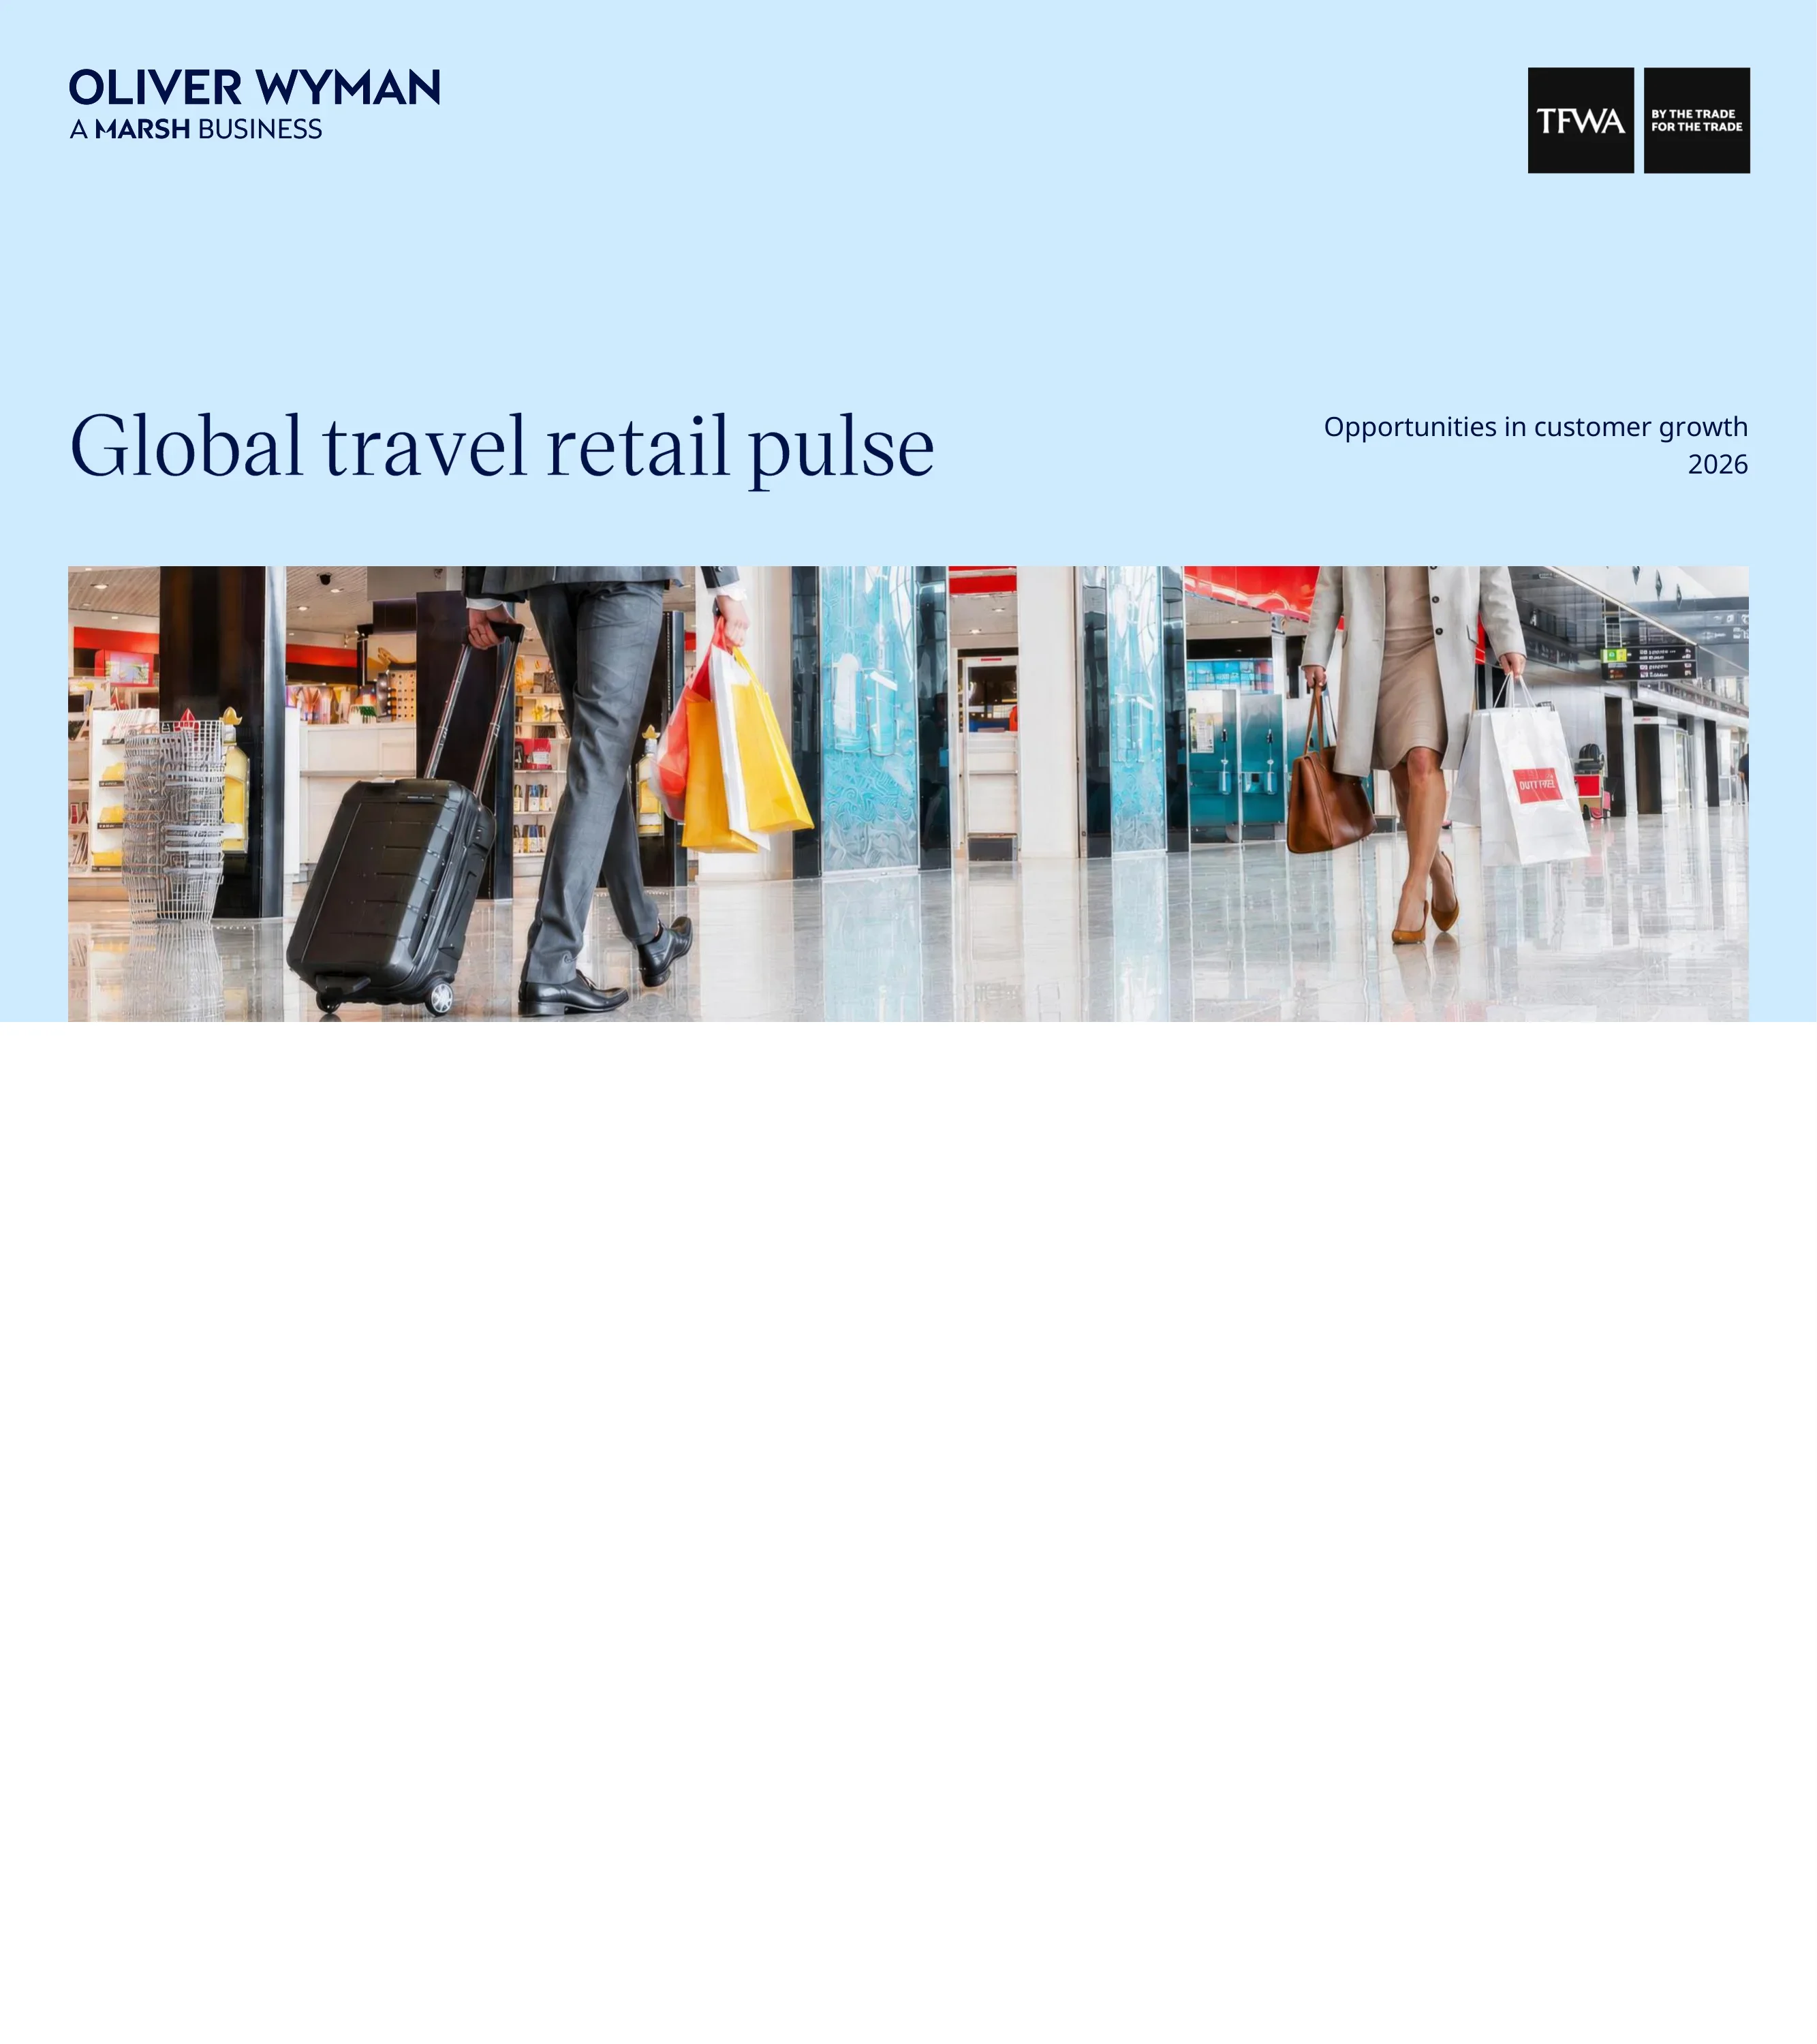
Cover slide with Oliver Wyman (A Marsh business) and TFWA logos, report title, subtitle and 2026 edition over a photo of travelers with shopping bags in an airport.
Light-blue cover with logos top, serif title left, subtitle right and full-width photo strip below
Intentionally blank page following the cover.
Empty white page
Standard Oliver Wyman confidentiality notice stating the approaches and insights are proprietary and should not be shared without written consent.
Single text block placed low-left on a white page
Foreword by Charlene Tourneaux, Managing Director of TFWA, citing an estimated US$5 billion gap versus 2019 conversion, a US$3.1 billion European surplus, APAC sales 17% below 2019, Millennials and Gen Z at 61% of airline travel spend (80% by 2035), 51% vs 80% price sensitivity, and 44% (49% Gen Z) immediate purchase after discovery.
Portrait photo and name block left, long-form letter text right
Foreword from partners Vincent Barbat, Pierre-Alexandre Koch and senior advisor Christophe Chaix arguing growth no longer translates automatically into spend and travel retail must give travelers a compelling reason to shop through discovery and value.
Three stacked portraits with names left, letter text right
Timeline of global DF&TR sales: US$62bn (2015), 86bn (2019), 43bn (2020), 50bn (2021), 61bn (2022), 72bn (2023), 74bn (2024), 76bn (2025), framed as boom, COVID disruption, subdued recovery and a new era driven by geography, traveler mix and discovery.
Four-phase timeline header with text columns above a bar chart, highlighted 2026+ panel
Methodology: 15 years of research, 3,825 respondents in the 2026 Global Travel Survey across Germany, France, UK, USA, Japan, Saudi Arabia, mainland China and India, 30+ senior executives surveyed, and 15 luxury-client projects in the past 12 months.
Four equal KPI columns with large numerals and captions
Executive summary part 1: passenger traffic grew 6.2% CAGR in 2023-2025 vs 2.7% for travel retail sales, leaving a US$5.0 billion gap; Europe generates a US$3.1 billion surplus; F&C weakness is concentrated in APAC; Millennials and Gen Z represent 61% of airline travel spend, reaching c.80% by 2035.
Photo with bold summary statement left, bulleted findings with bold highlights right
Executive summary part 2: the channel lost its captive audience, its surprise and its price edge; 80% of Baby Boomers vs 51% of Gen Z cite price as a key criterion; 44% of travelers buy immediately after discovery, 49% of Gen Z vs 35% of Baby Boomers.
Photo and summary statement left, nested bullet argument right
Executive summary part 3: shift from transaction-led to recruitment-based approach via Invite, Surprise and Engage, while keeping value credible as travelers still expect an average c.18% discount versus domestic retail, with Schiphol and Lagardere benchmarking prices against Dutch retailers.
Photo and summary statement left, bullets right
Preview of five executive interviews with pull quotes: Omar Hagi (Kering, p45), Joost Rosmuller (Mondelez, p53), Mette Engell (Coty, p57), Timothy Foster (Hugo Boss, p64) and Maurus Lienhard (Avolta, p68).
Five portrait cards in a row grouped by section, each with title and quote box
Section 1 divider introducing who and what will drive the next wave of travel retail growth.
Light-blue half with serif title and oversized section number, photo on right
OECD global Consumer Confidence Index fell to 97.6 versus a 98.6 average, yet 44% of 2026 respondents expect to travel (much) more and 45% feel more confident spending while traveling.
Line chart left with callout, blue panel right with two donut stats
US airline fares CPI reached 121.4 (2020 = 100), yet 79% of travelers state the same or (much) higher willingness to spend on airport/border duty free.
Line chart left, large ring gauge right
ACI passenger traffic by region rose from 2.2bn (2020) to 9.5bn (2024) and is forecast at 11.6bn by 2030F, with +33.9% CAGR 2020-23, +6.2% 2023-25 and +3.4% 2025-30; APAC grows 8.8% then 5.5%, Europe 5.9% then 3.3%.
Stacked bar chart split actual vs forecast, with CAGR pill columns on the right
DF&TR sales rise from US$43.2bn (2020) to 76.0bn (2025) and 89.6bn base case by 2030F (96.3bn under an APAC partial-reversal scenario, +4.9% CAGR), with Europe at 16.2% CAGR 2023-25 and APAC at -2.2%.
Stacked bar forecast chart with dashed scenario overlay, CAGR pills and a scenario note panel
Three questions framing section 1: geographies (Europe outperforms traffic growth), categories (fragrances and cosmetics and tobacco grow outside APAC, wines and spirits decline) and travelers (only 36% of Gen Z prefer airport duty free vs 49% of Baby Boomers).
Three image cards with question headline and explanatory text
From 2019 to 2025 total travel spend grew +31% and passenger traffic +7% while DF&TR sales fell -0.2%; the regional waterfall shows APAC -7.6bn, North America -0.9bn, South America -0.2bn, Europe +3.1bn, Middle East +0.6bn and Africa +0.1bn, netting a US$5.0bn gap.
Indexed line chart with growth table left, waterfall chart in a blue panel right
2025 sales: global US$71.8bn at US$7.33 per traveler; APAC 27.1bn (-3.1% CAGR 2019-25), Europe 25.3bn (+3.0%, US$9.89), South America 7.4bn, Middle East 6.8bn (US$15.46 per traveler), North America 4.3bn (US$1.96), Africa 1.1bn.
Shaded world map left, KPI table with green and red CAGR cells right
APAC passenger traffic is +6% versus 2019 but DF&TR sales are -17%, a US$7.6bn gap, with sales per traveler down from US$9.68 to US$7.56, due to low-cost carrier passenger mix, stronger local offering and lower Chinese luxury consumption.
Indexed line chart with growth figures, two KPI tiles below, blue driver panel right
Contribution to APAC travel retail growth: Indian travelers rise from ~5% (2015-2019) to ~20% (2025-2035), a 4x increase, while Chinese travelers fall from ~65% to ~40%; South Koreans ~9% to ~10%, others ~25% to ~30%.
Two donut charts side by side with arrow to a photo and 4x callout
European DF&TR sales grew +20% versus +5% passenger traffic in 2019-2025, a US$3.1bn surplus, with sales per traveler up from US$8.69 to US$9.89, driven by retail investment, an affluent US and Asian passenger mix and Brexit recreating a duty-free market.
Indexed line chart with growth figures, two KPI tiles, blue driver panel
Middle East passengers rose from 140m (2020) to 450m (2024) then fall to 420m by 2026F (-3.4% CAGR) on geopolitical events, while sales per passenger stay around US$15 (16.27 in 2026F); experts expect recovery by 2028.
Bar chart and line chart side by side with KPI tiles and two quote boxes
North American passenger traffic is +7% versus 2019 but DF&TR sales -12%, a US$0.9bn gap, with sales per traveler falling from US$2.38 to US$1.96 due to domestic travel rebound, an eroding value promise and dwell time lost to lounges and F&B.
Indexed line chart, KPI tiles, blue driver panel
South America passengers +15% and DF&TR sales +12% in 2019-2025, a small US$0.2bn gap, with sales per traveler from US$9.64 to US$9.37 as a rising middle class and airport investment broaden the base but shrink baskets.
Indexed line chart, KPI tiles, blue implications panel
Africa DF&TR sales grew +22% versus +13% passenger traffic in 2019-2025, capturing US$0.1bn additional revenue, with sales per traveler rising from US$3.76 to US$4.07.
Indexed line chart with growth figures and two KPI tiles
2025 DF&TR category mix by region (Asia US$31.2bn, Europe 25.3bn, South America 7.4bn, Middle East 6.1bn, North America 4.3bn, Africa 1.7bn) shows fragrances and cosmetics at 44% of Asian sales versus about 20-28% elsewhere.
Marimekko (variable-width stacked) chart across six regions with legend
Global DF&TR sales per passenger fell from US$8.28 (2023) to 7.75 (2025F) with F&C at -8.4% CAGR, but excluding APAC sales per passenger rose from 6.94 to 7.19 with F&C at +4.3% and tobacco at +6.0%.
Two stacked bar charts side by side with CAGR pills and a navy callout
Share of airline travel spend: Gen Z from 1% (2015) to 11% (2025), 26% (2030F) and 37% (2035F); Millennials plus Gen Z reach 61% in 2025 and 81% by 2035F.
100% stacked bar chart across five years with actual vs forecast split and bracket callouts
Gen Z global income projected at US$36 trillion by 2030 (+300% vs US$9 trillion in 2023), Gen Z takes 1.7x more trips than Baby Boomers in 2026, and 50% of Gen Z have spent (much) more on airport duty free than two years ago.
Three-column big-number layout
49% of Baby Boomers vs 36% of Gen Z prefer airport duty free for luxury purchases; Gen Z's top reasons are limited time (35%), limited product range (30%), limited brand selection (29%), prices not actually lower (27%) and inconvenient experience (25%).
Two donut charts left, ranked reasons table right
Average airside time is 78 minutes for Gen Z vs 88 for Baby Boomers (-10 minutes), and Gen Z is about 4x more likely to spend under 30 minutes airside (7% vs 2%).
Stacked bar chart per generation with average-minutes pills above and callout
Section 2 divider on the shift from price-led to discovery-led conversion.
Light-blue panel with serif title and large 02, photo right
Top purchase criteria: Baby Boomers rank price first at 80%, Gen Z rank quality first at 64% and price second at 51% (-29 p.p.), followed by brand trust 43%, assortment relevance 37% and convenience 36%.
Two ranked tables side by side with connector arrow, quote boxes right
Share of travelers who discovered a brand or product in airport retail: Gen Z 96%, Millennials 95%, Gen X 87%, Baby Boomers 76% (-20 p.p.).
Simple four-bar column chart with bracket annotation
89% of travelers discovered new products at the airport; 44% purchased immediately, 27% later, 13% plan to and 6% do not expect to; 49% of Gen Z vs 35% of Baby Boomers buy immediately.
Sankey-style flow chart left, two ring gauges right
Immediate conversion after discovery for Gen Z vs Baby Boomers: France 37% vs 40%, Germany 42% vs 41%, UK 52% vs 30%, US 51% vs 41%, Japan 57% vs 25%; 36% of EU Gen Z postpone purchase, 13 p.p. more than elsewhere.
Paired horizontal bar chart left with highlighted EU rows, explanatory text right
Three eroded advantages: an audience no longer captive (smartphones compete for attention), an offer that stopped surprising (indie brands and domestic innovation) and an eroding price advantage (post-pandemic price rises and AI-driven price transparency).
Three columns each with heading, AI-generated illustrative photo and bullets
Average daily phone time is 5h 16m, with Gen Z at 6h 27m, Millennials 5h 28m, Gen X 4h 48m and Baby Boomers 4h 19m; an operator calls the smartphone its biggest competitor.
Narrative text left, column chart with average line right, quote box
Shopper needs have moved from three-dimensional segmentation (category, price, geography) to multi-dimensional segmentation creating smaller, fragmented demand spaces, raised by indie brands targeting age, ethnicity and lifestyle.
Headline and text left, From/To comparison with triangle and polyhedron graphics
Contrasts travel retail built to transact (brand-first merchandising, legacy portfolio, slower cycles) with domestic retail built to explore (Trending and New in curation, viral and indie brands, weekly drops and testing tables).
Two-column cross vs check comparison flanked by four illustrative store images
31% of travelers who do not prefer airport duty free believe prices are not actually lower; slide contrasts the pre-COVID bargain era with the post-COVID value disconnect, with a spirits executive admitting the industry raised prices too much.
Big stat and quote left, light-blue and navy before/after panels right
Illustrative price checks: Airport A is 14% and 18% cheaper on fragrance and cosmetics but 29% dearer on alcohol (EUR118 vs 152); Airport B is 6% and 9% dearer on fragrance and cosmetics but 27% cheaper on alcohol, making duty-free pricing a lottery.
Price comparison table with product icons and green/red percentage pills
49% of shoppers use AI for shopping, 85% of Gen Z shoppers use AI for shopping and 92% of Gen Z use AI to track or compare prices before buying.
Phone mockup with text left, three large ring gauges right
Q&A on how Gen Z shops luxury through values, authenticity and digital research, and why physical travel retail must provide inspiration, discovery and memorable experiences, with eyewear as a traffic driver.
Light-blue page with portrait and name left, two-column Q&A text
Section 3 divider introducing the discovery-led proposition.
Light-blue panel with title and large 03, photo right
62% of industry experts view travel retail primarily as a sales generation channel, held there by three forces: economics rewarding the next transaction, price-led design and no single owner of the traveler.
Ring gauge in beige panel left, three-row force table right
Experts more recruitment-focused rise from 40% (last 5 years) to 50% (next 5 years), +10 p.p.; priority capabilities are experiences and discovery (71%), omnichannel engagement (71%), personalization and CRM (57%) and airline and airport partnerships (43%).
Two donut charts left, ranked capability table and quote right
Framework of Invite (store layouts that support discovery), Surprise (evolving, relevant assortments) and Engage (unique experiences), underpinned by Fix the basics: rebuild trust in the value equation.
Three-column framework with italic headings and images, beige base bar
Invite case: Kansai Airport replaced brand-led aisles with four mission-led environments (Fun, Magnet, Wall side, Peaceful), aligning retail to traveler missions and balancing convenience with discovery.
Four-zone image grid with labels left, why-it-works list right, takeaway line
Invite case: ARI's Hot Shop at Larnaca Airport is a retailer-curated, continuously refreshed indie beauty zone (brands such as Sol de Janeiro, Summer Friday, CeraVe, Nudestix, Morphe) that lowers the cost of innovation and lets brands test the channel.
Three benefit columns left, 3x4 brand name grid right
Invite case: Dubai Airport's digital media network uses live flight data to tailor retail messaging by destination, language and gate, steer footfall and react to delays; data sharing across partners is the critical enabler.
Three benefit columns, beige case box, tall photo right
Q&A noting 91% of consumers snack daily but only 8 in 100 travelers buy confectionery in duty free; purchase limits raise perceived value by 59% (Toblerone Very Limited Editions of 2,000-4,000 bars), and full-journey engagement drives conversion.
Light-blue interview page with portrait left and two-column Q&A
Surprise lever: rebalance the mix for Gen Z, offer travel exclusives and avant-premieres, and add local products (Greek olive oil, Japanese sake, Iberico); local brands Decorte and Dassai rank #1 in some Japan destinations.
Headline left, three definition columns right, laurel #1 badge and quote below
Surprise case: Danish discount chain Normal adds new products every week, posting 20% revenue growth and 33% profit growth in 2025.
Light-blue text panel left, KPI numbers and CEO quote right
Engage case: Frankfurt Airport's The Beacon tasting bar by Gebr. Heinemann places guided tasting and cross-category pairings at the heart of the duty free store to build purchase confidence.
Three benefit columns and quote, tall store photo right
Q&A on Coty's retailtainment strategy, avant-premiere launches such as Calvin Klein euphoria elixirs and BOSS Bottled Beyond, Chloe pop-ups, and fragrance mists (a US$7 billion market) as a recruitment entry point.
Light-blue interview page with portrait and two-column Q&A
59% of travelers purchase travel retail products for self-consumption (+2 p.p. vs 2025); Maison 21G lets travelers blend their own fragrance after a short scent quiz.
Ring gauge and quote left, product photo right
33% of travel retail purchases are impulse-driven, 66% of shoppers seek products they have never bought, 51% interacted with sales staff on their last visit and 76% of those were positively influenced.
Two big stats left, two ring gauges with quote boxes right
Haneda ranks #1 for overall experience (91% rate it good) and store layout (81%), #4 checkout speed (82%), #5 price (72%), #6 service (74%) and #8 assortment (70%), supported by pop-ups, collaborations, pre-order pick-up and live entertainment.
Ranked table with laurel badges left, 2x2 activation examples right
Gen Z shopping missions rank self-treat first and bargain hunting fourth, yet expected duty free discounts remain about 18% across generations: Gen Z 17.5%, Millennials 17.8%, Gen X 18.2%, Baby Boomers 18.6%.
Ranked mission list left, column chart with average line right
Fix the basics framework: protect price credibility (monitor RRP, fix gaps, prioritize KVIs), build accessible entry price points (good-better-best, travel sizes, private label) and make the value visible (shelf savings, pre-trip communication, consistent claims).
Three-column framework with italic headings, photo strip right
Schiphol benchmarks prices monthly against leading Dutch retailers on identical SKUs, communicating about 25% average savings on perfume, cosmetics and alcohol, with one price for EU and non-EU travelers (example tag: our price EUR143 vs local EUR173).
Headline and quote left, photo with price tag callout top right, two bullet columns
Q&A on travel retail as a valuable touchpoint for premium fashion, the need for consistent cross-channel experiences and closer airport-operator-brand collaboration.
Light-blue interview page with portrait and two-column Q&A
Section 4 divider introducing the call for action.
Light-blue panel with title and large 04, photo right
Travel retail can combine traveler, journey, location and time signals that domestic channels rarely see together, expressed as Traveler at airport terminal = f(day of year, hour).
Headline left, four signal cards and result formula box right
Three steps (de-average the traveler, understand needs, translate insights into action) feed a dynamic traveler view that drives assortment, price, promo, activation, retail media, staffing, sales instructions, category space and store layout.
Chevron process across top, circular hub diagram and three example images below
Q&A stating the winning airport proposition will be technology and data led, citing Club Avolta's 20 million+ members, Reserve & Collect, and local relevance such as Hudson selling Audrey's Popcorn at Dallas Fort Worth.
Light-blue interview page with portrait and two-column Q&A
Three actions: understand travelers beyond the average, rebuild the proposition around discovery while restoring the value equation, and turn traveler intelligence into dynamic decisions at the right refresh cadence.
Photo banner top with title, three bulleted action columns below
Author team: partners Vincent Barbat, Pierre-Alexandre Koch, Faycal Baddou and Charles-Etienne Bost (Paris), senior advisor Christophe Chaix (Geneva), principal Denise van Wijk and consultant Torsten Liljedahl (Stockholm), engagement manager Sofia Cruz (Madrid), with thanks to TFWA.
Three-column grid of portrait thumbnails with names and offices
Standard Oliver Wyman disclaimer on use of the report, third-party data reliability, forward-looking predictions and no investment advice.
Single text block on white page
Closing page with the Oliver Wyman, A Marsh business logo.
Light-blue page with centered-left logo
Częste pytania dotyczące tego slajdu i podstawowej treści prezentacji.
It is a 72-page report by Oliver Wyman and TFWA (Tax Free World Association) on what will drive the next decade of duty free and travel retail growth. It sizes the market by region and category, analyzes Gen Z and other traveler generations using a 3,825-respondent 2026 survey, explains why price no longer converts and discovery does, and closes with a call for action on data-led, discovery-oriented retail.
Passenger traffic grew 6.2% CAGR in 2023-2025 versus 2.7% for travel retail sales, leaving an estimated US$5.0 billion gap versus 2019 conversion. Europe generated a US$3.1 billion surplus while APAC sales remain 17% below 2019. Millennials and Gen Z account for 61% of airline travel spend (about 80% by 2035), only 51% of Gen Z cite price as a key criterion versus 80% of Baby Boomers, and 44% of travelers buy immediately after discovering a product (49% of Gen Z).
This edition was published by Oliver Wyman, a Marsh business, together with TFWA in September 2026. Oliver Wyman describes it as part of its long-standing research into global travel retail, and the report references a companion Asia Pacific travel retail pulse for 2026, so it is best treated as a recurring industry pulse report.
Every content slide carries an action title that states the conclusion, such as Travel retail's inability to keep pace with passenger growth has cost the industry US$5 billion. Charts are clean and annotated (waterfalls, marimekko mixes, stacked bars with CAGR pills, Sankey-style funnels), each slide has a source line, and the storyline runs from forewords and an executive summary through four numbered sections, case studies and expert interviews to a call for action.
It mixes section dividers with oversized numerals, three-column executive summary pages, big-number KPI rows, ring gauges, regional deep-dive templates (indexed line chart plus per-traveler KPI tiles plus a driver panel), ranked tables, framework slides (Invite, Surprise, Engage, Fix the basics), case-study pages with photos, and two-column interview pages.
Start with an outline of action titles that tell the story on their own, then attach one chart or data point to each. 2Slides can turn a document, research notes or an outline into a structured slide deck, so you can upload your report or survey summary and generate a consulting-style presentation, then refine the titles and charts.
Case studies cover Kansai Airport's mission-led zones, ARI's Hot Shop at Larnaca, Dubai Airport's live flight data retail media, Frankfurt's Beacon tasting bar by Gebr. Heinemann, Haneda Airport, Schiphol with Lagardere and Danish retailer Normal, plus interviews with executives from Kering, Mondelez, Coty, Hugo Boss and Avolta.
The original PDF is published on the Oliver Wyman website at https://www.oliverwyman.com/content/dam/oliver-wyman/v2/publications/2026/september/oliver-wyman-tfwa-global-travel-retail-pulse.pdf. The gallery page shows every slide for reference.
Original report PDF published with TFWA in September 2026

Create Your Own Slides
Turn your ideas into professional presentations in seconds with 2slides AI.
Odwołuj się do profesjonalnych projektów, wybierz swój styl i generuj slajdy z idealnym renderowaniem tekstu. Napędzane przez Nano Banana—zacznij tworzyć swoją prezentację teraz.
Twój Agent AI dla slajdów. Oszczędzaj czas, błyszcz szybciej dzięki inteligentnemu tworzeniu prezentacji.


© 2026 2slides. Wszelkie prawa zastrzeżone.