
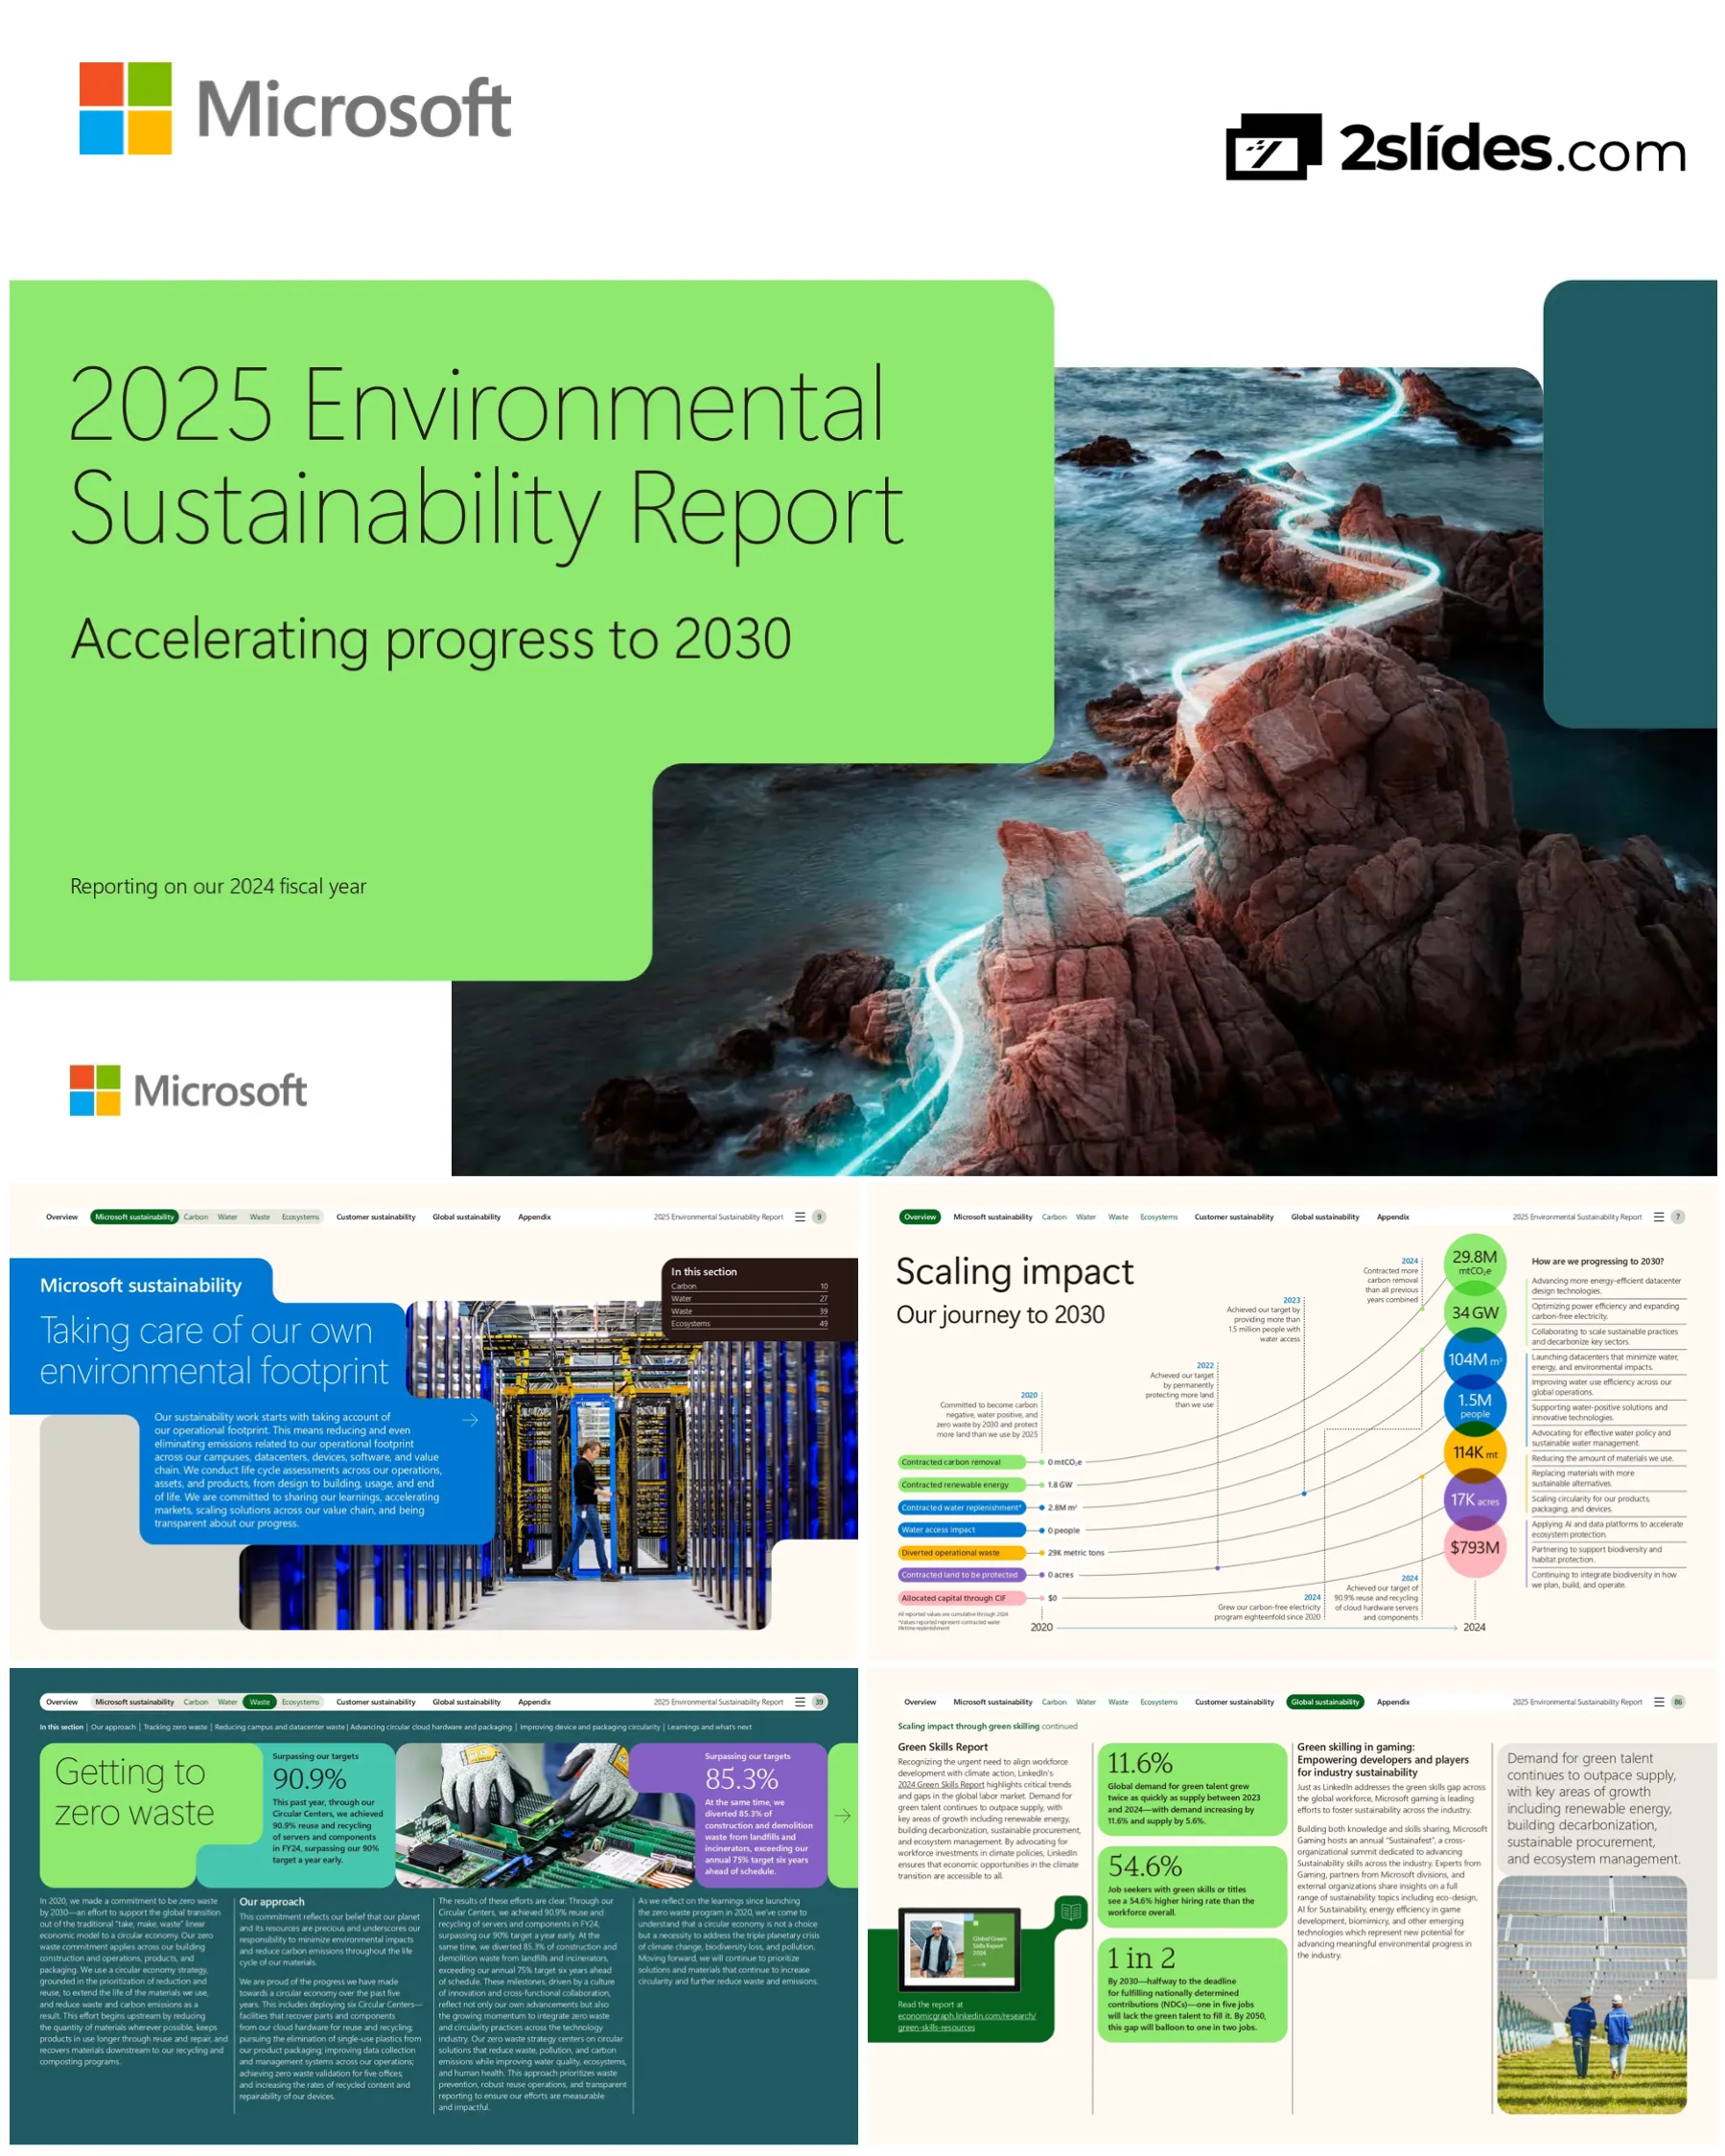
Microsoft 2025 Environmental Sustainability Report - Accelerating Progress to 2030
Szybka Nawigacja
Tagi
Udostępnij slajdy
Microsoft 2025 Environmental Sustainability Report - Accelerating Progress to 2030
Szczegółowy widok każdej strony slajdu, w tym układu, kluczowej treści i elementów wizualnych.
Title page introducing the 2025 Environmental Sustainability Report, with tagline 'Accelerating progress to 2030' and reporting period (2024 fiscal year).
Clean, minimalist design with large bold title, concise subtitle, and Microsoft logo. White background with simple typography focus.
Full navigation structure of the report with all main sections: Overview, Microsoft sustainability (Carbon, Water, Waste, Ecosystems), Customer sustainability, Global sustainability, Appendix.
Two-column layout with interactive navigation panel on left and detailed section breakdown on right. Includes page references and website link.
Introduction to the Overview section with focus on scaling impact toward 2030 goals. Includes inspirational quote about pragmatic optimism through technology.
Full-page section divider with visual navigation bar at top, section title, and quote highlight.
Joint message from Vice Chair & President Brad Smith and Chief Sustainability Officer Melanie Nakagawa. Reviews progress since 2020 goals, emphasizes integrated approach, and highlights key 2024 achievements across ecosystems, zero waste, water positive, and carbon negative.
Executive message format with leadership photos, signatures, and bulleted progress highlights. Clean two-column text layout.
Deep dive into carbon negative strategy as a 'marathon, not a sprint.' Acknowledges emissions increase due to growth but highlights decoupling from energy use and revenue. Details strategies for Scope 1, 2, and 3 reduction, CFE procurement, datacenter transformation, carbon removal, and operational efficiency.
Continuation of foreword with thematic subsections, data points, and initiative descriptions.
Outlines Microsoft's broader role beyond operations: Climate Innovation Fund investments, empowering customers with AI platforms, partnering for impact (GitHub, Xbox), accelerating AI for sustainability, and call for sustained momentum.
Continuation with focus on external impact. Uses bulleted pillars and another pull quote.
Visual timeline from 2020 to 2024 showing key commitment milestones and progress metrics (contracted carbon removal, renewable energy, water replenishment, people with water access, diverted waste, land protected). Includes future focus areas for 2030.
Horizontal timeline with milestone years, icon-based metrics, and future focus text blocks.
Explains Microsoft's three-pillar sustainability model: 1) Microsoft sustainability (own footprint), 2) Customer sustainability (technology enablement), 3) Global sustainability (market catalysis).
Three-column pillar layout, each with a title, icon, and descriptive text.
Introduction to the 'Microsoft Sustainability' pillar, focusing on operational footprint reduction through lifecycle assessment. Preview of subsections: Carbon, Water, Waste, Ecosystems.
Section landing page with brief intro and visual preview of upcoming content sections.
Introduces the comprehensive approach to carbon negativity, highlighting the internal Climate Council. Identifies three critical focus areas: Efficiency, Availability, and Measurement & Adoption.
Introductory page with section navigation, approach description, and three focus area callouts.
Details specific 2030 and 2050 carbon negative targets. Presents progress data for Scope 1&2 emissions (-30%), Scope 3 (+26%), CFE expansion (18 GW new renewables, nuclear PPA), and carbon removal contracting (2.8M metric tons).
Two-column layout: Left for targets, right for progress. Uses clear headers and data points.
Visual chart (appears to be a bar/line graph) showing emissions and retirements over time (FY20-FY24). Explains Scope 1, 2, 3 definitions and reports overall emissions increase of 23.4% in FY24.
Chart-focused page with graph, legend, and explanatory text. Note about data source (Data Fact Sheet).
Pie chart and table breaking down FY24 Scope 3 emissions by source category. Shows Purchased Goods & Services (34%), Capital Goods (41%), and Use of Sold Products (12%) as largest contributors.
Pie chart visualization accompanied by detailed data table. Includes Scope 1&2 comparison slice.
Focus on datacenter decarbonization: using low-carbon materials (mass timber), pursuing LEED Gold, investing in near-zero-carbon steel, reducing embodied carbon in HVAC.
Thematic page with header, body text, and specific initiative examples in bullet points.
Covers industry collaboration (iMasons), datacenter power optimization (power harvesting, low-power states), and innovation in cooling technologies (transition to chip-level liquid cooling). Highlights 35% server energy reduction.
Continuation with subsections on collaboration and innovation. Includes 'Innovation in Action' breakout and key metric callout.
Details transition to renewable diesel for backup generators, supplier engagement for 100% CFE, logistics improvements (North American SuperHub), adoption of alternative fuels/EVs in transportation, and SAF integration.
Continuation with multiple initiative areas. Uses key metric callout (100% supplier CFE target).
Highlights EV trucking deployment, logistics carbon intensity reduction (-73%), and campus sustainability (East Campus Modernization geothermal, energy efficiency projects globally).
Continuation with focus on logistics and campuses. Includes 'Innovation in Action' breakout for East Campus.
Showcases BarnX (LEED Gold game studio), kitchen and fleet electrification projects, and LinkedIn's sustainability integration in real estate and carbon roadmap.
Continuation with specific project examples and LinkedIn case study.
Focus on ensuring availability of decarbonization solutions. Discusses advancing renewable energy markets, challenges (permitting, delays), and progress (CFE program 18x growth since 2020). Highlights 2024 procurement of 19 GW new renewable energy across 16 countries.
Strategy introduction page with progress highlights and specific market expansion examples.
Covers expansion into nuclear energy (PPA with Constellation), circular economy in renewables (PPAs with recycling requirements), industry collaboration, community-focused procurement (Datacenter Community Pledge), and scaling carbon removal initiatives.
Continuation with multiple thematic areas. Introduces carbon removal scaling narrative.
Details FY24 carbon removal contracts (22M metric tons), diversified pathways (ARR, BECCS, DAC), and example projects (Stockholm Exergi, re.green). Includes Carbon Table 3 tracking contracted removal volumes.
Data and example-focused page with a table visualization and project case studies.
Highlights innovation in carbon removal, specifically integrating Direct Air Capture (DAC) with datacenter waste heat. Announces co-founding of Symbiosis Coalition with Google, Meta, Salesforce for 20M tons of nature-based removal by 2030. Discusses quality focus and investing in emerging technologies.
Innovation-focused page with 'Innovation in Action' sidebar and partnership announcement.
Emphasizes importance of accurate measurement and adoption. Introduces use of AI-powered LCA tools (like Makesite) to streamline assessments and enable data-driven decisions, citing time reduction (>80%) for device LCAs.
Strategy introduction page focusing on measurement enablers and tool benefits.
Details advancements in LCA methodologies: automated data collection, primary data integration (70% for devices), collaboration with IMEC for semiconductors. Discusses embedding measurement in construction via Environmental Product Declarations (EPDs) and EC3 tool.
Deep dive into specific measurement methodologies and tools.
Focuses on strengthening supplier engagement to address Scope 3. Highlights requirement for 100% CFE by 2030, use of Microsoft Sustainability Manager and AI to streamline processes (94% survey time reduction).
Supplier-focused page with progress highlights and AI automation benefits.
Reports significant supplier progress (89 facilities at 100% CFE, 10x increase). Details tools to enhance access (Supplier REach portal, SAF pilot). Shares learnings and next steps: advancing carbon markets, building removal portfolio, scaling community infrastructure, driving datacenter innovation.
Progress update and forward-looking 'Learnings and What's Next' section.
Introduces water positive commitment by 2030. Outlines approach: increasing efficiency (liquid cooling), reducing freshwater dependence, increasing restoration/reuse. Details four guiding principles for replenishment work.
Section introduction with approach pillars and guiding principles.
Lists water positive targets (replenish > use, 1.5M people with access, 40% water intensity reduction). Reports progress: >100M m³ replenishment volume, >1.6M people served, 18% water intensity reduction achieved.
Two-column layout: Targets on left, Progress on right.
Explains water replenishment as an emerging field. Shows Water Table 1: growth in contracted replenishment volume over time, reaching >100M m³ lifetime. Discusses building a diverse portfolio to mitigate risk.
Introduction to replenishment concept accompanied by data chart (Water Table 1).
Details portfolio expansion in FY24 (27 new projects, 76 total). Shows Water Table 2 (replenishment activity breakdown) and Water Table 3 (cumulative project growth). Highlights 50% portfolio increase.
Data-focused page with two tables/charts and portfolio growth highlight.
Describes using AI to accelerate water projects (monitoring, planning, operations). Highlights leak detection projects in global cities. Features 'Partnering for Impact' case studies: AI water management in Indian hospitals and AI-powered precision irrigation in Chile.
Technology application page with AI use cases and partner case study sidebars.
Highlights nature-based projects (beaver dam analogs) and agricultural water management (climate-smart irrigation). Lists technological interventions and projected water savings (20M m³). Includes farmer testimonial.
Project examples page with nature-based and agriculture focus. Includes quote and call to action.
Announces achievement of 1.5M people water access target (exceeded to 1.6M). Describes project portfolio across 9 countries. Highlights innovative approaches: rainwater harvesting for schools, capturing potable water from sugarcane manufacturing.
Progress announcement and project portfolio description.
Shows Water Table 4: growth in number of people reached through access projects. Features 'Innovation in Action' on WaterEquity climate resilience fund. Includes local resident testimonial and employee volunteer events.
Data visualization and community impact stories.
Focuses on datacenter water efficiency. Explains evolution from traditional cooling to direct-to-chip liquid cooling, eliminating water for cooling in new AI datacenters. Claims savings of >125,000 m³ water annually per datacenter.
Technology evolution narrative with efficiency benefit quantification.
Discusses improving Water Usage Effectiveness (WUE) metric (18% reduction since 2022, 39% better than global avg). Covers water recycling and reuse initiatives in various regions. Includes 'Partnering for Impact' example from Quincy, WA.
Continuation with metric focus and regional initiative examples.
Presents Water Table 5: total water consumption and withdrawal trend (FY20-FY24). Discusses water efficiency efforts at campuses: low-flow fixtures, smart irrigation, air-to-water systems in India.
Data chart page followed by campus initiative descriptions.
Describes R&D for greater water efficiency (adiabatic cooling media, microfluidics). Shares 'Learnings and What's Next': improving monitoring, using AI in high-stress basins, focusing on innovation and scale as 2030 approaches.
R&D focus and forward-looking lessons learned.
Introduces zero waste commitment and circular economy strategy. Announces surpassing two key targets early: 90.9% reuse/recycling of servers, and 85.3% diversion of construction/demolition waste.
Section introduction with major achievement highlights.
Details zero waste targets across operations, hardware, packaging, and products. Reports progress: 88.1% operational waste diversion, 85.3% C&D diversion, 90.9% server reuse/recycling, 94.8% packaging recyclability, advancements in device repairability and recycled content.
Two-column targets vs. progress layout with multiple metric highlights.
Discusses the data-driven foundation for waste accountability. Presents Waste Table 1: diversion rates for operational waste over time (FY20-FY24), showing improvement to 88.1%.
Methodology and data transparency focus with accompanying table.
Highlights construction/demolition waste diversion success (85.3%). Details operational waste reduction: TRUE certifications, e-waste recycling, food waste AI, waste contamination reduction, reusable containers.
Operational initiatives list with key metric highlight.
Shows Waste Table 2: improvement in server reuse/recycling rate to 90.9%. Discusses datacenter waste prevention (durable serviceware, washable filters) and employee engagement. Notes LinkedIn's contributions to zero waste.
Data chart and initiative continuation, including partner contribution.
Focuses on Circular Centers achieving 91% reuse/recycling. Discusses global expansion, supplier partnerships, and design requirements (recycled content). Highlights pilot for reusing solid-state drives.
Program highlight page with key metric and expansion details.
Details efforts to reduce packaging impact: replacing EPE foam with paper/pulp, recycling program for server rack packaging (diverted 2,500 metric tons). Introduces Sustainable Packaging Supplier Engagement Program. Shows Waste Table 3: packaging recyclability progress (94.8%).
Packaging focus with data table and program introduction.
Covers device and packaging circularity: eliminating single-use plastics, sustainable packaging for Surface and Xbox. Highlights design for repairability for both Surface and Xbox, including partnerships with repair providers.
Product-focused initiatives with repairability emphasis.
Shows Waste Table 4: reduction of single-use plastics in packaging (to 4.0%). Discusses improving recyclability data via partnership with UNITAR, supplier collaborations for waste diversion, and responsible sourcing of recycled materials (UL 2809 certification).
Data, partnerships, and sourcing focus with accompanying chart.
Shares forward-looking priorities: continuing prevention first, expanding funding for circular markets, prioritizing localized solutions (like Circular Centers), and building on analytical insights.
Forward-looking lessons learned and future focus areas.
Introduces ecosystem protection commitment. Announces exceeding land protection target (>30% more land protected than used). Shows target vs. progress: 15,849 acres permanently protected vs. 11,900 acre footprint.
Section introduction with goal achievement statement and data comparison.
Describes integrating biodiversity into datacenter design using Ecosystem Intelligence tool and AI monitoring (Microsoft Premonition). Highlights campus biodiversity efforts: native planting, pollinator gardens, bee hotels. Updates to Global Sustainability Standards.
Operational integration of biodiversity with technology and design examples.
Outlines Microsoft Community Environmental Sustainability program (123 programs in 39 cities). Highlights ecological restoration projects near datacenters, like the Lamparek Creek Restoration in Wisconsin.
Community program overview with specific project example.
Focuses on urban forestry partnerships (One Tree Planted, American Forests) for tree equity and workforce training. Features 'Partnering for Impact' on ChangeX platform for scaling grassroots community action.
Partnership highlights and platform case study.
Details community vitality initiatives (workforce development, urban habitat restoration). Discusses partnership with Society for Ecological Restoration (SER) for standards-based projects globally (26 completed). Features white stork wetland restoration case study.
Community development and global standards partnership.
Introduces the Planetary Computer as a cornerstone for conservation. Features 'Partnering for Impact' case study: Xbox partnership with Seattle Aquarium using ROV Nereo (controlled by Xbox controller) to restore kelp forests.
Technology platform introduction with a compelling partner case study.
Highlights AI tools from Microsoft AI for Good Lab for conservation: Pytorch Wildlife platform, Project Guacamaya in Amazon, and work with Wild Nature Institute in Tanzania to protect giraffes.
AI application case studies across different geographies and species.
Discusses scaling ecosystem monitoring to energy systems via Global Renewable Watch (GRW) partnership. Shares 'Learnings and What's Next': scaling restoration with community impact, driving innovation through tech, designing datacenters/campuses to support ecosystems.
Scaling discussion and forward-looking priorities.
Introduces the 'Customer Sustainability' pillar: accelerating progress through technology. Previews subsections: Microsoft for Sustainability, Green software, Devices, Gaming, Arts and culture, Planetary Computer.
Section landing page with pillar description and content preview.
Presents Microsoft for Sustainability as a solution suite to help customers turn ESG data into insights. Highlights Microsoft Sustainability Manager and Microsoft Fabric for centralized data, AI-powered insights, and Copilot integration.
Product/solution introduction with key capabilities and value proposition.
Provides customer case studies: Envirotainer (cold chain logistics) using Sustainability Manager for emissions tracking; ICONICS (IoT) integrating with Sustainability Manager; Esri (geospatial) using ArcGIS with Azure for climate resilience modeling. Includes customer quote.
Customer testimonial and case study page.
Introduces green software engineering principles. Discusses maximizing cloud sustainability via workload scheduling and Azure Carbon Optimization tool. Highlights general availability of suspend/resume for VMs.
Concept and tool introduction for software and cloud efficiency.
Addresses reducing environmental impact of AI (guidelines via Azure Well-Architected Framework). Highlights Microsoft's role in Green Software Foundation (GSF) and adoption of SCI specification. Empowers developers with resources like GitHub Green Software Directory (150M developers, 60K climate OSS projects).
AI sustainability focus and developer community enablement.
Discusses proofs of concept (e.g., using Copilot for greener coding) and the importance of responsible AI deployment. Outlines collaboration with GSF on future projects (white papers, SCI for AI).
Future initiatives and responsible development principles.
Introduces Surface device sustainability, focusing on recycled materials. Highlights Surface Copilot+ PCs with 100% recycled aluminum alloy and 100% recycled rare earth metals in magnets.
Product sustainability introduction with specific material achievements.
Highlights device energy efficiency (ENERGY STAR certification, up to 42% more efficient). Reports life cycle carbon footprint reductions (27% for Surface Pro, 41% for Laptop). Details repairability advancements: service guides, spare parts availability, Authorized Service Provider network.
Efficiency data and repairability program details.
Details Xbox investments to reduce environmental footprint: carbon-saving settings, shutdown power option, Active Hours, media platform efficiency, and hardware improvements (6nm chip). Introduces Xbox Sustainability Toolkit for developers.
Product sustainability features and developer tools.
Shows adoption of Xbox Sustainability Toolkit by studios (Zenimax, Halo, Activision, Mojang). Announces new Dynamic Power States API. Reports over 12 million metric tons CO2e prevented (FY20-FY23).
Adoption examples and impact quantification.
Highlights Minecraft's role in eco-friendly gaming and real-world impact. Describes initiatives like 'Freedom to Go Beyond' (with Burberry) and 'Rooted Together' (with The Nature Conservancy).
Game-specific sustainability initiatives and partnerships.
Continues Minecraft examples: 'Schools Reinventing Cities' with C40, 'Urban Miner' e-waste recycling. Announces new content ('Minecraft National Park' with The Nature Conservancy, 'Planet Earth III' with BBC). Notes 30M+ downloads of climate content.
Educational initiatives and new content launches.
Features collaboration with Natural History Museum, London: 'Visions of Nature' mixed reality experience. Aims to spark climate optimism by showing a healed planet 100 years in the future.
Cultural partnership and immersive experience highlight.
Introduces Planetary Computer as a global geospatial data platform (>50 PB data, 120+ collections). Features 'Innovation in Action' case study: Howden Resilience Laboratory using it for climate risk assessment.
Data platform overview with use case example.
Discusses AI transformation for easier data access. Features partner case study: Skytec Wetland Screening Tool. Highlights role in advancing resilience through open data, especially for Global South communities.
AI enablement and equity focus with partner example.
Introduces the 'Global Sustainability' pillar: catalyzing impact beyond Microsoft's walls. Focus areas: investing in innovation, AI innovation, shaping policy, green skilling.
Section landing page with pillar description and focus area preview.
Introduces the $1B Microsoft Climate Innovation Fund (CIF). Discusses investment mandate to accelerate climate tech in underfunded sectors. Reports $793M allocated across 63 investments, catalyzing >$3.3B follow-on.
Fund overview with investment thesis and performance metrics.
Showcases specific CIF investments via 'Innovation in Action': Eavor (geothermal), Climate Asset Management (nature-based carbon fund), Cyclic Materials (critical mineral recycling), SolarCycle (solar panel recycling), Terradot (AI for Earth systems).
Portfolio company highlight reel.
Highlights partnership models: University of Washington Buerk Center (student innovation), Build Better Innovation Challenge (low-carbon materials), EB Angels & Decarboné-US (early-stage climate tech).
Partnership program examples across academia, industry, and philanthropy.
Focuses on advancing equity (portfolio diversity stats), supporting accelerators (ACCEL, Kinjani), and investing in AI-driven product companies. Highlights connection to Microsoft ecosystem support (Founders Hub, Co-Innovation Lab). Reiterates scaling strategy and $3.3B catalyzed.
Equity, ecosystem, and scaling strategy.
Introduces Microsoft Sustainability Science and Research teams applying AI to environmental challenges. References the 'Accelerating Sustainability with AI' playbook and its five strategies. Mentions collaborations on understanding AI's energy/climate nexus.
AI strategy and research introduction.
Details AI applications: supporting biodiversity/ecosystem reporting (for CSRD etc.), investing in nature-positive strategies, understanding carbon budgets (near real-time global analysis), and transforming weather/climate forecasting (Aurora model, sub-seasonal corrections).
Deep dive into specific AI application areas for Earth science.
Covers AI for energy: grid storage (organic flow batteries), community solar microgrids for equity, and partnerships for sustainability skills. Also discusses materials science: vitrimers for recyclable printed circuit boards.
AI applications in energy and materials science.
Details AI for optimizing building/datacenter efficiency (Reinforcement Learning for 30% energy savings, 27% water reduction). Describes developing accessible AI for water management (Copilot for Limpopo River Basin). Reiterates commitment to monitoring biodiversity and ecosystems.
AI for operational optimization and resource management.
Outlines Microsoft's global policy advocacy role. Lists key supported policies (US IRA, EU CSRD, etc.). Identifies three policy opportunities for CFE and three foundational advocacy principles.
Policy advocacy framework introduction.
Details advocacy for carbon-free electricity in US, Europe, and Asia. Focuses on decarbonizing supply chain in key semiconductor sourcing regions (Korea, Japan, Taiwan) via policy engagement and industry associations.
Geographic policy focus and supply chain emphasis.
Discusses advocating for AI's role in sustainability (inputs to DOE, EU). Highlights engagements at UNGA, CBD COP16, UNFCCC COP29. Covers advancing robust carbon reporting standards in US, Malaysia, South Korea, and EU.
AI policy and reporting standards advocacy.
Looks ahead to policy priorities: scaling high-integrity carbon removal markets (interoperability with Paris Agreement), and harnessing AI for global sustainability policy. Lists specific AI use cases for optimizing power systems.
Future policy priorities and AI application examples.
Highlights LinkedIn's role in closing green skills gap via upskilling, coaching, training, and partnerships. Mentions 200+ sustainability courses, $6M in ad grants, Green Coaches program, and partnerships with organizations like GRID Alternatives.
Skilling platform and program overview.
References LinkedIn's 2024 Green Skills Report insights: demand outpacing supply, higher hire rate for green skills, projected talent gap. Mentions gaming industry efforts like 'Sustainafest' summit.
Data insights from report and cross-industry skilling efforts.
Introduces Appendix section with two components: How we report (A) and Endnotes (B).
Simple appendix contents page.
Details reporting principles: transparency, alignment with GHG Protocol and GRI, coverage scope. Discusses stakeholder engagement, ESG priority identification (distinct from financial materiality), governance (Board committee oversight), and includes forward-looking statements disclaimer.
Methodology, governance, and disclaimer information.
Begins the endnotes section, providing citations and detailed explanations for claims and data points referenced throughout the report (e.g., WEF citation, EPA calculations, material definitions, product specifications).
Reference list beginning.
Final page with call to action to learn more and sign up for updates. Repeats report title.
Closing call to action and branding.
Częste pytania dotyczące tego slajdu i podstawowej treści prezentacji.
Microsoft aims to be carbon negative, water positive, and zero waste by 2030, while also protecting more land than it uses. Specifically, this means removing more carbon than it emits, replenishing more water than it consumes globally, achieving zero waste across operations and products, and ensuring ecosystem protection exceeds its operational land footprint.
Microsoft employs AI across multiple fronts: optimizing datacenter energy and cooling efficiency (saving 30% energy, 27% water in trials), monitoring biodiversity and ecosystems (e.g., Project Guacamaya in the Amazon), improving water management through leak detection and precision irrigation, developing greener software via tools and guidelines, and powering its Planetary Computer platform to analyze environmental data at scale.
Yes, but challenges remain. While Microsoft's total emissions (Scope 1,2,3) increased by 23.4% from its baseline due to AI and cloud expansion, this growth was modest relative to a 168% increase in energy use and 77% revenue growth. Progress includes a 29.9% reduction in Scope 1 & 2 emissions, contracting 34 GW of carbon-free electricity (18x growth since 2020), and signing long-term agreements for nearly 30 million metric tons of carbon removal. Addressing Scope 3 emissions (up 26%), which form 97% of the total, is the current focus.
Circular Centers are Microsoft facilities dedicated to recovering parts and components from decommissioned cloud hardware for reuse and recycling. Launched in 2020, six centers now operate globally. In FY24, they achieved a 90.9% reuse and recycling rate for servers and components, surpassing the 90% target a year early. These centers are central to Microsoft's zero waste strategy, extending product life and reducing the need for new materials.
Microsoft provides technology and solutions through 'Microsoft for Sustainability,' which includes platforms like Sustainability Manager and Microsoft Fabric to help customers centralize and analyze ESG data. It also offers tools for developing green software, products like energy-efficient Surface devices and Xbox consoles, and the Planetary Computer for environmental data analysis. These tools help customers measure, reduce, and report on their environmental impact.
Microsoft actively advocates for policies that accelerate decarbonization and sustainability markets. This includes supporting carbon-free electricity expansion and grid infrastructure reform in the US, EU, and Asia; promoting robust and interoperable carbon reporting standards; shaping regulations for AI's role in sustainability; and engaging on issues like carbon removal certification and water reuse. The goal is to create market conditions and regulatory frameworks that enable Microsoft and others to achieve their climate goals.
Microsoft is tackling this through a multi-pronged approach: 1) Designing and building more efficient datacenters using advanced cooling (liquid cooling), low-carbon materials (mass timber), and renewable energy. 2) Improving operational efficiency via AI-powered workload scheduling and power optimization. 3) Investing in and procuring massive amounts of carbon-free electricity and carbon removal to offset emissions. 4) Developing guidelines and tools (like the Azure Well-Architected Framework for AI) to ensure AI applications themselves are built and run efficiently.
The report showcases diverse partnerships: co-founding the Symbiosis Coalition with Google, Meta, and Salesforce to demand high-quality carbon removal; working with the Seattle Aquarium and Xbox to restore kelp forests using ROVs; collaborating with NGOs like The Nature Conservancy and Conservation International on water and ecosystem projects; partnering with universities on climate research; and engaging with suppliers globally to transition their operations to 100% carbon-free electricity.

Create Your Own Slides
Turn your ideas into professional presentations in seconds with 2slides AI.
Odwołuj się do profesjonalnych projektów, wybierz swój styl i generuj slajdy z idealnym renderowaniem tekstu. Napędzane przez Nano Banana—zacznij tworzyć swoją prezentację teraz.
Twój Agent AI dla slajdów. Oszczędzaj czas, błyszcz szybciej dzięki inteligentnemu tworzeniu prezentacji.




© 2026 2slides. Wszelkie prawa zastrzeżone.