
Należy do zbioru Przykłady prezentacji dla inwestorów
Edison International Q3 2026 Earnings Presentation — Edison International (NYSE: EIX), the S&P 500 parent of Southern California Edison (SCE), presents third-quarter 2026 financial results dated October 29, 2026. The 21-slide deck was filed with the SEC as an exhibit (Exhibit 99.3) to Form 8-K. It reports Q3 2026 GAAP EPS of $1.88 and core EPS of $1.92 (vs. $2.34 core in Q3 2025), reaffirms 2026 core EPS guidance of $5.90–6.20, reiterates a 5–7% core EPS CAGR for 2025–2030, and covers the push for durable California wildfire reform, the Eaton Fire decision framework and claims funding, a ~$38–41 billion 2026–2030 capex plan, ~7% SCE rate base growth, and the debt maturity profile.
Używa okładki tej prezentacji jako wzoru stylu dla slajdów tworzonych z Twojej treści. Możesz też wybrać dowolną stronę poniżej i użyć jej układu jako wzoru.
Szybka Nawigacja
Tagi
Udostępnij slajdy
Edison International Q3 2026 Earnings Presentation — Edison International (NYSE: EIX), the S&P 500 parent of Southern California Edison (SCE), presents third-quarter 2026 financial results dated October 29, 2026. The 21-slide deck was filed with the SEC as an exhibit (Exhibit 99.3) to Form 8-K. It reports Q3 2026 GAAP EPS of $1.88 and core EPS of $1.92 (vs. $2.34 core in Q3 2025), reaffirms 2026 core EPS guidance of $5.90–6.20, reiterates a 5–7% core EPS CAGR for 2025–2030, and covers the push for durable California wildfire reform, the Eaton Fire decision framework and claims funding, a ~$38–41 billion 2026–2030 capex plan, ~7% SCE rate base growth, and the debt maturity profile.
Szczegółowy widok każdej strony slajdu, w tym układu, kluczowej treści i elementów wizualnych.
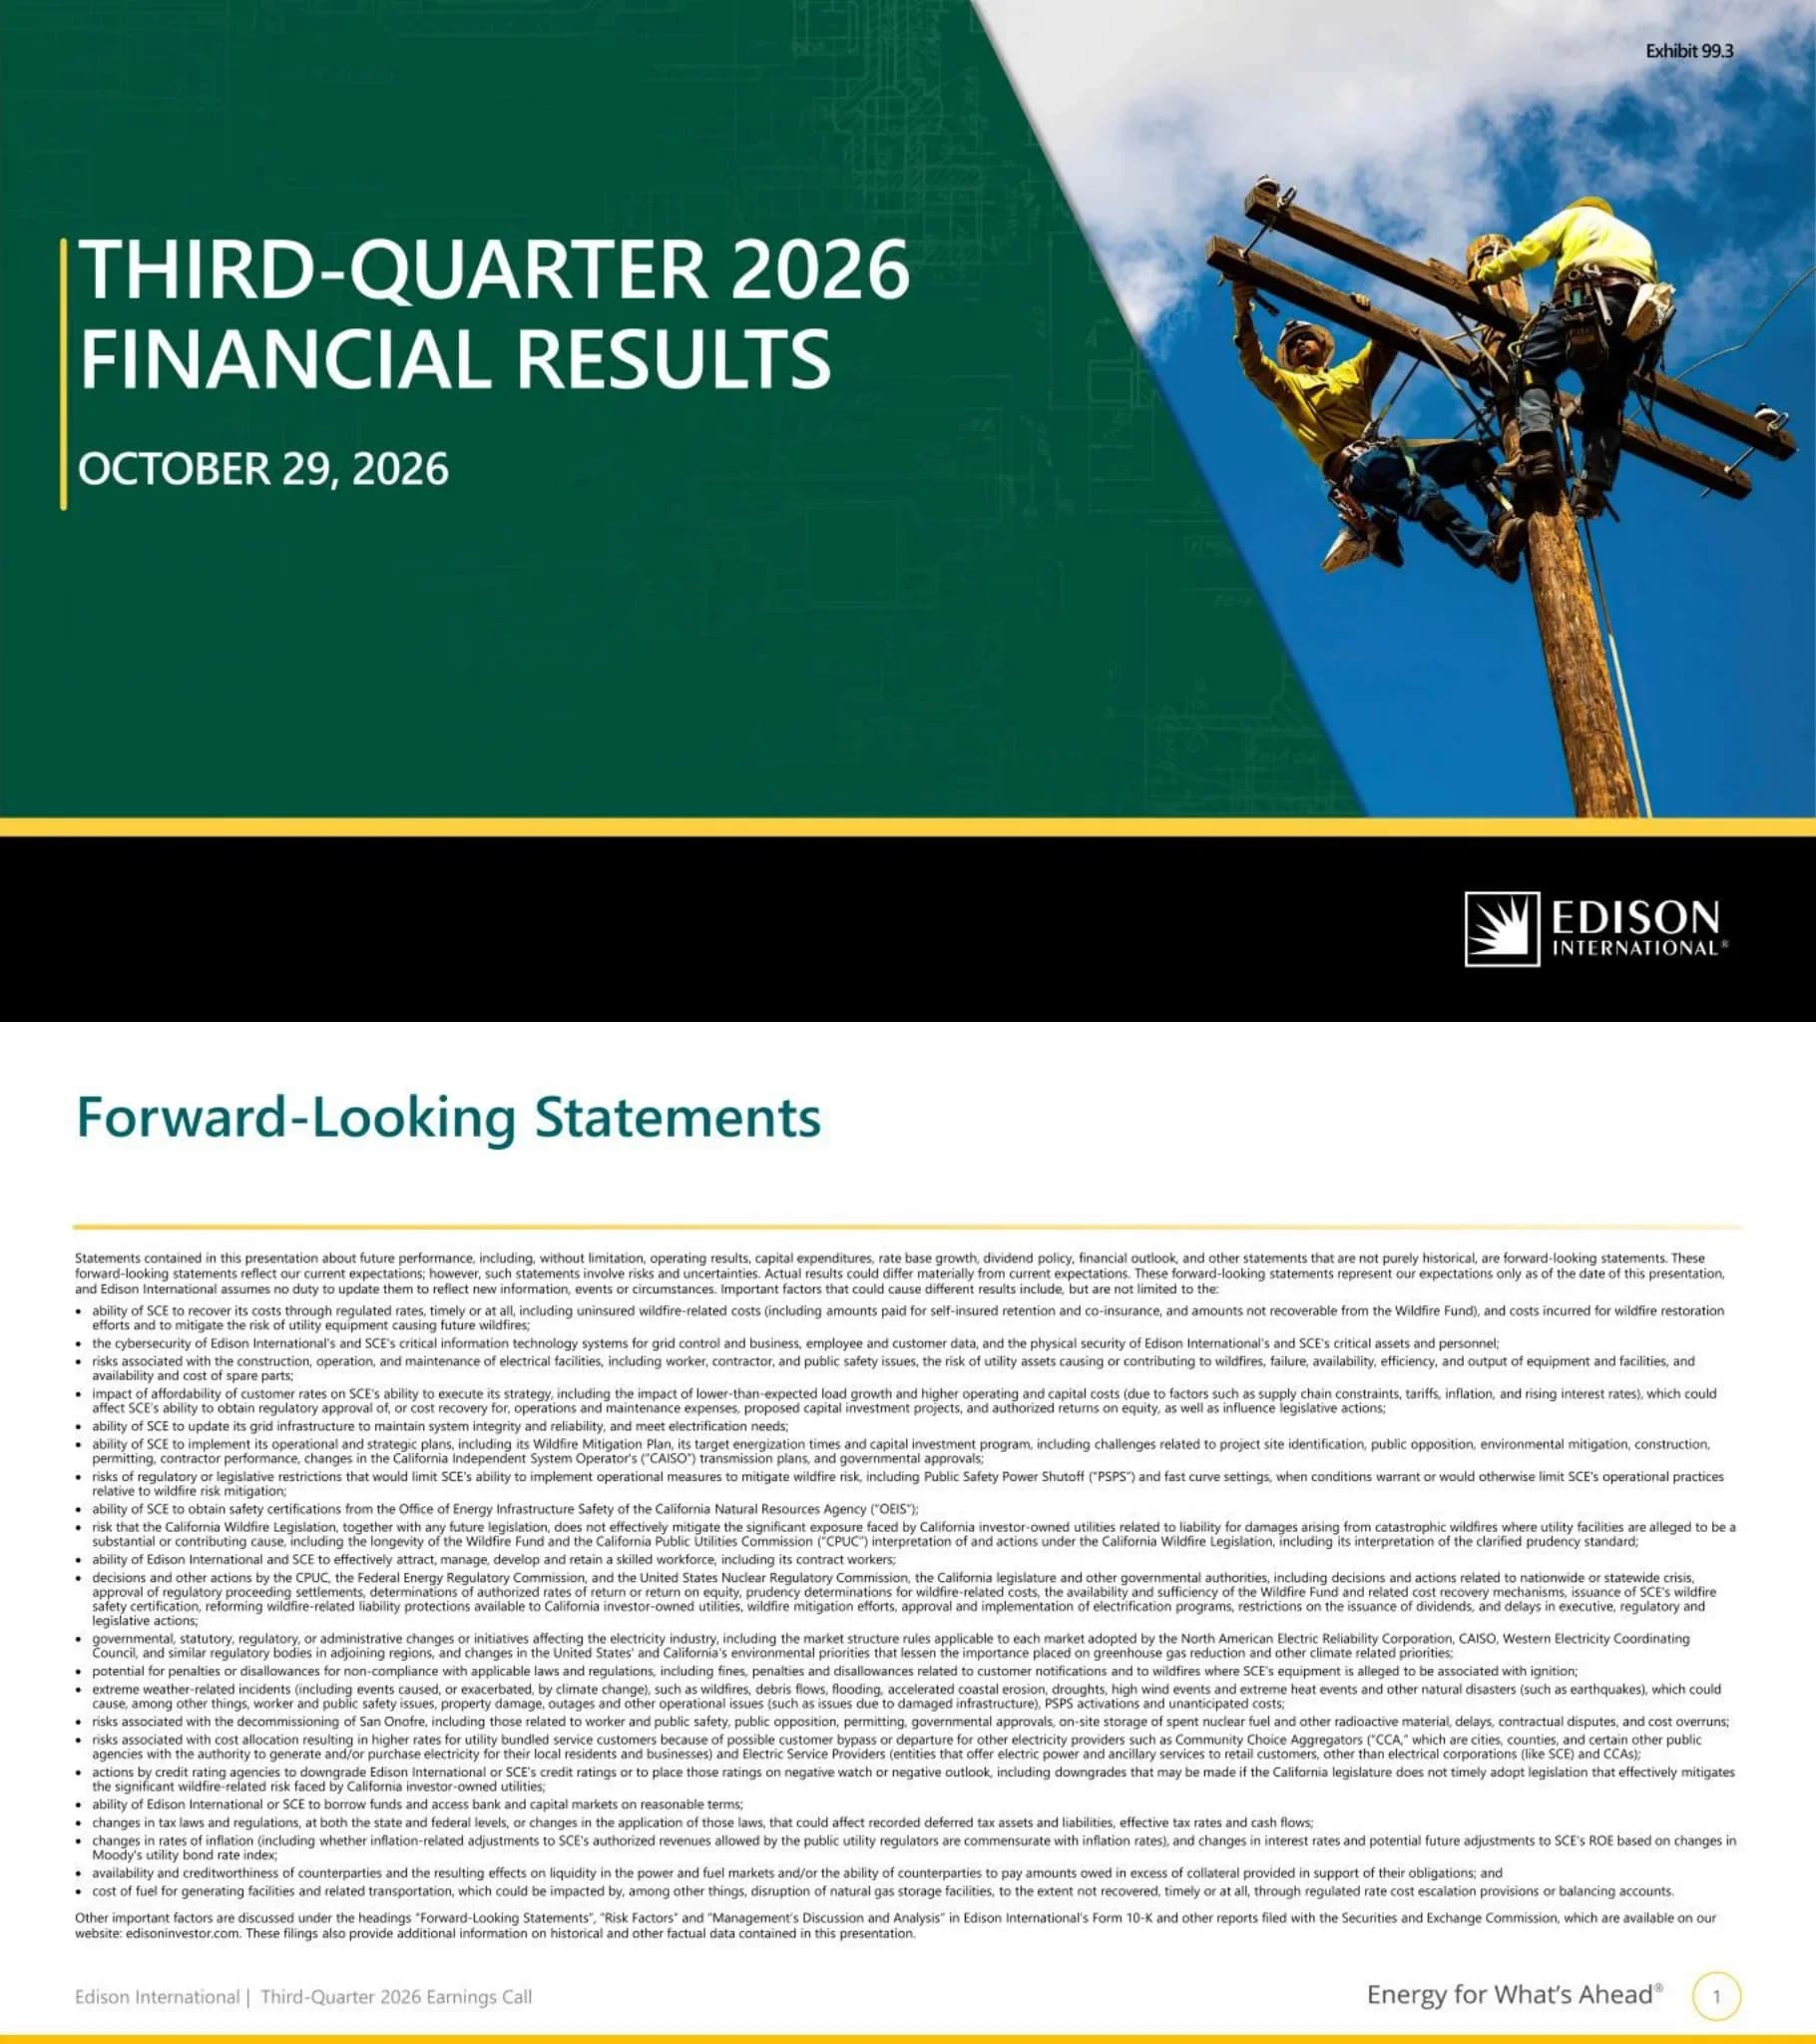
Cover slide marked Exhibit 99.3, announcing Edison International's third-quarter 2026 financial results dated October 29, 2026.
Split cover: dark green left panel with large white title and yellow date, diagonal photo panel on the right, black footer band with the Edison International logo.
Safe-harbor disclaimer listing risk factors including wildfire cost recovery and the Wildfire Fund, CPUC and FERC decisions, OEIS safety certification, cybersecurity, PSPS practices, extreme weather, San Onofre decommissioning, customer departure to CCAs, credit ratings, tax and interest-rate changes; refers readers to the Form 10-K and edisoninvestor.com.
Single dense text page: heading, intro paragraph, long bulleted list of risk factors in small type, closing paragraph.
Four messages: SCE has hardened about 90% of its distribution system in high fire risk areas; durable wildfire reform with a clear liquidity source and a true shareholder liability cap not tied to the Wildfire Fund remains a priority; 2026 core EPS guidance of $5.90–6.20 is reaffirmed; and 5–7% core EPS growth from 2025 to 2030 is reiterated (CAGR from a $5.84 base). KPI tiles show Q3 2026 GAAP EPS of $1.88 and core EPS of $1.92.
Left column of four numbered message bars; right side has a photo background overlaid with four dark KPI tiles in yellow figures.
Sacramento status as of October 28, 2026: the regular legislative session ended without reform, leaving California's wildfire liability framework unchanged. A long-term solution still needs a durable liquidity source for claims, a shareholder liability cap not tied to the life of the Wildfire Fund, and support for affordability and grid investment. SCE and other IOUs continue engaging stakeholders and support a special session; otherwise efforts continue with a new Governor and Legislature in 2027. Key dates: Nov. 2 CPUC report on the statewide impact of lacking structural reform; Nov. 15 constitutional deadline to pass and present a bill; 2027 next session. A sidebar lists costs of inaction: higher customer costs from elevated credit spreads, reduced grid investment, and pressure on California's economy.
Two-thirds-width status table with row labels in teal and descriptions at right, a three-column timeline row at the bottom, plus a cream sidebar titled 'Costs of Inaction'.
Three sequential tracks: (1) Legal — claims and litigation resolved through the Wildfire Recovery Compensation Program, settlements or judgment, output being costs paid to plaintiffs; (2) CPUC regulatory — prudence review after claims are resolved, where safety certification creates a presumption of prudence and the CPUC may allow full, partial or no recovery; (3) Wildfire Fund administration — if the CPUC disallows amounts withdrawn, SCE reimburses the Fund subject to a cap, unless the administrator finds conscious or willful disregard, which would remove the cap up to the disallowed amount.
Three equal columns with numbered headings, a framing question in italics, bullet points, and an 'OUTPUT' line at the bottom of each; chevrons between columns indicate sequence.
Compares three standards: CPUC prudence (actions consistent with a reasonable operator), felony liability in criminal court (criminal intent or recklessness beyond reasonable doubt), and conscious or willful disregard under the Wildfire Fund administrator (intentional conduct aware of harm; noted as undefined in AB 1054). SCE's assessment based on information to date: it expects to make a good-faith showing of prudence and sees no basis for felony liability or a willful-disregard finding.
Two columns: left lists each standard with a yellow arrow bullet, right gives SCE's assessment in bold; large yellow arrows connect each pair, with a concluding statement under a chevron divider.
Q3 2026 basic EPS $1.88 vs. $2.16 (SCE $2.10, Parent & Other $(0.22)); non-core items $(0.04) vs. $(0.18); core EPS $1.92 vs. $2.34, down $0.42. Key SCE core drivers: lower revenue $(0.62), higher O&M $(0.06), lower depreciation +$0.09, higher property and other taxes $(0.03), lower other income $(0.02), income taxes +$0.18, preference dividends +$0.02, totaling $(0.44). Takeaway: the decline mainly reflects adoption of the 2025 GRC final decision in Q3 2025, while Parent & Other improved on lower preferred dividends partly offset by higher interest expense. Diluted EPS was $1.87 vs. $2.16.
Three panels: EPS comparison table (Q3 2026, Q3 2025, variance), Key SCE and EIX EPS driver bridge, and a 'Takeaways' sidebar separated by a yellow vertical rule with a chevron.
2026–2030 capital expenditures by year (CPUC + FERC): 2026 $7.3B (6.5 + 0.8), 2027 $7.6B (6.7 + 0.9), 2028 $7.6B (6.7 + 0.9), 2029 $9.0B (7.9 + 1.1), 2030 $9.1B (8.1 + 1.0); range case $7.1B, $7.3B, $7.2B, $8.0B, $7.9B. Forecast includes the 2025 GRC approval, CAISO-awarded FERC transmission projects, the advanced metering infrastructure program (~50% of $3.1B spend in 2026–2030) and a planned 2029 GRC request; beyond 2030, further GRC investments, ~$2B of CAISO transmission projects and the rest of AMI spend in 2031–2033.
Stacked column chart on the left with range-case values beneath the axis; cream sidebar on the right listing forecast inclusions and beyond-2030 opportunities.
SCE weighted-average rate base: 2025 recorded $47.6B (CPUC 40.1 + FERC 7.5), 2026 $50.8B, 2027 $54.4B, 2028 $58.1B, 2029 $62.6B, 2030 $67.9B (58.4 + 9.5), a ~7% CAGR. Range case: $50.8B, $54.3B, $57.7B, $61.7B, $66.1B for 2026–2030. Sidebar repeats forecast inclusions and beyond-2030 opportunities.
Stacked column chart with a bracket arrow and oval callout for the ~7% CAGR, range-case row beneath, cream sidebar at right.
Term loan and long-term debt maturities as of September 30, 2026 ($ millions): 2026 $600 (EIX Parent term loan due Dec. 22, 2026), 2027 $2,450 (SCE 1,850 / Parent 600), 2028 $3,389 (1,739 / 1,650), 2029 $3,909 (2,859 / 1,050), 2030 $1,950 (1,400 / 550); weighted-average rates 5.3%, 5.3%, 4.9%, 4.8%, 4.7%. Variable-rate long-term debt is $0; short-term debt is ~$0.8B of commercial paper and term loan at ~5.0%.
Stacked column chart of maturities by issuer with weighted-average rate pills under each year; right panel with two large callout figures.
Core EPS guidance ranges: SCE EPS 6.81–7.07 (2026), 7.20–7.53 (2027), 7.74–8.04 (2028); EIX Parent and Other (0.91)–(0.87), (0.95)–(0.88), (1.00)–(0.90); EIX consolidated core EPS $5.90–6.20, $6.25–6.65 (~7% growth) and $6.74–7.14 (~7.5% growth); share count 385 million each year. Note says tax effects assume a ~28% combined statutory rate.
Clean guidance table with year columns; consolidated row highlighted in yellow with oval growth callouts and arrows between years.
Core EPS grows from an original 2025 midpoint of $5.84 to a 2030 target of $7.45–8.20 (5–7% CAGR). 2026–2030 consolidated financing plan: uses are the $38–41B capital plan plus $7–9B of dividends (common and preferred); sources are $36–38B of net cash from operating activities plus $9–12B of incremental debt beyond refinancing — no equity issuance.
Two half-width charts: left a two-bar EPS chart with a CAGR arrow callout, right a sources-and-uses stacked block chart.
Investment thesis summary: 5–7% core EPS CAGR 2025–2030 underpinned by ~7% rate base growth and the $38–41B capital program; ~6% current dividend yield (based on the October 28, 2026 share price) with 22 consecutive years of dividend growth and a 45–55% target payout of SCE core earnings; lowest system average rate among California IOUs with rate growth expected at or below local inflation through 2030; and one of the strongest electrification profiles, with ~30–40% load growth expected by 2035 and nearly doubling by 2045 relative to 2025.
Four-row table: bold teal centered headline on the left of each row, two supporting statements on the right, thin divider lines between rows.
Section divider introducing the appendix.
Narrow dark green left panel with white title and yellow rule; full-bleed photo on the right with the logo in the lower corner.
Nine-month 2026 basic EPS $4.65 vs. $6.78; non-core items $(0.24) vs. $2.10; core EPS $4.89 vs. $4.68, up $0.21 (SCE core $5.53 vs. $5.42; Parent & Other $(0.64) vs. $(0.74)). SCE core drivers: higher revenue +$0.36, lower O&M +$0.07, higher depreciation $(0.09), higher property and other taxes $(0.05), higher interest expense $(0.30), lower other income $(0.02), income taxes +$0.09, preference dividends +$0.05, totaling +$0.11. Takeaway: growth from the 2025 GRC escalation mechanism, partly offset by the absence of a 2025 interest-expense benefit from the TKM Settlement Agreement. Diluted EPS $4.62 vs. $6.76.
Same three-panel layout as the Q3 summary: EPS table, driver bridge table, Takeaways sidebar.
As of September 30, 2026, SCE has recorded losses tied to settlements but EIX and SCE cannot reasonably estimate a range of total Eaton Fire losses. Total settlements entered into: $1.8B. Expected recoveries recorded: self-insurance $917MM, Wildfire Fund $859MM, FERC rates $70MM. Funding tiers: first $1 billion via customer-funded self-insurance; eligible third-party claims above that via Wildfire Fund reimbursement ($207MM received to date); amounts above Fund capacity can be securitized under SB 254, subject to CPUC approval. Footnotes not legible at this resolution beyond their general references to the Fund's Initial Account, the 2025 10-K and CPUC prudence.
Left half: status text with a right-aligned figures list; right half: three numbered circles with chevron arrows pointing to yellow funding-source labels.
Modeling inputs for 2027 / 2028: SCE rate base $54.3–54.4B / $57.7–58.1B; rate base mix CPUC/FERC 85%/15% and 86%/14%; authorized ROEs 10.03% CPUC / 10.30% FERC; authorized equity ratios 52% / 47.5%; SCE and EIX Parent debt refinancing and new issue rate 6.0–6.5% pre-tax; no equity issuance forecast through 2030; share count 385 million.
Single full-width table with bold variable names, grey unit qualifiers, and 2027 / 2028 columns; some cells span both years.
Reconciles GAAP to core earnings ($ millions): Q3 2026 basic earnings $724 (SCE 809, Parent (85)) vs. $832; nine months $1,789 vs. $2,611. Non-core items include wildfire-related claims net of recoveries, Wildfire Fund expense $(36) in the quarter, 2025 GRC disallowed capex charges in 2025, Trio disposition losses and EIS-insured claims changes; total non-core $(14) in Q3 2026 and $(91) year to date. Core earnings $738MM in Q3 2026 vs. $901MM, and $1,880MM year to date vs. $1,803MM.
Centered financial table with four columns (Q3 2026, Q3 2025, 2026 YTD, 2025 YTD), shaded total rows and italic subtotals.
Per-share version of the reconciliation: basic EPS $1.88 / $2.16 (Q3) and $4.65 / $6.78 (YTD); non-core items $(0.04), $(0.18), $(0.24) and $2.10; core EPS $1.92, $2.34, $4.89 and $4.68. EPS is based on a weighted-average share count of 385 million for both years.
Centered table mirroring the prior slide's structure in per-share terms.
Reconciles 2026 guidance: basic EIX EPS $5.66–$5.96 plus total non-core items of $(0.24) gives core EIX EPS of $5.90–$6.20; non-core items are presented as recorded.
Small centered Low / High table with shaded total rows on an otherwise open slide.
Defines core earnings and core EPS as basic earnings less non-core items (discontinued operations, write-downs, impairments, wildfire-related claims, legal, tax and regulatory outcomes, exit activities), explains that forward core EPS guidance for 2027, 2028 and 2030 cannot be reconciled to GAAP without unreasonable effort, and lists the EIX investor relations contacts (Vice President and Principal Manager).
Two body paragraphs followed by a centered contact block with names, phone numbers and linked email addresses.
Częste pytania dotyczące tego slajdu i podstawowej treści prezentacji.
Q3 2026 GAAP (basic) EPS was $1.88 and core EPS was $1.92, compared with $2.16 and $2.34 in Q3 2025. Core earnings were $738 million versus $901 million. The decline mainly reflects timing from the 2025 GRC final decision being adopted in Q3 2025. Year to date, core EPS rose to $4.89 from $4.68.
EIX reaffirmed 2026 core EPS guidance of $5.90–6.20, with 2027 guidance of $6.25–6.65 and 2028 guidance of $6.74–7.14, all on 385 million shares. It also reiterated 5–7% core EPS growth from 2025 to 2030, implying a 2030 target of $7.45–8.20 from a $5.84 base.
The 2026–2030 capital plan is about $38–41 billion, rising from $7.3 billion in 2026 to $9.1 billion in 2030. SCE's weighted-average rate base is projected to grow from $47.6 billion in 2025 to $67.9 billion in 2030, roughly a 7% compound annual growth rate.
As of September 30, 2026, SCE had entered into $1.8 billion of settlements and recorded expected recoveries of $917 million from self-insurance, $859 million from the Wildfire Fund and $70 million from FERC rates, but the companies cannot yet estimate the full range of losses. The deck explains the separate legal, CPUC prudence and Wildfire Fund processes, and states SCE's view that it can show prudence and that there is no basis for felony liability or a willful-disregard finding.
No. The 2026–2030 financing plan funds the $38–41 billion capital program and $7–9 billion of dividends with $36–38 billion of operating cash flow and $9–12 billion of incremental debt, and the modeling slide states no equity issuance is forecast through 2030.
It is Edison International's third-quarter 2026 earnings presentation, dated October 29, 2026, filed with the SEC as an exhibit (Exhibit 99.3) to Form 8-K. The slides were rasterized as images in the EDGAR filing, so some small footnotes are not legible at that resolution.
Yes. The gallery page offers the original PDF plus an editable PPTX converted from it. Because the SEC filing stores each slide as an image, the PPTX is best used as a reference for layout and structure rather than for editing every chart value.
It shows a compact structure that many regulated utilities use: key messages with KPI tiles, a regulatory and policy update, quarterly EPS bridges, stacked capex and rate base charts split by CPUC and FERC jurisdiction, a debt maturity chart, multi-year guidance tables, modeling assumptions, and GAAP-to-core reconciliations in the appendix.
Primary filing of the earnings call slides as an exhibit to Form 8-K

Create Your Own Slides
Turn your ideas into professional presentations in seconds with 2slides AI.
Odwołuj się do profesjonalnych projektów, wybierz swój styl i generuj slajdy z idealnym renderowaniem tekstu. Napędzane przez Nano Banana—zacznij tworzyć swoją prezentację teraz.
Twój Agent AI dla slajdów. Oszczędzaj czas, błyszcz szybciej dzięki inteligentnemu tworzeniu prezentacji.


© 2026 2slides. Wszelkie prawa zastrzeżone.