
Należy do zbioru Przykłady prezentacji dla inwestorów
DBS Q3 2026 Results Presentation: the 22-slide CFO deck DBS Group Holdings presented on November 5, 2026 with its 3Q 2026 financial results, lodged with SGX (Singapore Exchange). It reports 3Q net profit of S$2.81 billion (S$ = Singapore dollars), down 5% YoY and 9% QoQ, and a record 9M net profit of S$8.82 billion, up 2%, on record 9M total income of S$17.9 billion. Group net interest income rose 4% QoQ to S$3.71 billion with NIM stable at 1.87%, loans grew 3% QoQ and deposits 3% QoQ in constant-FX terms, Wealth segment AUM reached S$544 billion on record 3Q net new money of S$15 billion, while markets trading income fell 65% YoY. Asset quality and capital slides show an NPL ratio of 0.9%, SP at 17bp, allowance coverage of 134%, a transitional CET1 ratio of 15.9% (14.0% fully phased-in), and a 3Q total dividend of 81 Singapore cents per share (66¢ ordinary plus 15¢ Capital Return).
Używa okładki tej prezentacji jako wzoru stylu dla slajdów tworzonych z Twojej treści. Możesz też wybrać dowolną stronę poniżej i użyć jej układu jako wzoru.
Szybka Nawigacja
Tagi
Udostępnij slajdy
DBS Q3 2026 Results Presentation: the 22-slide CFO deck DBS Group Holdings presented on November 5, 2026 with its 3Q 2026 financial results, lodged with SGX (Singapore Exchange). It reports 3Q net profit of S$2.81 billion (S$ = Singapore dollars), down 5% YoY and 9% QoQ, and a record 9M net profit of S$8.82 billion, up 2%, on record 9M total income of S$17.9 billion. Group net interest income rose 4% QoQ to S$3.71 billion with NIM stable at 1.87%, loans grew 3% QoQ and deposits 3% QoQ in constant-FX terms, Wealth segment AUM reached S$544 billion on record 3Q net new money of S$15 billion, while markets trading income fell 65% YoY. Asset quality and capital slides show an NPL ratio of 0.9%, SP at 17bp, allowance coverage of 134%, a transitional CET1 ratio of 15.9% (14.0% fully phased-in), and a 3Q total dividend of 81 Singapore cents per share (66¢ ordinary plus 15¢ Capital Return).
Szczegółowy widok każdej strony slajdu, w tym układu, kluczowej treści i elementów wizualnych.
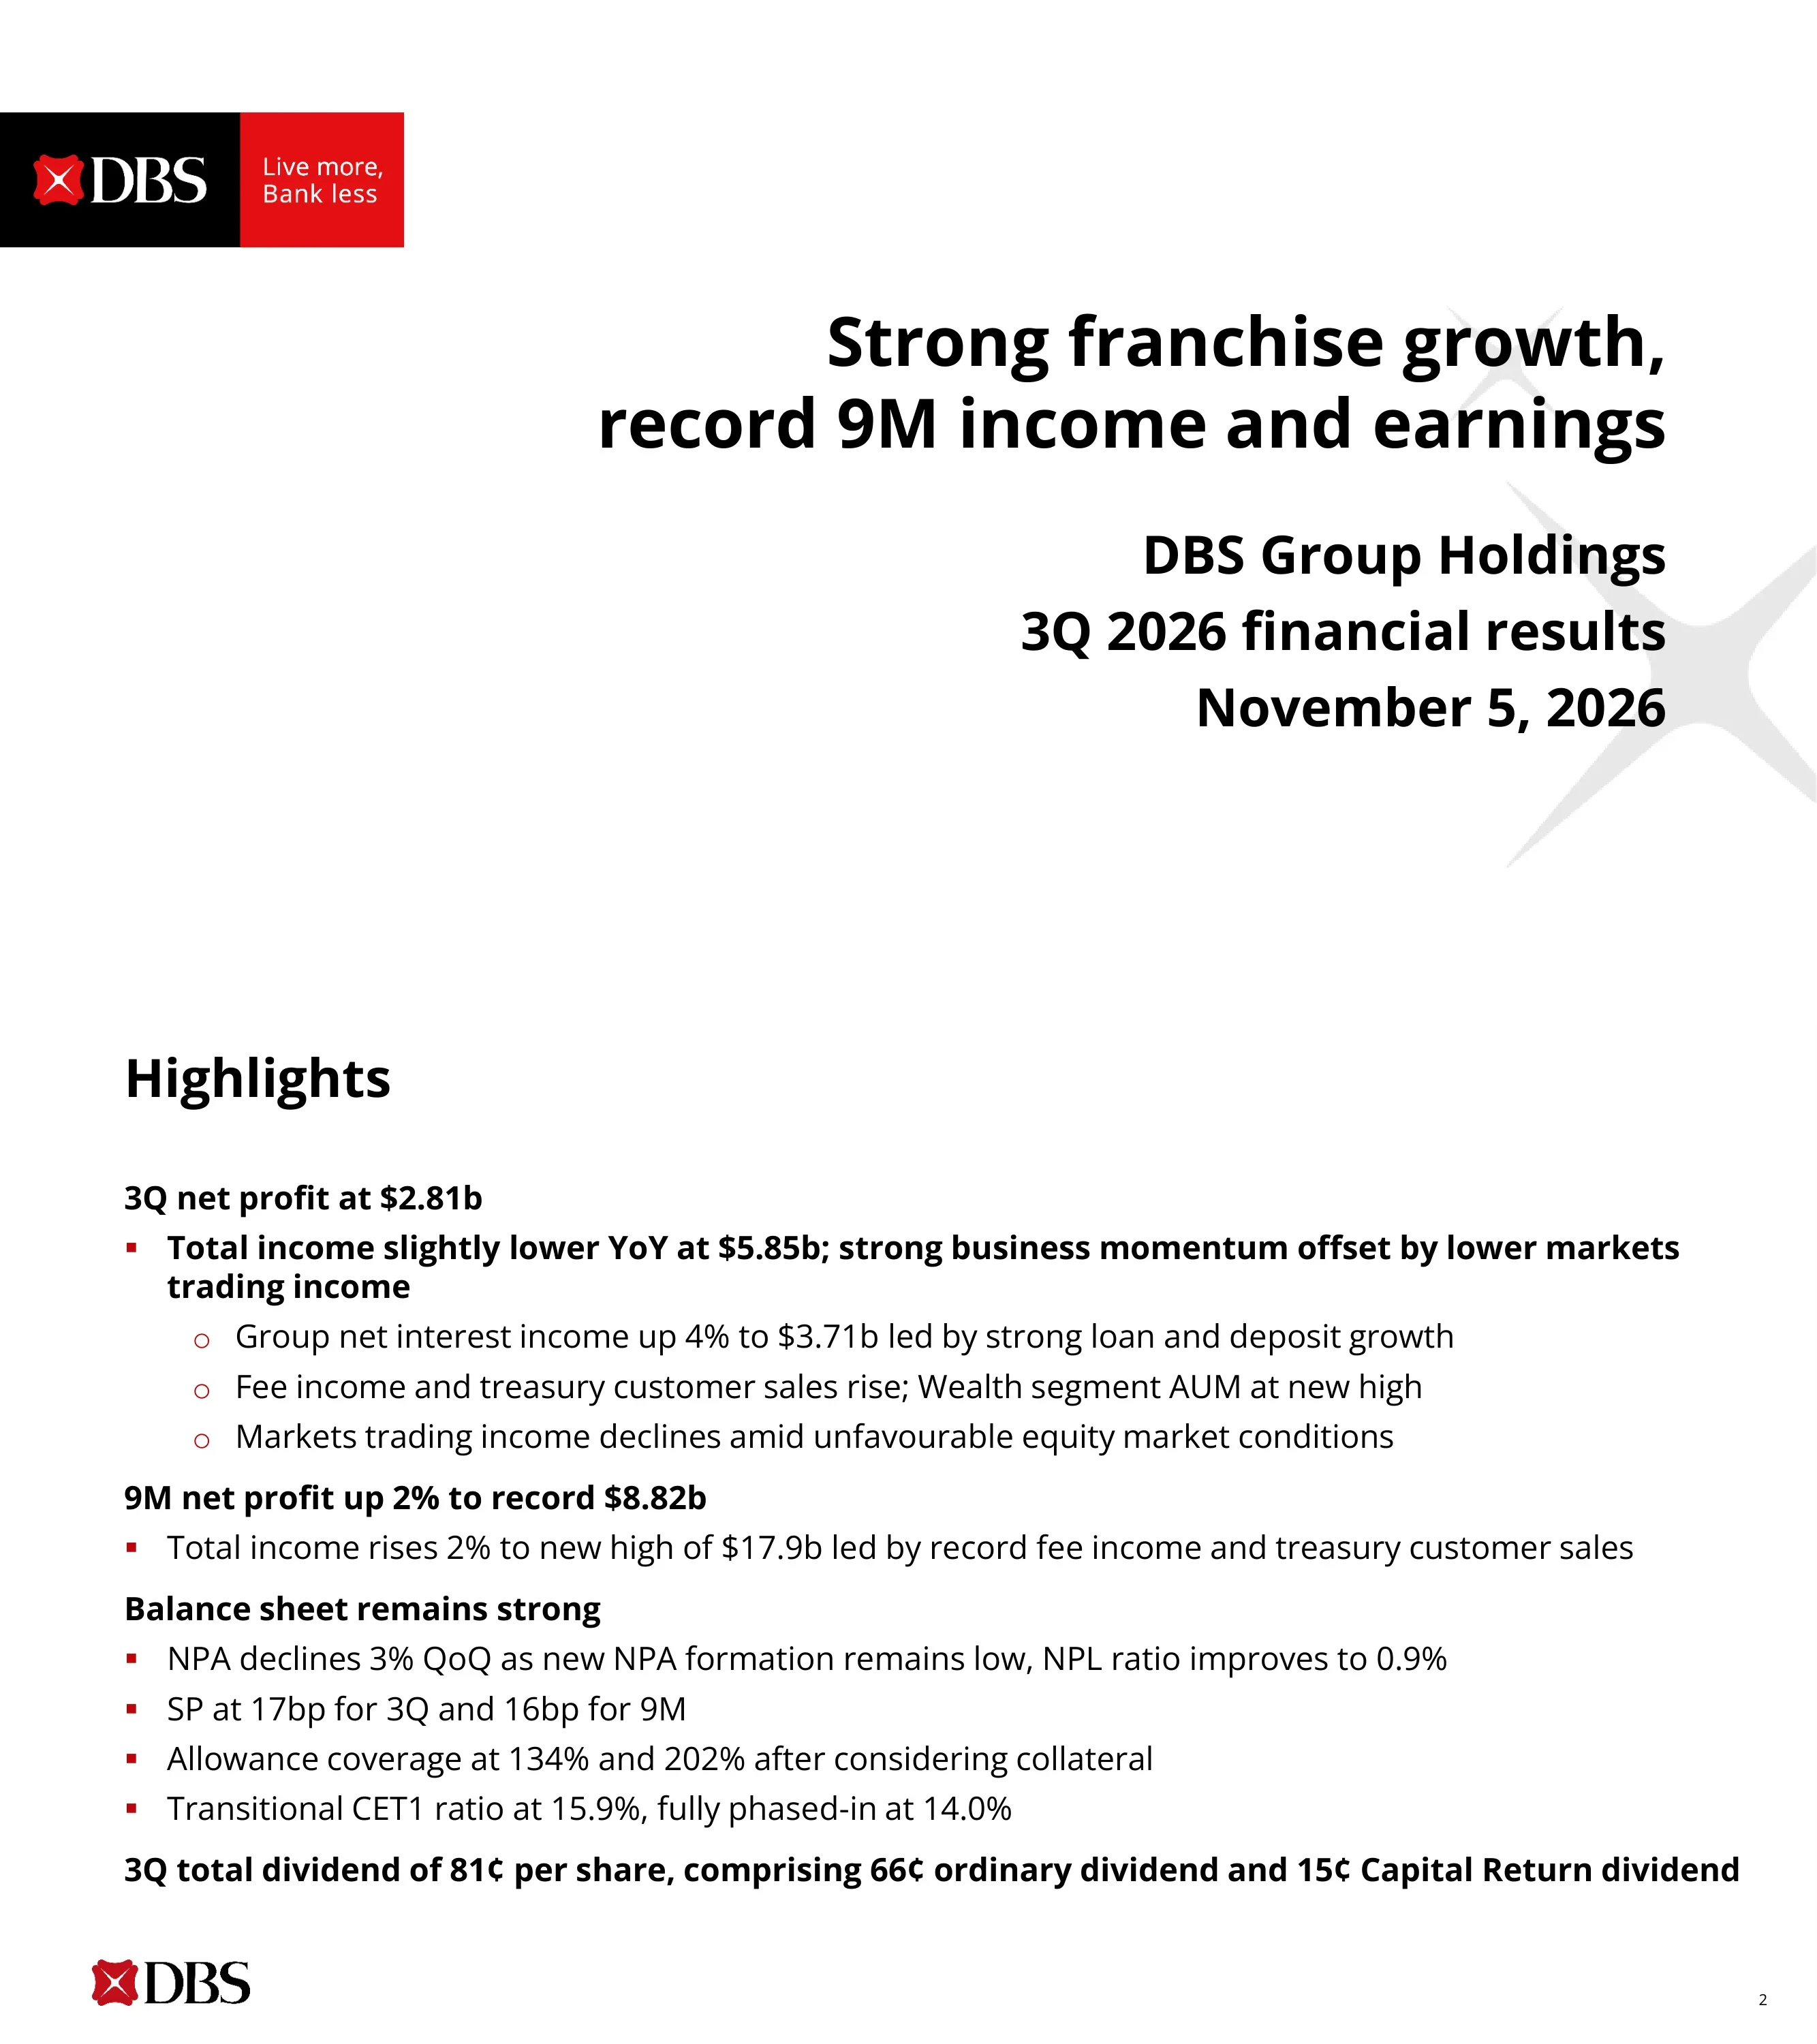
Cover slide for DBS Group Holdings 3Q 2026 financial results, dated November 5, 2026, with the headline message "Strong franchise growth, record 9M income and earnings".
Brand block top-left (black DBS logo panel and red "Live more, Bank less" tagline panel); right-aligned bold headline over company name, period and date; large faint grey DBS X motif in the lower right.
3Q net profit was S$2.81b; total income was slightly lower YoY at S$5.85b as group NII rose 4% to S$3.71b on loan and deposit growth, fee income and treasury customer sales rose and Wealth AUM hit a new high, but markets trading income fell on unfavourable equity markets. 9M net profit rose 2% to a record S$8.82b on total income up 2% to S$17.9b. NPA fell 3% QoQ, NPL ratio improved to 0.9%, SP was 17bp for 3Q and 16bp for 9M, allowance coverage was 134% (202% after collateral), transitional CET1 was 15.9% (14.0% fully phased-in), and the 3Q dividend was 81¢ per share (66¢ ordinary plus 15¢ Capital Return).
Single-column text slide with four bold section headers (3Q profit, 9M profit, balance sheet, dividend), red square bullets and hollow red circle sub-bullets; DBS logo bottom-left, page number bottom-right.
3Q26 commercial book income was a record S$5,693m (+4%) and markets trading S$152m (-65%), giving total income of S$5,845m (-1%), of which NII S$3,711m (+4%); expenses S$2,373m (-1%), profit before allowances S$3,472m (-2%), allowances S$175m (+41%) and net profit S$2,813m (-5%). The bridge from 3Q25 net profit of S$2,954m adds NII +18, fees +75 and treasury customer sales +107, subtracts markets trading -287, adds lower expenses +20, and subtracts GP -29, SP -22 and tax and others -23. Commentary: NII growth from balance sheet and hedging more than offset lower Sora, and the cost-income ratio was 41%.
Top half split into a P&L summary table (left, with "record" callout tag and boxed commercial book / markets rows) and four red-bullet takeaways (right); bottom half is a full-width earnings waterfall from 3Q25 to 3Q26 net profit with % change labels above each bar and a "Commercial book" bracket under the first three drivers.
Versus 2Q26: commercial book +1%, markets trading -68%, total income -4%, NII +4%, expenses +1%, profit before allowances -7%, allowances +55% and net profit -9% to S$2,813m. The bridge from 2Q26 net profit of S$3,079m shows NII +93, fees -28, treasury customer sales +4, markets trading -317, expenses -26, GP -59, SP -3 and tax and others +70. Commentary: NII growth driven by balance sheet growth, fee income eased 2% while treasury customer sales stayed near the previous quarter's record, and SP was 17bp with a GP write-back of S$16m.
Same template as page 3: QoQ P&L table and takeaway bullets on top, full-width QoQ earnings waterfall below with green/red blocks and percentage labels.
9M26 commercial book income was a record S$16,876m (+3%), markets trading S$1,010m (-17%), record total income S$17,886m (+2%), NII S$10,786m (-1%), expenses S$7,022m (+2%), record profit before allowances S$10,864m (+2%), allowances S$478m (-18%) and record net profit S$8,822m (+2%). The bridge from 9M25 net profit of S$8,675m shows NII -368, fees +575, treasury customer sales +320, markets trading -210, expenses -145, GP +201, SP -97 and tax and others -129. NII was little changed as balance sheet growth and hedging mitigated rate headwinds; the cost-income ratio was stable at 39%.
Nine-month version of the earnings bridge template: P&L table with four "record" callout tags, takeaway bullets on the right, and a 9M25-to-9M26 waterfall across the bottom.
Group NIM was 1.96%, 1.93%, 1.89%, 1.87% and 1.87% from 3Q25 to 3Q26, and commercial book NIM fell from 2.40% to 2.16%. Group NII was S$3,578m, 3,593m, 3,494m, 3,581m and 3,711m, with the markets trading portion rising to S$135m in 3Q26 (commercial book NII S$3,576m). For 9M, group NIM went from 2.04% to 1.88% and commercial book NIM from 2.54% to 2.22%; NII was S$10,907m vs S$10,786m (commercial book S$10,902m vs S$10,534m; markets trading S$5m vs S$252m). Average Sora fell from 2.01% to 1.13% and Sofr from 4.33% to 3.65% over 9M; in 3Q26 Sora was 1.23% and Sofr 3.67%.
Two panels split by a dashed divider: left compares 9M25 with 9M26, right shows five quarters. Each panel stacks NIM line charts (black commercial book, red group) above stacked NII bars, with an average rates table (Sora, Sofr) along the bottom.
Deposits totalled S$650b at September 2026: SGD Casa S$212b, FCY Casa S$141b and FD and others S$297b. In constant-FX terms deposits grew S$42b over 9M (SGD Casa +15, FCY Casa +7, FD and others +21), with quarterly increases of +19 in 1Q26, +7 in 2Q26 (including -2 FCY Casa) and +16 in 3Q26 (SGD Casa +1, FCY Casa +7, FD +9). Growth came from both Casa and FD inflows.
Left stacked bar of the September 2026 deposit mix with labelled segments, middle 9M constant-FX change bar, right three quarterly change bars (including a negative segment below the axis), and a takeaway bullet on the far right.
Gross loans were S$484b at September 2026: IBG non-trade S$286b, IBG trade S$51b, CBG / WM S$144b and a small Others segment. In constant-FX terms loans grew S$36b over 9M (IBG non-trade +28, trade +1, CBG / WM +10, offset by a decline in Others), and by +8, +15 and +13 in 1Q26, 2Q26 and 3Q26. 3Q growth was driven by non-trade corporate (+11) and wealth management loans (+5), partly offset by trade (-1).
Same structure as the deposits slide: composition bar at left, 9M and quarterly constant-FX change bars in the middle with grey Others segments, two takeaway bullets at right.
Gross fee income was S$1,581m, 1,381m, 1,708m, 1,699m and 1,675m from 3Q25 to 3Q26. In 3Q26 wealth management contributed S$864m, cards S$311m, transaction services S$268m, loan-related S$192m and investment banking S$40m. Total fees rose 6% YoY (wealth management +9%). For 9M, fees rose 13% to S$5,082m from S$4,479m, with wealth management up 24% to S$2,690m, cards S$921m, transaction services S$781m, loan-related S$580m and investment banking S$110m.
Stacked bar chart with 9M pair on the left and five quarters on the right, five fee categories labelled down the left edge, totals above each bar and a YoY % table (total and wealth management) underneath.
Customer-driven non-interest income (net fee income plus treasury customer sales) was S$2,100m in 3Q26 (net fees S$1,432m, treasury customer sales S$668m), up from S$1,938m in 3Q25; quarterly totals were S$1,938m, 1,584m, 2,074m, 2,138m and 2,100m. 9M rose to a record S$6,312m from S$5,456m, with net fee income S$4,374m (vs S$3,799m) and treasury customer sales S$1,938m (vs S$1,657m).
Two-segment stacked bar chart, 9M pair on the left and five quarters on the right separated by a dashed line, totals above bars and segment values inside.
Wealth segment income (Treasures, Treasures Private Client and Private Bank) was S$1,637m in 3Q26 (non-interest income S$1,055m, NII S$581m), up 7% YoY with non-interest income up 12%. 9M income rose 13% to S$4,935m (non-interest income S$3,204m, +25%; NII S$1,731m). AUM grew from S$474b in 3Q25 to S$488b, 492b, 516b and S$544b, and net new money was S$7b, 12b, 10b, 11b and a record S$15b by quarter; 9M NNM was S$36b vs S$27b.
Stacked bars (red NII on peach non-interest income) for 9M and five quarters, with a four-row table underneath for total YoY %, non-interest income YoY %, AUM and NNM; footnote defines the Wealth segment.
Consumer Banking / Wealth Management 9M26 total income was S$8,213m vs S$8,045m (+2%): loans and deposits S$3,873m (-12%), investment products S$3,589m (+23%), cards S$744m (+4%) and others S$7m (-74%). Expenses were S$4,058m (+1%) and profit before allowances S$4,155m (+3%). Retail plus Wealth segment AUM rose 15% to S$697b and SGD savings deposits 12% to S$166b, with growth led by investment product sales and bancassurance.
Segment table with red header row (9M26, 9M25, YoY %), peach-shaded current-period column and a boxed income breakdown; two takeaway bullets on the right.
Institutional Banking Group 9M26 total income was S$6,901m vs S$6,755m (+2%): loans S$2,643m (+1%), trade S$503m (+6%), cash / SFS S$2,716m (-1%) and treasury and investment banking S$1,039m (+14%). Expenses were S$2,171m (+2%) and profit before allowances S$4,730m (+2%). IBG assets rose 10% to S$373b and GTS deposits 9% to S$227b; growth was led by record treasury customer income and transaction service fees.
Same segment-table template as page 12 with red header, peach current-period column, boxed income lines and a single takeaway bullet.
Treasury customer income was S$831m, 666m, 781m, 924m and 919m from 3Q25 to 3Q26 (3Q26 +10% YoY), while markets trading income was S$439m, 154m, 389m, 469m and S$152m (3Q26 -65%). For 9M, treasury customer income rose 21% to a record S$2,623m and markets trading income fell 17% to S$1,010m, for a combined S$3,633m vs S$3,397m. Footnote: treasury customer income comes from CBG and IBG, mainly fee and other non-interest income, and includes Equity Capital Markets, DBS Vickers and DBS Digital Exchange.
Two-segment stacked bars (peach treasury customer income on top of red markets trading) for 9M and five quarters, with a YoY % table for both lines below and a definition footnote.
Expenses were S$2,393m, 2,372m, 2,302m, 2,347m and 2,373m from 3Q25 to 3Q26 (3Q26 staff S$1,483m, other S$890m), and the cost-income ratio was 40%, 44%, 39%, 39% and 41%. 9M expenses rose to S$7,022m from S$6,877m (staff S$4,548m vs S$4,450m; other S$2,474m vs S$2,427m) with the cost-income ratio unchanged at 39%.
Cost-income ratio line chart across the top, stacked expense bars (peach staff, red other) below, 9M pair and five quarters separated by a dashed divider.
NPA roll-forward: 3Q26 started at S$4,764m; IBG and others contributed -97 (new NPAs 82, upgrades, settlements and recoveries -139, write-offs -40), CBG / WM +15 and translation -50, ending at S$4,632m and an NPL ratio of 0.9% (1.0% in the prior four quarters). For 9M26, NPAs moved from S$4,843m to S$4,632m with IBG new NPAs of S$343m; 9M25 went from S$5,036m to S$4,627m. 4Q25 had S$751m of new IBG NPAs.
Wide data table with red column headers for 9M25, 9M26 and five quarters; peach shading on the current columns and boxed IBG detail rows.
3Q26 specific provisions: IBG and others S$115m (new NPL charges 26, existing NPLs 122, less settlements 27 and recoveries 6), CBG / WM S$93m, SP for loans S$208m, other credit exposures -S$17m and total SP S$191m, or 17bp of loans. Quarterly total SP was S$170m, 415m, 157m, 188m and 191m (15, 36, 14, 16 and 17bp). 9M26 total SP was S$536m (16bp) vs S$430m (13bp) in 9M25.
Wide table in the same style as page 16 with red headers, indented add/subtract sub-rows inside boxes, rule lines above subtotal rows and an SP/loans (bp) row at the bottom.
Total allowance reserves were S$6,425m, 6,281m, 6,199m, 6,195m and S$6,199m from September 2025 to September 2026; at September 2026 GP reserves were S$3,786m and SP reserves S$2,413m. Reserves covered 134% of NPAs and 202% of unsecured NPAs, compared with 139% and 229% a year earlier.
Five stacked bars (light peach GP over darker orange SP) with totals above, and a coverage table (NPA and unsecured NPA %) underneath.
Transitional CET1 was 16.9%, 17.0%, 16.9%, 16.6% and 15.9% from September 2025 to September 2026, and total capital including Tier 2 was 17.8%, 17.9%, 17.5%, 17.2% and 16.5%. Fully phased-in CET1 fell from 15.1% to 14.0%, RWA rose from S$367b to S$398b and the leverage ratio eased from 6.2% to 5.7%. Adjusting for the Monetary Authority of Singapore (MAS) cut in the operational risk multiplier from 1.8x to 1.5x on 4 November 2026, September 2026 CET1 would be 16.1% transitional and 14.1% fully phased-in.
Five stacked capital-ratio bars (red CET1, peach Tier 2) with totals above, RWA and leverage rows below, a fully phased-in CET1 row, and a dashed-border grey callout box at the bottom.
Dividends in Singapore cents per share: 2024 totalled 222¢ (54¢ in each of 1Q-3Q and 60¢ in 4Q); 2025 totalled 306¢ (60¢ ordinary plus 15¢ Capital Return, or 75¢, in 1Q-3Q, then 66¢ plus 15¢, or 81¢, in 4Q); 2026 to date totals 243¢, with 81¢ (66¢ ordinary plus 15¢ Capital Return) in each of 1Q, 2Q and 3Q.
Three stacked yearly columns built from quarterly blocks (peach ordinary, red Capital Return bands), yearly totals on top, quarter labels on the left and brackets showing quarterly totals on the right of each column.
Three closing messages: sustained 3Q business momentum with robust growth in loans, deposits and wealth assets; structural opportunities captured across wealth management and institutional banking; and a more uncertain outlook, where a supportive rate environment and structural growth would help earnings while strong capital, liquidity and general allowance buffers provide resilience. A footnote gives the forward-looking statement caveat and refers readers to the full disclaimer in the Trading Update for the quarter.
Title plus three large bold statements stacked with wide spacing; small forward-looking statement footnote beside the DBS logo at the bottom.
Repeat of the cover slide closing the deck: DBS Group Holdings 3Q 2026 financial results, November 5, 2026, with the headline "Strong franchise growth, record 9M income and earnings".
Identical to page 1: brand block top-left, right-aligned headline and details, watermark X motif.
Częste pytania dotyczące tego slajdu i podstawowej treści prezentacji.
It is the 22-slide deck DBS Group Holdings presented with its 3Q 2026 financial results on November 5, 2026, lodged with SGX. It covers the quarter's earnings bridges, net interest income and margin, loans and deposits, fees, wealth management, CBG and IBG segment results, asset quality, capital ratios and dividends.
3Q net profit was S$2.81 billion (Singapore dollars), down 5% YoY and 9% QoQ, on total income of S$5.85 billion. 9M net profit was a record S$8.82 billion, up 2%, on record total income of S$17.9 billion. Group NIM was 1.87%, the NPL ratio 0.9%, transitional CET1 15.9%, and the 3Q dividend 81 cents per share.
The slides show commercial book income at a record S$5,693 million, with NII, fees and treasury customer sales all up YoY, but markets trading income fell 65% to S$152 million amid unfavourable equity market conditions. Higher allowances and tax also weighed, leaving net profit 5% lower YoY.
It is a full results deck. Under Singapore's half-yearly reporting regime many SGX-listed companies publish only a short business update for Q1 and Q3, but DBS publishes full quarterly results, so this presentation includes complete P&L, balance sheet, segment, asset quality and capital disclosures for the quarter and the nine months.
DBS lodges its results announcements and presentations with SGX and posts them on its investor relations website at dbs.com/investors. The deck's own summary slide refers readers to the full disclaimer in the Trading Update for the quarter.
Yes. The original PDF is available to download free from this page, together with page-by-page images and the slide-by-slide analysis below.
The deck uses earnings waterfall charts that colour each driver green or red by its effect on profit, five-quarter stacked bar charts with a YoY table underneath, and segment tables with a red header and a shaded current-period column. Each slide carries a single message headline, which makes a data-heavy results deck easy to follow.
Slide 19 notes that after the Monetary Authority of Singapore cut the operational risk multiplier from 1.8x to 1.5x on 4 November 2026, DBS's September 2026 CET1 ratio would be 16.1% on a transitional basis and 14.1% fully phased-in, compared with the reported 15.9% and 14.0%.
Official investor relations site with quarterly results announcements, presentations and financial statements.

Create Your Own Slides
Turn your ideas into professional presentations in seconds with 2slides AI.
Odwołuj się do profesjonalnych projektów, wybierz swój styl i generuj slajdy z idealnym renderowaniem tekstu. Napędzane przez Nano Banana—zacznij tworzyć swoją prezentację teraz.
Twój Agent AI dla slajdów. Oszczędzaj czas, błyszcz szybciej dzięki inteligentnemu tworzeniu prezentacji.


© 2026 2slides. Wszelkie prawa zastrzeżone.