
Constellation Energy Q2 2026 Earnings Presentation
Szybka Nawigacja
Tagi
Udostępnij slajdy
Constellation Energy Q2 2026 Earnings Presentation
Szczegółowy widok każdej strony slajdu, w tym układu, kluczowej treści i elementów wizualnych.
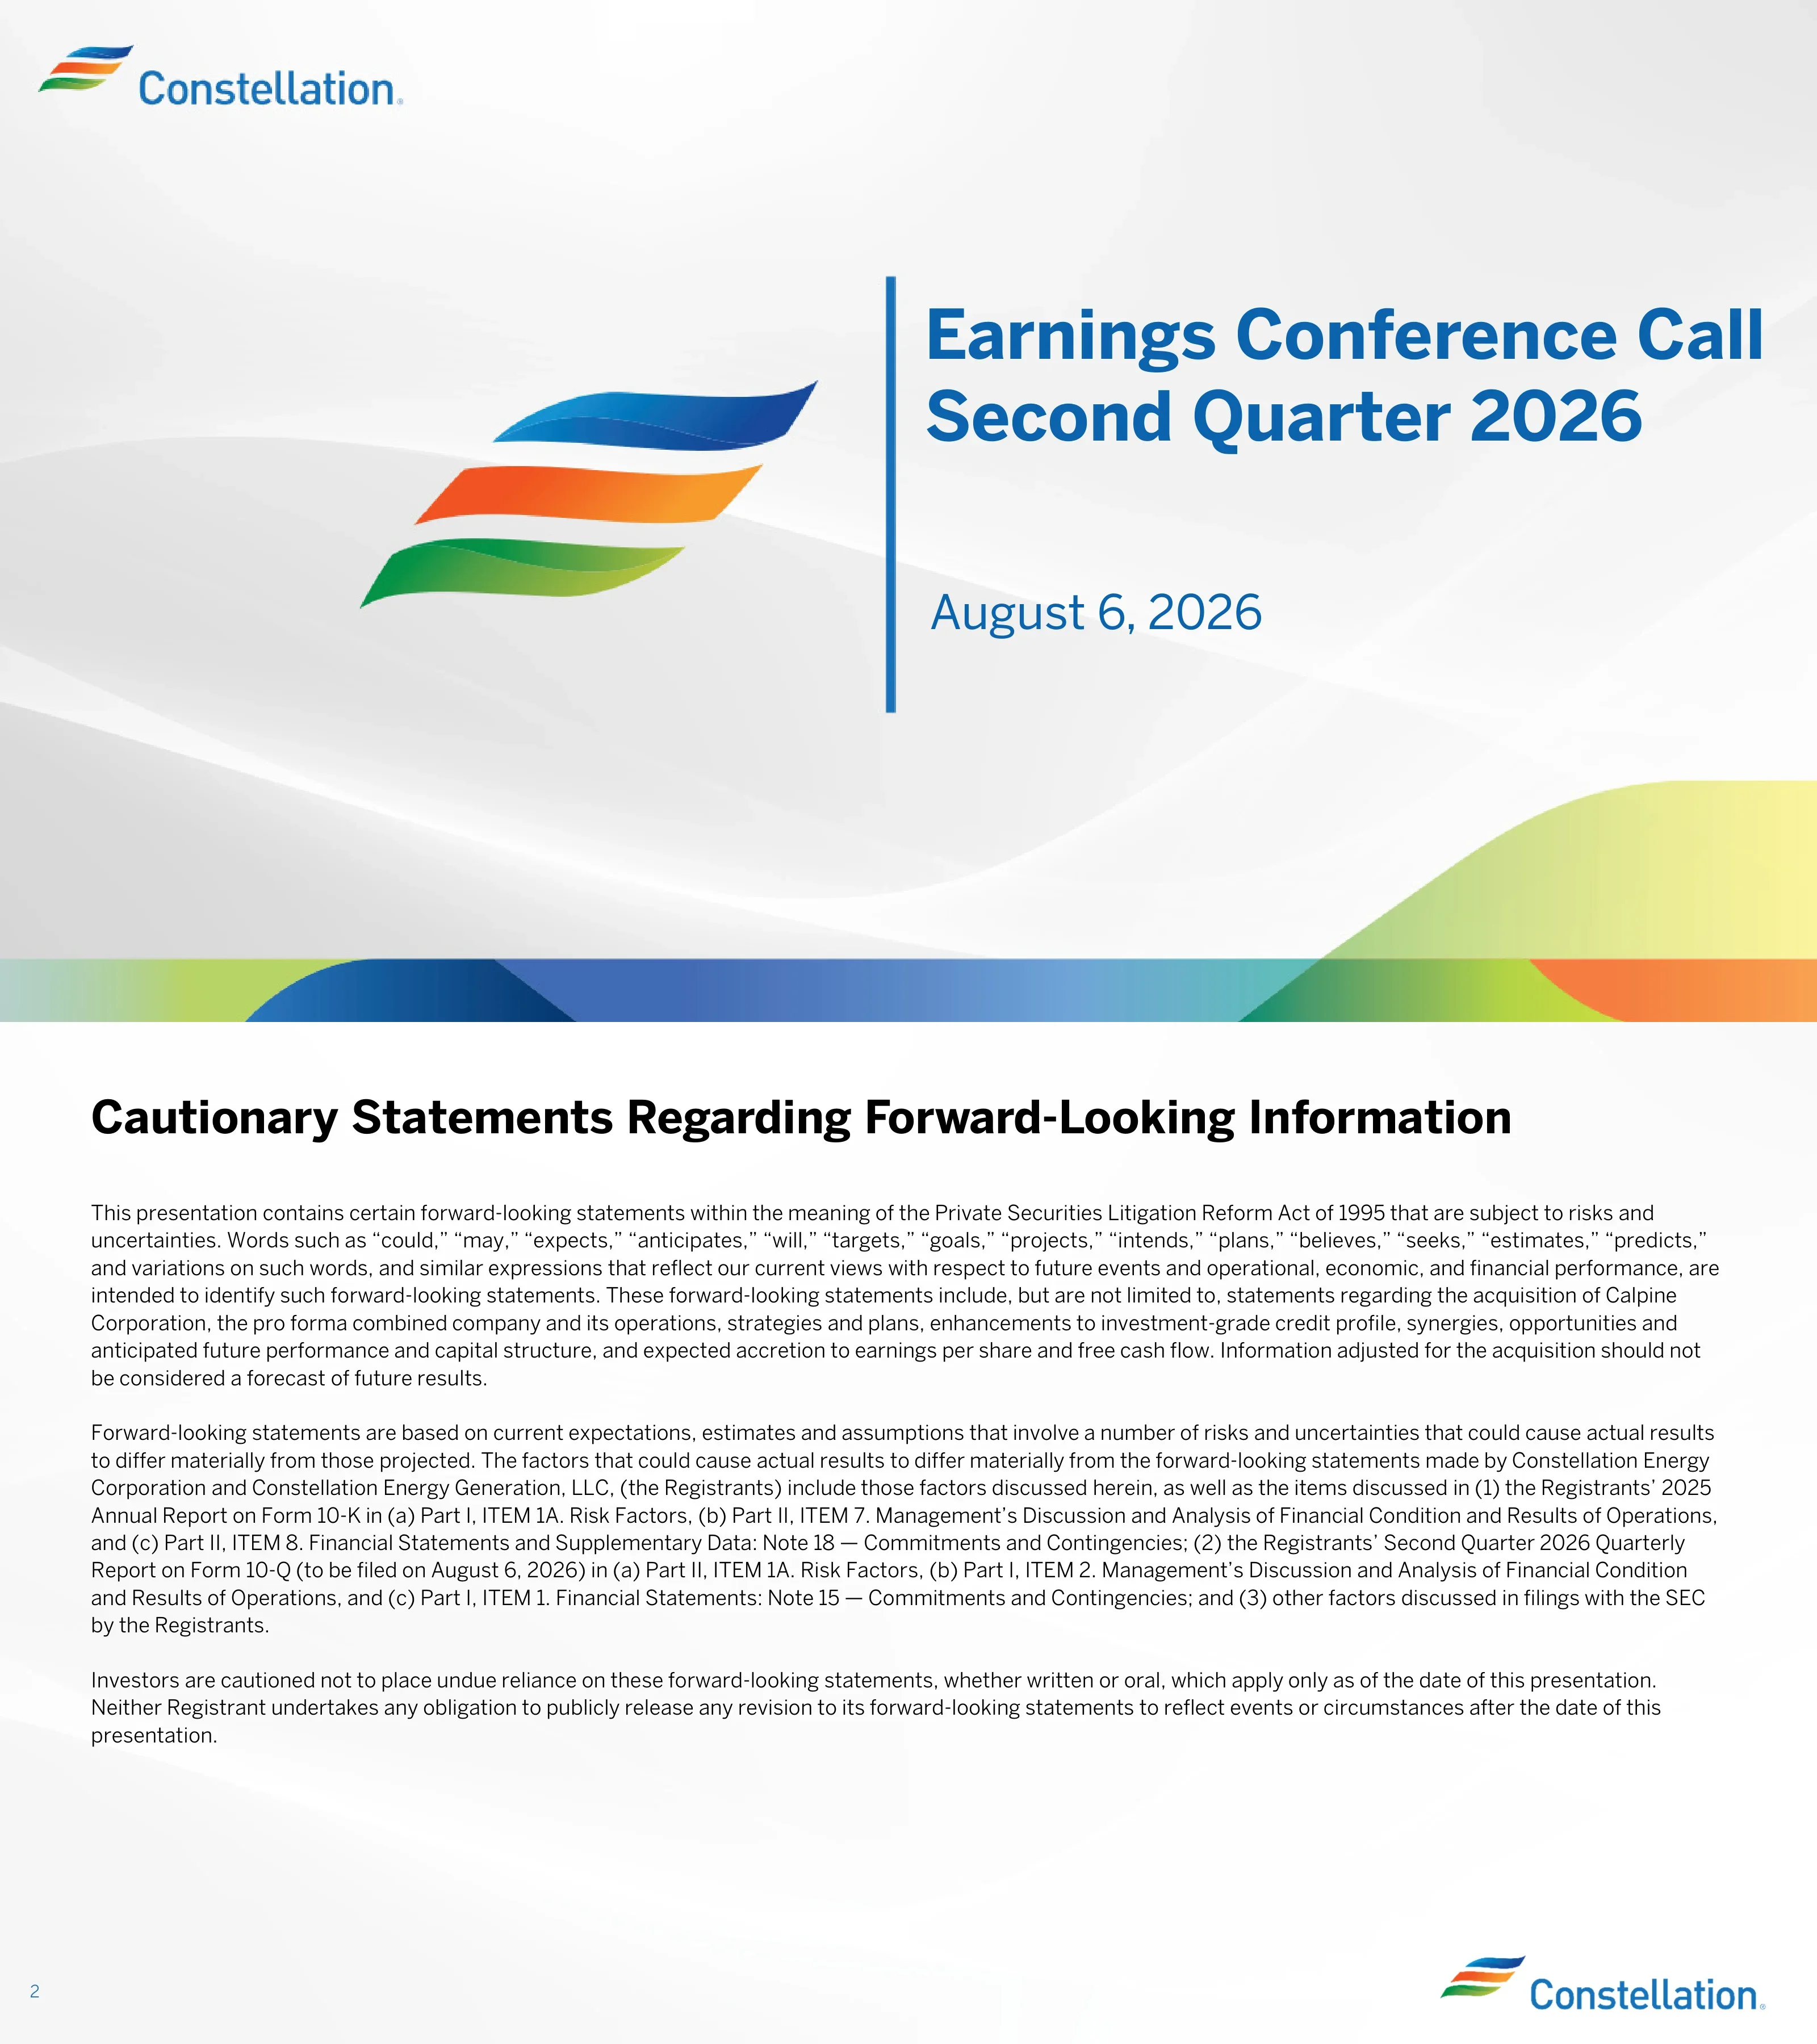
Cover slide for Constellation's Second Quarter 2026 earnings conference call, dated August 6, 2026.
Split cover: a large blue/orange/green ribbon logo mark on the left, a thin vertical blue rule in the center, and a bold blue two-line title with the date beneath on the right. Constellation wordmark top-left; light grey swoosh background with a multicolor gradient band along the bottom edge.
Safe-harbor disclaimer under the Private Securities Litigation Reform Act of 1995, covering statements about the Calpine acquisition and pro forma company, and pointing to risk factors in the 2025 Form 10-K and the Q2 2026 Form 10-Q filed August 6, 2026.
Text-only legal slide: bold black title at top-left and three full-width justified paragraphs of body text; page number bottom-left and logo bottom-right.
Defines the non-GAAP measures used in the deck: Adjusted Operating Earnings, Free Cash Flow before Growth (FCFbG), adjusted gross margin (with adjusted operating revenues and adjusted purchased power and fuel), and adjusted O&M, and explains why forward guidance cannot be reconciled to GAAP.
Text slide with orange bullet points; each measure name is set in bold italic, with sub-bullets marked by orange dashes, followed by a closing paragraph.
Explains why management uses non-GAAP measures and notes that they are marked with an asterisk (*) and reconciled in the appendix.
Three short paragraphs in the top half of the slide with generous white space below; same title and footer treatment as the rest of the deck.
Q2 GAAP EPS of $1.42 and Adjusted Operating EPS of $2.55; full-year adjusted guidance raised to $11.50-$12.50 per share; ~920 MW of long-term nuclear PPAs signed; ~$2.2B deployed YTD for buybacks; FERC and NRC approvals for Crane; license renewals filed for Ginna and Nine Mile Point; the Brazos Valley sale satisfies the final DOJ condition of the Calpine acquisition.
Two-column grid of nine rounded cards on the left (the top two are solid teal tiles with white text, the rest white with teal outlines, plus one full-width card at the bottom), and a tall rounded-corner aerial photo of the Nine Mile Point cooling tower on the right.
New contracts put ~30% of expected baseload clean generation MWhs under long-term agreement by 2032. They have an average duration of 18.5 years, begin 2029-2031, cover 890 MW of existing generation plus a 30 MW Dresden uprate, and include a 176 MW deal announced June 23, 2026.
Left column: teal subheading over a black rule, followed by five stacked teal-outlined rounded boxes with one fact each. Right column: large rounded photo of the Dresden Clean Energy Center with a caption.
Contrasts clarity already achieved (FERC commitments, PJM's proposed Reliability Backstop Procurement and Interim Resource Adequacy Service rules, and existing generation providing speed to power) with items expected by year-end: FERC rulings on the RBP and IRAS curtailment, PJM tariff filings and Cycle 1 interconnection studies.
Two-column comparison. The left panel is one large rounded box with four rows, each with a teal circular checkmark icon and divider lines. The right side has five stacked outlined boxes attached to a vertical solid teal bar, like a timeline.
70% of Pennsylvanians support the Crane restart, which is linked to ~3,400 in-state jobs, $425K in annual charitable giving, $3.6B in state and federal tax revenue adding $16B to PA GDP, and $373M+ of contracts sourced from PA companies. The fleet is positioned to add ~1,100 MW of uprates.
Left: four horizontal cards, each with a solid teal icon block on the left (job creation, philanthropy, tax generation, supporting local businesses) and a teal-highlighted metric on the right. Right: two rounded community photos (a charity check presentation and a sponsored bookmobile) above a teal subheading and three orange-bulleted points.
GAAP net income was $1.42/share in Q2 2026 vs $2.67 in Q2 2025; Adjusted Operating Earnings rose to $2.55 from $1.91. Drivers were the Calpine contribution, higher capacity revenue and strong commercial performance, partly offset by lower banked IL ZEC revenue and more planned refueling outage days.
Left: vertical bar chart in $/share with two grey GAAP bars and two teal adjusted bars and value labels on top. Right: teal heading 'Year-over-Year Adj. Operating Earnings* Drivers' over a rule, with five orange-bulleted drivers.
Quarterly nuclear output (TWh, roughly 40-42) and capacity factor are shown from Q2 2024 to Q2 2026. The Q2 average refueling outage lasted 23 days, beating the 38-day industry average by 40% and including the Byron Unit 1 turbine uprate. Planned outages lowered the Q2 capacity factor by ~1.8% vs Q2 2025.
Left: dual-axis combo chart with teal columns for TWh on the left axis and orange diamond markers for capacity factor (75-100%) on the right axis, above a rounded callout box with two bullets. Right: three vertically connected rounded boxes; the middle box is solid teal and emphasizes the 40% outperformance.
Full-year 2026 guidance moves from an initial $11.00-$12.00 (midpoint $11.50, 361M shares) to $11.50-$12.50 (midpoint $12.00, 357M shares). The drivers are a commercial business outperforming plan, with higher realized customer margins and portfolio optimization, and accretive buybacks, partially offset by higher performance-related O&M.
Left: floating range bar chart with light-blue base columns, teal range boxes containing dashed midpoint lines, and dotted connector lines from the initial to the revised range. Right: orange-bulleted rationale with dash sub-bullets.
~$2.2B of share repurchases YTD with ~$2.8B authorization remaining; ~$4.6B deployed to buy back ~25.5M shares since separation. Credit ratings: Constellation Baa1/BBB+/N/R and Calpine Baa1/BBB+/BBB. Brazos Valley was sold for $860M (~$1,419/kW), and required divestitures total $5.9B in gross proceeds, a premium to the $960/kW implied purchase price.
Three zones. Top-left: two teal header pills with large teal figures and an outlined summary box. Top-right: rounded box holding a small ratings table with teal column headers. Bottom: full-width teal subheading with two large rounded outlined boxes highlighting divestiture figures in teal.
2029 base-plus-enhanced EPS of $11.40-$11.90 (enhanced 30%-35%) has further optionality. FCFbG rises from $8.4B (2026-2027) to $11.5-$13.0B (2028-2029). An opportunity table sizes the upside: a 1 GW nuclear PPA ($0.40-$1.00 EPS, $125M-$325M FCFbG), 1 GW of gas powered land ($0.20-$0.50), gas capacity factor ($0.10-$0.20), commercial margin ($0.10-$0.30), a PTC floor increase ($0.30), capital allocation ($0.20-$0.75+), and enhanced power prices and spark spreads ($0.45-$1.35, $150M-$450M).
Left half: two small illustrative column charts, a stacked teal/green EPS column and an FCFbG bar series, each with curved arrows pointing to faded 'upside' columns. Right half: a four-column opportunity table with a teal header for base opportunities (the first row outlined with a dashed teal border) and a green header for the enhanced opportunity.
Three investment pillars. Strong 20%+ base EPS growth through 2029, with a long-term rolling three-year target of 10%+. Assets that cannot be replicated: the largest U.S. nuclear, gas and geothermal fleets, where the ~55 GW fleet's new-build cost exceeds 3x enterprise value. Value from capital allocation: a $5.0B buyback authorization and $3.9B of growth capital.
Large ribbon logo and vertical teal line on the left. Three horizontal rounded rows on the right, each with a solid color label block (navy blue, orange, green, matching the logo) and matching outline, containing bullets with teal-bolded key phrases.
Section divider opening the Additional Disclosures section (PTC, debt and ZEC details).
Centered bold black title on the plain light-grey swoosh background with the footer logo.
Illustrative 2026 payoff for non-state-supported units: the nuclear PTC provides up to $15.00/MWh when revenues are between $26.00 and $44.75/MWh. At $35/MWh, units would get $7.80/MWh of PTC, for $42.80/MWh total ($45.40/MWh tax-adjusted). At $47/MWh, no PTC applies.
Left: line chart of market revenues vs market revenues + PTC ($/MWh, 20-60) with a teal payoff curve, a shaded light-blue PTC support band, and orange ($35) and green ($47) dashed vertical reference lines with a legend. Right: four orange-bulleted explanatory paragraphs.
The PTC runs through 12/31/32 and is inflation-adjusted using the GDP price deflator (maximum rounded to $2.50/MWh, threshold to $1.00). The scenario tables compare the March 2026 outlook (2.0%) with the August 2026 outlook (2.0%, reflecting a published 2.8% adjustment for 2025) and 2.5%/3.0% cases. At 3.0%, the 2032 maximum PTC is $20.00 with a $56.00 phase-out, adding $1.55 to 2032 base EPS vs the March outlook.
Top: two columns (PTC Overview bullets and PTC Inflation Adjustment bullets with a fraction-style formula). Bottom: wide multi-block table with grouped headers (teal for March/Base EPS impacts, dark grey for August/revised) listing max PTC, price threshold and zero-PTC price for 2026-2032.
Corporate debt maturities as of 6/30/2026 run from 2028 to 2066, with the largest towers in 2028 ($1,950M senior notes + $334M tax-exempt), 2029 ($1,397M + $79M) and 2031 ($2,393M + $105M CPN). Total long-term debt is $19.6B: CEG $14.6B and CPN $5.0B, including $13.4B corporate and $6.1B subsidiary debt.
Full-width stacked column chart across years 2026-2066 (teal CEG senior notes, grey tax-exempt bonds, green CPN senior notes) with boxed value labels, plus an inset balance table top-right with a teal header and a grey total row.
Explains the Illinois ZEC program: a 10-year program running through May 2027, with the price equal to the social cost of carbon minus the amount by which the market price index exceeds $31.40/MWh, subject to an annual cap with banking. The ZEC price fell from $16.50 (2017/18-2021/22) to $12.01, $0.30, $9.38, $1.17 and $1.02 for 2026/2027 (with a $228M cap).
Upper area: orange-bulleted text with dash sub-bullets. Bottom-left: formula diagram of three teal circles joined by light-blue minus and equals symbols. Bottom-right: a compact two-column table of planning year vs ZEC price with alternating grey rows.
Section divider introducing the analyst modeling slides.
Centered bold black title on the light swoosh background with the footer logo.
Defines Enhanced Earnings (30-40% of total), which come from power prices above base assumptions, above-average commercial margins and volatility capture, and Base Earnings (60-70% of total), which come from long-term contracts, available nuclear at the PTC floor with 2% inflation, minimum fossil earnings and 10-year average commercial margins.
Left: one tall stacked column split into a green (enhanced) top segment and a teal (base) bottom segment. Right: two rounded boxes, green-outlined and teal-outlined, each with a colored definition phrase on the left and bullets on the right.
Base EPS grows from $6.65-$6.75 in 2026 (about 40% enhanced, within original $11.00-$12.00 guidance) to $7.60-$7.70 in 2027 (35%-40% enhanced) and $11.40-$11.90 in 2029 (30%-35% enhanced), a ~20% base earnings CAGR. The 2029 projection includes announced offtakes and the PTC at 2% inflation, but excludes incremental deals, higher gas utilization, expanding margins and higher-return investments.
Left: stacked teal/green column chart for 2026, 2027 and 2029 with a large curved gradient teal arrow labeled 'Base Earnings CAGR ~20%'. Right: two teal-headed lists ('2029 Projection Includes' / 'Does Not Include') with orange bullets.
Table defining the six base gross margin components: Contracted Clean (carbon-free contracted over 5 years), Available Nuclear (CMC units and remaining PTC units), Natural Gas and Oil, Wind/Solar/Hydro, Non-Nuclear Capacity, and Commercial Margin (including ~$475M/yr of other commercial margins).
Full-width two-column table with a solid teal header row ('Base Gross Margin' | 'Details'), bold category names on the left and orange-bulleted details on the right, separated by thin grey row lines within a teal border.
2026 vs 2027 base gross margin inputs. Illinois CMC nuclear: 53M MWh at $34.09 in 2026 vs 23M MWh at $34.50 in 2027. Remaining PTC units: 101M at $44.75 vs 127M at $45.75. Contracted clean: 36M vs 45M MWh at $70. Also covers gas spark spreads by region, capacity by region, commercial power margins of $4.25-$4.35/MWh on 245M MWh, and nuclear fuel amortization.
Left: simple two-column teal bar chart (2026, 2027) without labels to show growth direction. Right: dense modeling table with dark grey year headers, teal column labels (Quantity/Prices), bold category rows and indented sub-rows, with a grey vertical gutter between years.
Other base inputs for 2026/2027: adjusted O&M excluding performance incentive ($6,900M/$7,025M), TOTI ($675M), D&A ($1,825M/$2,000M) and tax rate (26%/26% and 25%/26%). Enhanced gross margin is $2,825-$3,025M in 2026 and $2,150-$2,550M in 2027. Reference prices as of 6/30/2026 include NIHub ATC at $42.66/$40.68 and PJM-W ATC at $72.75/$66.94.
Single wide table split into four teal-titled sections (Other Base Modeling Inputs, Enhanced Modeling Tools, Additional Information, Reference Prices) with dark grey 2026/2027 column headers and a grey gutter column.
Five-year inputs for 2026-2030. Remaining-unit nuclear volumes rise from 101M to 147M MWh, with the PTC price climbing from $44.75 to $50.88/MWh. Contracted clean volumes go from 36M to 53M MWh and prices from $70 to $88/MWh. Total nuclear volumes are 179-190M MWh, with 13-15 planned refueling outages per year.
Row labels on the left and a boxed grid on the right under a dark grey 'Detailed Base Earnings Modeling Inputs' banner and teal year headers (2026-2030), with light grey cells grouped by metric.
Cleared capacity by market for 2025/26-2027/28. PJM nuclear is 15,550 MW and then 15,525 MW (other PJM at $270, $329 and $333/MWd). PJM fossil/other falls from 6,150 to 2,950 MW. MISO nuclear is 1,100 MW at $217 and then $126. ISO-NE is 2,225-2,275 MW at $83-$118. CAISO net qualifying capacity is 95%, 95% and 85% sold.
Stacked set of four market tables (PJM, MISO, ISO-NE, CAISO), each with a solid teal market label and teal Volume/Price headers under dark grey planning-year bands; bold totals and a teal italic caveat line under the title.
All zones cleared at $325/MW-day. ComEd cleared 10,200 MW (9,800 nuclear), EMAAC 6,550, MAAC 1,725, BGE 375 and RTO 25, for a PJM portfolio of 18,875 MW (15,700 nuclear, 3,175 fossil/others). A callout notes that capacity is included in PTC gross receipts.
Left: zone table with a teal header, grey shaded zone subtotal rows and a solid teal 'PJM Portfolio' total row. Right: teal header bar 'Interactions with PTC' above a rounded outlined text box.
Section divider for the appendix containing GAAP to non-GAAP reconciliations.
Centered two-part bold black title ('Appendix' and 'Reconciliation of Non-GAAP Measures') on the light background with the footer logo.
Q2 2026 GAAP net income of $513M ($1.42/share) reconciles to $920M ($2.55) of adjusted operating earnings, with unrealized fair value losses of $340M, decommissioning of -$221M, acquired contract amortization of $149M, Calpine integration costs of $84M, pension/OPEB of $20M and legal/environmental items of $35M. For Q2 2025, $839M ($2.67) reconciles to $599M ($1.91).
Financial statement-style table with teal period headers (2026 | 2025), $M and EPS columns, bold top and bottom rows and thin black rules; footnotes at the bottom.
GAAP O&M of $7,775M in both 2026 and 2027 reconciles to adjusted O&M of $7,025M (2026) and $7,075M (2027). The adjustments cover decommissioning, direct cost of sales (-$250M/-$300M), Calpine merger costs (-$475M/-$125M) and a -$50M CCEC settlement in 2026.
Compact reconciliation table in the upper-left with a teal title row and year headers, bold GAAP and Adjusted rows, and large white space below.
Closing slide listing the investor relations email and links to Events and Presentations, Reports & SEC Filings, the Constellation Sustainability Report and Nuclear 101.
Left: teal headings 'Contact Information' and 'Links' with indented plain text items. Right: large rounded photo of a plant operator in a hard hat inspecting equipment.
Częste pytania dotyczące tego slajdu i podstawowej treści prezentacji.
The 32-slide deck from the August 6, 2026 earnings call covers disclaimers and non-GAAP definitions, key highlights, new nuclear contracts, regulatory progress in PJM, the Crane restart's economic impact, Q2 results, nuclear operations, raised guidance, the balance sheet and buybacks, 2029 upside opportunities and the growth thesis. It then adds sections on PTC, debt and ZEC disclosures, modeling slides with base earnings inputs and capacity data, and GAAP to non-GAAP reconciliations.
The slides show Q2 2026 GAAP EPS of $1.42 (vs $2.67 in Q2 2025) and Adjusted Operating EPS of $2.55 (vs $1.91). GAAP net income was $513M and adjusted operating earnings were $920M. Full-year 2026 adjusted guidance was raised from $11.00-$12.00 to $11.50-$12.50 per share, and about $2.2B was deployed on buybacks year to date.
It follows a classic earnings-call order: cover, legal and non-GAAP pages, highlights, business and regulatory updates, results, operations, guidance, balance sheet, outlook and investment thesis. Section dividers ('Additional Disclosures', 'Modeling Slides', 'Appendix') then introduce the supporting detail and reconciliations. This order works well as a template for any public company's quarterly deck.
It uses a clean white background with subtle grey swooshes, bold black sans-serif titles and teal accent subheadings over thin black rules. Rounded-corner cards and photo frames recur throughout, along with orange bullets and the blue/orange/green ribbon logo in the bottom-right corner. Charts follow a consistent color code: teal for current or base values, grey for GAAP or prior periods, and green for enhanced upside.
Examples include a grouped GAAP vs adjusted EPS bar chart, a guidance range chart with dashed midpoints, a dual-axis TWh and capacity-factor combo chart, stacked base/enhanced earnings columns with a CAGR arrow, and a PTC payoff line chart with a shaded support band. There is also a stacked debt maturity ladder, a circle-based ZEC formula diagram, and dense modeling and capacity auction tables.
It presents base EPS growth of 20%+ from 2026 to 2029: base earnings go from $6.65-$6.75 in 2026 to $7.60-$7.70 in 2027 and $11.40-$11.90 in 2029. It also sets a long-term rolling three-year base EPS growth target of 10%+ and shows FCFbG of $11.5-$13.0B for 2028-2029. These are the company's own projections and the deck's forward-looking statement caveats apply; this page does not offer investment advice.
Yes. The gallery page offers the original PDF of the deck and an editable PPTX version that was machine-converted from the PDF, so some layout or font details may need touch-ups after conversion. The original source is Constellation Energy's investor relations website.
Base earnings (60-70% of the total) are described as consistent and visible: they come from long-term contracts, available nuclear at the PTC floor assuming 2% inflation, minimum fossil earnings and 10-year average commercial margins. Enhanced earnings (30-40%) reflect upside such as forward power prices above base assumptions, above-average commercial margins and value from volatility.
Official IR site where the Second Quarter 2026 Earnings Conference Call presentation (August 6, 2026) is published under Events and Presentations.

Create Your Own Slides
Turn your ideas into professional presentations in seconds with 2slides AI.
Odwołuj się do profesjonalnych projektów, wybierz swój styl i generuj slajdy z idealnym renderowaniem tekstu. Napędzane przez Nano Banana—zacznij tworzyć swoją prezentację teraz.
Your AI Agent for slides. Save time, shine faster with intelligent presentation creation.




© 2026 2slides. All rights reserved.