
Należy do zbioru Przykłady prezentacji dla inwestorów · Przykłady prezentacji dla inwestorów z Indii
Coal India Q2 FY27 earnings presentation (Physical and Financial Performance H1 2026-27): Coal India Ltd's 52-slide results deck filed with BSE/NSE, covering Q2 and H1 of fiscal 2026-27 (April–September 2026) — coal production, offtake, overburden removal, inventory, consolidated P&L in ₹ crore, subsidiary profits, receivables, ratios and line-by-line variance analysis.
Używa okładki tej prezentacji jako wzoru stylu dla slajdów tworzonych z Twojej treści. Możesz też wybrać dowolną stronę poniżej i użyć jej układu jako wzoru.
Szybka Nawigacja
Tagi
Udostępnij slajdy
Coal India Q2 FY27 earnings presentation (Physical and Financial Performance H1 2026-27): Coal India Ltd's 52-slide results deck filed with BSE/NSE, covering Q2 and H1 of fiscal 2026-27 (April–September 2026) — coal production, offtake, overburden removal, inventory, consolidated P&L in ₹ crore, subsidiary profits, receivables, ratios and line-by-line variance analysis.
Szczegółowy widok każdej strony slajdu, w tym układu, kluczowej treści i elementów wizualnych.
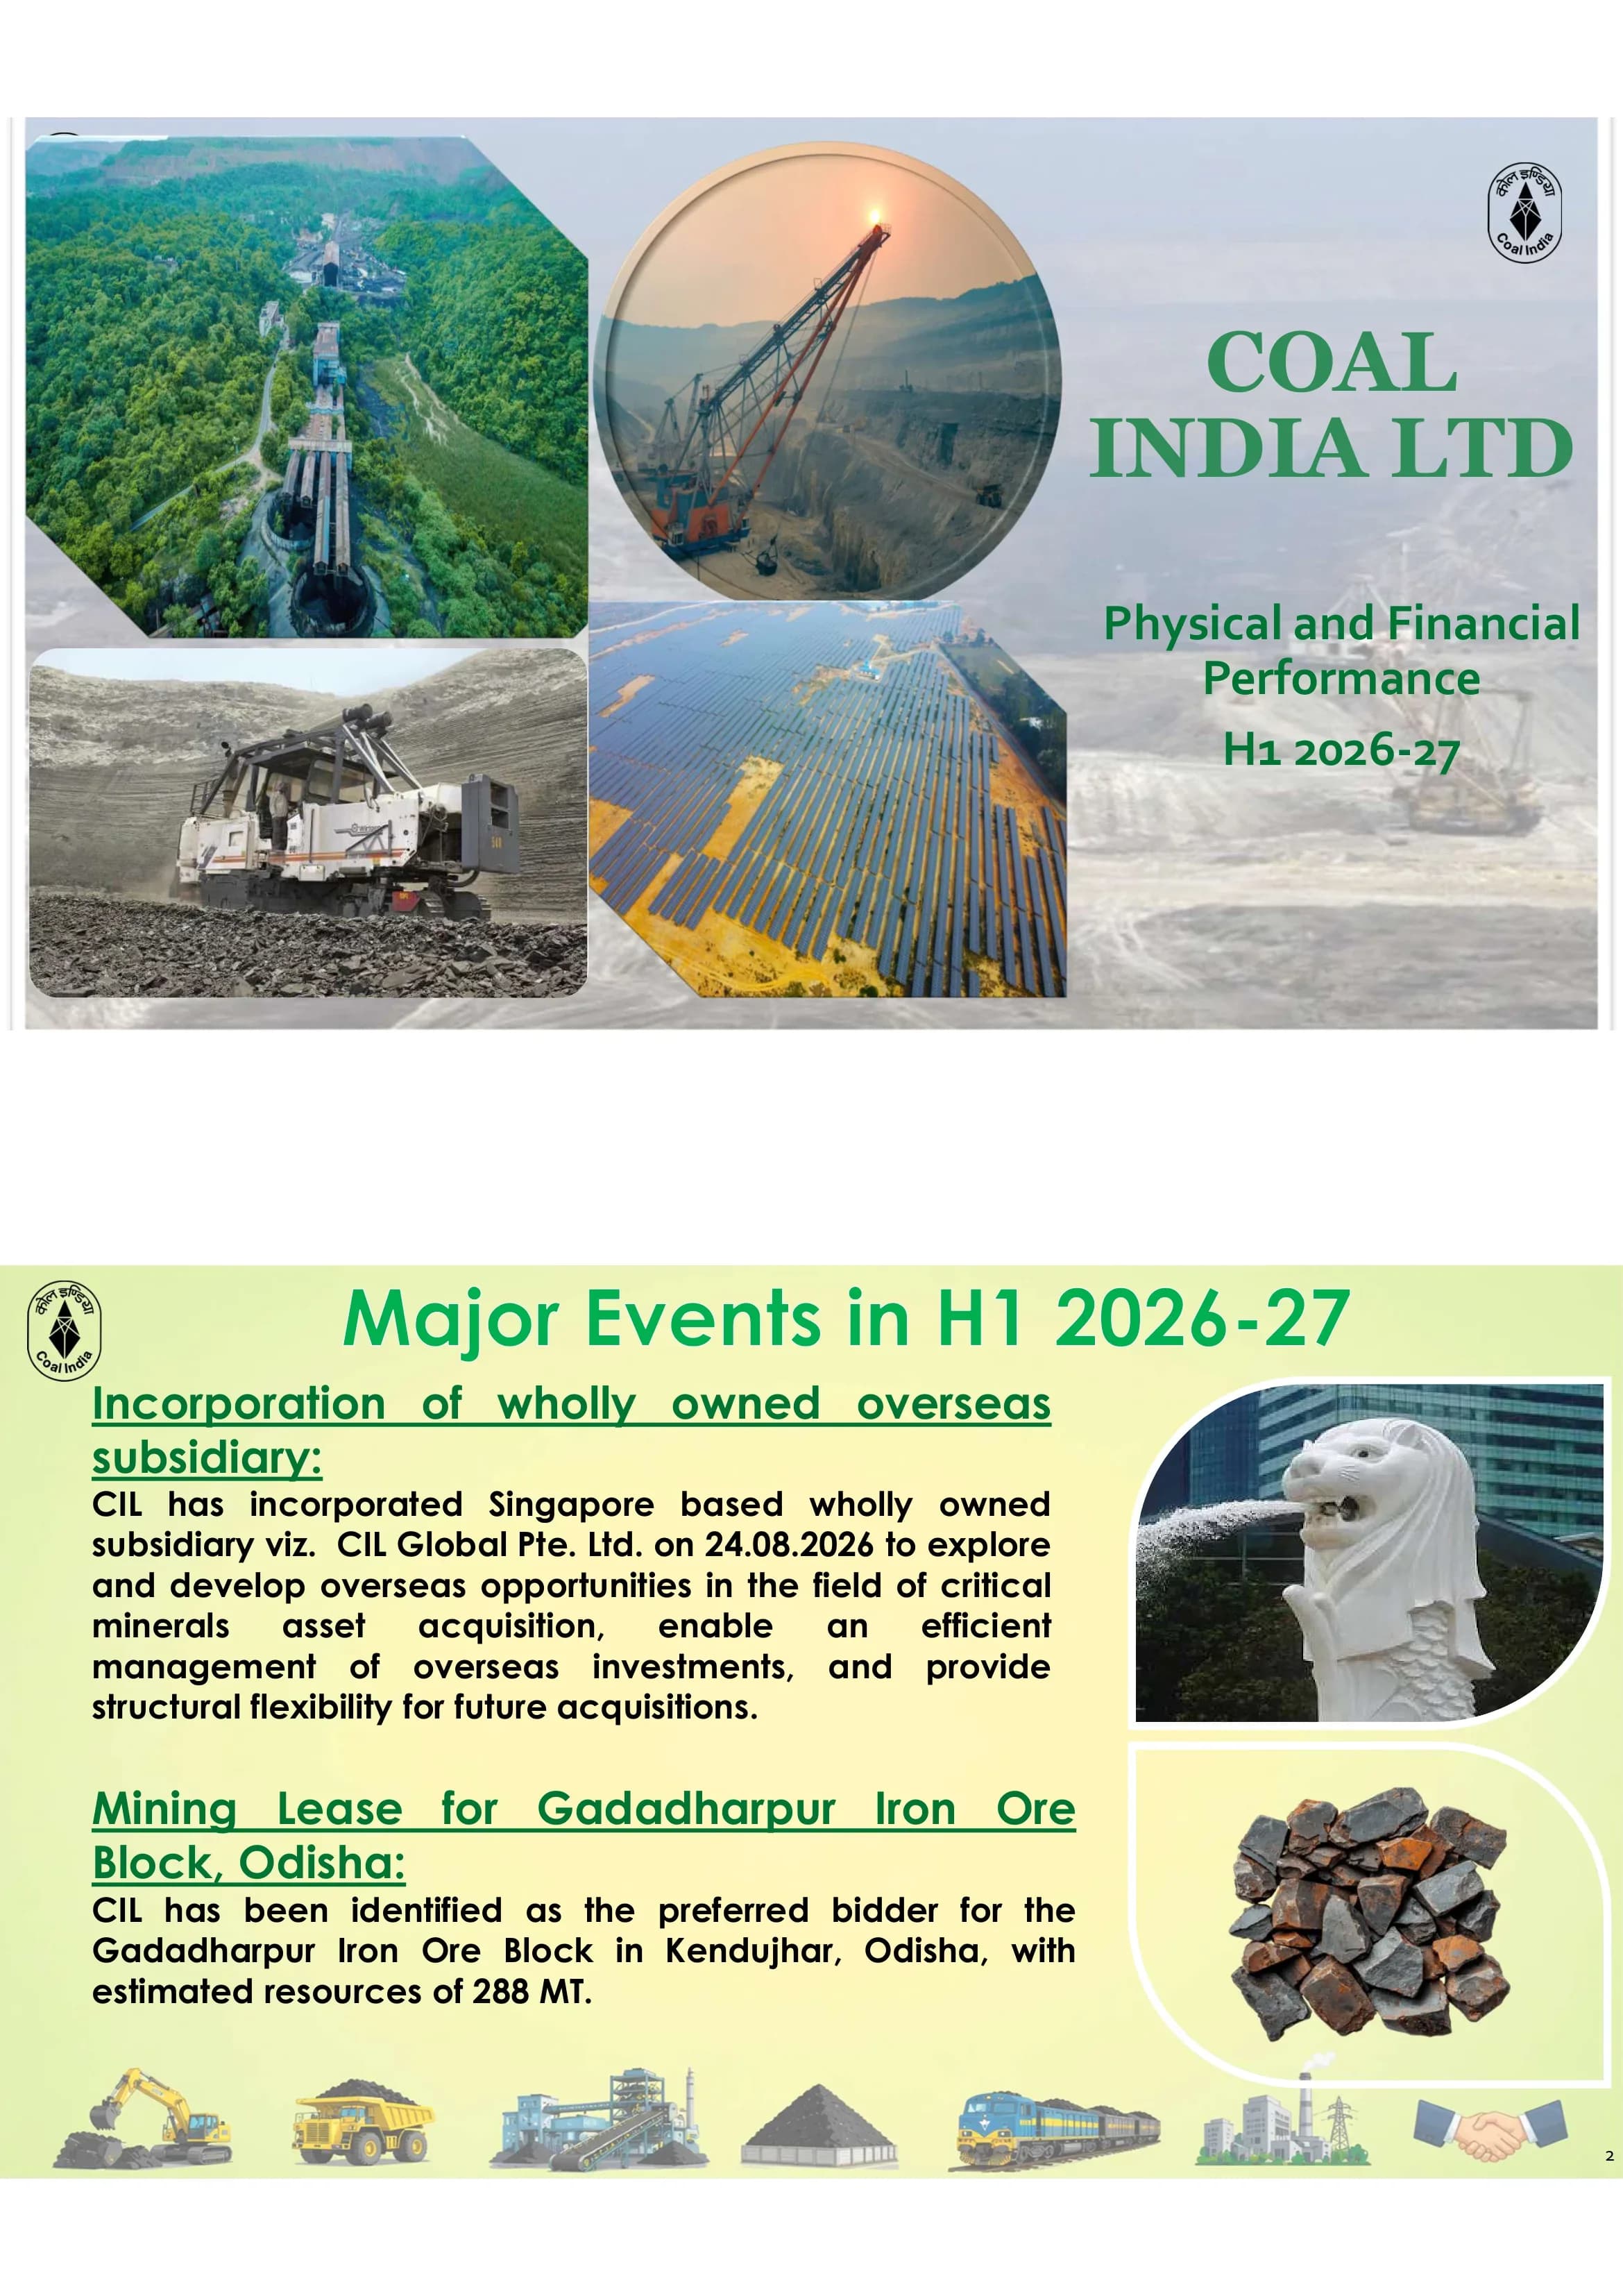
Cover slide titled 'COAL INDIA LTD – Physical and Financial Performance H1 2026-27' (Indian fiscal year FY27, April–September 2026).
Photo collage on the left (aerial coal handling plant, dragline in a circular frame, a surface miner, a solar park) with the serif green company name and subtitle on the right
CIL incorporated Singapore-based wholly owned subsidiary CIL Global Pte. Ltd. on 24.08.2026 to pursue overseas critical-minerals asset acquisitions; CIL was named preferred bidder for the Gadadharpur Iron Ore Block in Kendujhar, Odisha, with estimated resources of 288 MT.
Light green-to-yellow gradient background with Coal India logo top-left, green title, and a footer strip of mining icons (excavator, dumper, washery, coal heap, train, power plant, handshake); two underlined green headings with justified paragraphs on the left, Merlion and iron-ore photos in rounded frames on the right
MCL commissioned the 10 MTPA Lakhanpur Silo on 30.08.2026 and filed the DRHP for MCL's IPO on 01.09.2026; the foundation stone of India's first commercial coal gasification project was laid on 20 June 2026 by the President and Prime Minister — a ₹25,000 crore investment by BCGCL (CIL–BHEL JV) with 6.6 lakh tonnes per year of ammonium nitrate capacity.
Light green-to-yellow gradient background with Coal India logo top-left, green title, and a footer strip of mining icons (excavator, dumper, washery, coal heap, train, power plant, handshake); MCL and BCGCL logo tiles on the left, each paired with a text block on the right
BCCL's new 2.0 MTPA Bhojudih Coal Washery began commercial operations on 26 May 2026, lifting BCCL washing capacity to 17.35 MTPA (including 1.70 MTPA via TSL); production started at the ASGKCC Mine (Katras Area) under a revenue-sharing MDO model with BCCL receiving 9% of revenue, contributing 13,400 tonnes in H1.
Light green-to-yellow gradient background with Coal India logo top-left, green title, and a footer strip of mining icons (excavator, dumper, washery, coal heap, train, power plant, handshake); two image-plus-text rows, coal pile photo and rupee coin illustration on the left
CIL commissioned 200 MW of its 300 MW Khavda (Gujarat) solar project on 08.07.2026 and received GEDA's commissioning certificate for the 100 MW Bhadramali plant (effective 31.03.2026); for the first time Coal India booked revenue from sale of energy — ₹15.29 crore in H1 2026-27.
Light green-to-yellow gradient background with Coal India logo top-left, green title, and a footer strip of mining icons (excavator, dumper, washery, coal heap, train, power plant, handshake); text column on the left, illustrated solar-panel, pylon and rupee-growth image on the right
Three KPI cards: coal production 321.00 MT vs 329.14 MT (down 2%); coal offtake 384.20 MT vs 357.05 MT (up 8%); overburden removal 857.61 M.CuM vs 855.69 (up 0.2%).
Light green-to-yellow gradient background with Coal India logo top-left, green title, and a footer strip of mining icons (excavator, dumper, washery, coal heap, train, power plant, handshake); three grey KPI cards each with a circular photo, a coloured change pill, a large blue figure and two comparison bars
H1 2026-27 production of 321.00 MT against a 348.49 MT target (H1 25-26: 329.14, -2%). CCL +20% (35.47), ECL +10%, WCL +9%, SECL +6% (76.88); NCL -16% (57.99), MCL -9% (87.54), BCCL -13%. Departmental 97.40 MT (30%) vs contractual 223.60 MT (70%).
Light green-to-yellow gradient background with Coal India logo top-left, green title, and a footer strip of mining icons (excavator, dumper, washery, coal heap, train, power plant, handshake); subsidiary table (target, actual, prior year, variance with arrows) on the left, 100% stacked departmental/contractual bar chart and summary lines on the right
H1 offtake 384.20 MT vs 407.52 MT target and 357.05 MT last year (+8%). MCL 111.29 (+8%), SECL 89.89 (+7%), CCL 42.54 (+27%), WCL 34.88 (+22%), ECL 27.23 (+21%); NCL -9%, BCCL -3%. Mode-wise offtake: rail + MGR 257 MT, road 123 MT, others 4 MT.
Light green-to-yellow gradient background with Coal India logo top-left, green title, and a footer strip of mining icons (excavator, dumper, washery, coal heap, train, power plant, handshake); subsidiary table on the left, 3D column chart of mode-wise offtake on the right
Overburden removal 857.61 M.CuM vs 903.47 target and 855.69 last year (+0.2%). WCL +36%, CCL +34%, ECL +19%; BCCL -21%, MCL -21%, NCL -11%. Departmental 98.24 M.CuM (11%) vs contractual 759.37 M.CuM (89%).
Light green-to-yellow gradient background with Coal India logo top-left, green title, and a footer strip of mining icons (excavator, dumper, washery, coal heap, train, power plant, handshake); table left, stacked departmental/contractual chart right
Raw coal closing stock fell to 66.58 MT on 30-09-2026 from 130.28 MT on 01-04-2026 (down 63.70 MT, 49%), from 107.16 MT a year earlier (down 40.58 MT, 38%) and from 101.35 MT on 30-06-2026 (down 34.77 MT, 52% per deck). Pie shows closing stock share: MCL 30%, SECL 18%, CCL 18%, ECL 10%, BCCL 10%, WCL 8%, NCL 6%.
Light green-to-yellow gradient background with Coal India logo top-left, green title, and a footer strip of mining icons (excavator, dumper, washery, coal heap, train, power plant, handshake); wide subsidiary-by-date stock table with green decrease call-out rows, 3D pie chart at right
Q2 KPI cards: coal production 151.37 MT vs 145.82 MT (+4%); coal offtake 186.34 MT vs 166.10 MT (+12%); OB removal 352.92 M.CuM vs 349.11 (+1%).
Light green-to-yellow gradient background with Coal India logo top-left, green title, and a footer strip of mining icons (excavator, dumper, washery, coal heap, train, power plant, handshake); same three-card KPI design as the H1 slide
Q2 production 151.37 MT vs 157.83 target and 145.82 last year (+4%). WCL +40%, CCL +33%, ECL +23%, BCCL +8%, SECL +4%, MCL flat at 45.01; NCL -17% (27.94). Departmental 45.40 MT (30%), contractual 105.97 MT (70%).
Light green-to-yellow gradient background with Coal India logo top-left, green title, and a footer strip of mining icons (excavator, dumper, washery, coal heap, train, power plant, handshake); table plus 100% stacked chart, mirroring the H1 layout
Table labelled Q2 26-27 vs Q2 25-26 by subsidiary; the figures printed (overall 384.20 actual vs 407.52 target and 357.05 prior, +8%) are identical to the H1 offtake table on page 8, whereas the Q2 KPI card on page 11 shows Q2 offtake of 186.34 MT — the table appears to repeat H1 numbers.
Light green-to-yellow gradient background with Coal India logo top-left, green title, and a footer strip of mining icons (excavator, dumper, washery, coal heap, train, power plant, handshake); single wide subsidiary table with variance arrows
Q2 OB removal 352.92 M.CuM vs 374.43 target and 349.11 last year (+1%). WCL +87% (64.99), CCL +42%, ECL +14%, NEC +188%; MCL -25%, NCL -16%, SECL -13%, BCCL -5%. Departmental 43.11 (12%), contractual 309.81 (88%).
Light green-to-yellow gradient background with Coal India logo top-left, green title, and a footer strip of mining icons (excavator, dumper, washery, coal heap, train, power plant, handshake); table left, stacked chart right
Section break introducing the Q2 2026-27 financial results.
Full-bleed muted peach desk photo (calculator, glasses, documents) with white centred title and underline
Q2 FY27 vs Q2 FY26: sale of product ₹43,724 cr vs ₹36,074 cr (+21%); revenue from operations ₹44,179 cr vs ₹36,553 cr (+21%); PBT ₹8,728 cr vs ₹5,992 cr (+46%); PAT ₹6,547 cr vs ₹4,167 cr (+57%); EBITDA ₹11,447 cr vs ₹8,943 cr (+28%); EBITDA margin on revenue 26% vs 24%.
Light green-to-yellow gradient background with Coal India logo top-left, green title, and a footer strip of mining icons (excavator, dumper, washery, coal heap, train, power plant, handshake); 2x3 grid of mini bar charts, each comparing the current and prior quarter with a growth label
Q2 consolidated P&L (₹ crore): revenue from operations 44,179 (+21%), other income 2,654 (+24%), total income 46,833 (+21%), expenditure 38,398 (+17%), PBT without JV 8,434 (+46%), JV profit 294, PBT 8,728 (+46%), tax 2,181, PAT 6,547 (+57%).
Light green-to-yellow gradient background with Coal India logo top-left, green title, and a footer strip of mining icons (excavator, dumper, washery, coal heap, train, power plant, handshake); full-width green-tinted P&L table with arrow markers on drill-down rows and shaded subtotal rows
Q2 expenditure ₹38,398 cr (+17%): employee benefits 11,777 (+8%), other expenses 11,878 (+18%), contractual 7,326 (+18%), cost of materials 2,752 (+20%), changes in inventories 3,052 (+129%), D&A 2,379 (-11%), finance costs 339, stripping activity adjustment -1,105.
Light green-to-yellow gradient background with Coal India logo top-left, green title, and a footer strip of mining icons (excavator, dumper, washery, coal heap, train, power plant, handshake); expense breakdown table with red increase columns
Section break introducing the H1 2026-27 financial results.
Same full-bleed desk photo divider as page 15 with 'H1 2026 - 27'
H1 FY27 vs H1 FY26: sale of product ₹88,859 cr vs ₹78,155 cr (+14%); revenue from operations ₹90,434 cr vs ₹79,472 cr (+14%); PBT ₹20,448 cr vs ₹17,768 cr (+15%); PAT ₹15,397 cr vs ₹12,955 cr (+19%); EBITDA ₹25,796 cr vs ₹23,291 cr (+11%); EBITDA margin flat at 29%.
Light green-to-yellow gradient background with Coal India logo top-left, green title, and a footer strip of mining icons (excavator, dumper, washery, coal heap, train, power plant, handshake); 2x3 grid of paired bar charts
H1 consolidated P&L (₹ crore): revenue from operations 90,434 (+14%), other income 4,694 (+25%), total income 95,128, expenditure 75,215 (+14%), PBT without JV 19,913, JV profit 534 (+51%), PBT 20,448 (+15%), tax 5,050 (+5%), PAT 15,397 (+19%).
Light green-to-yellow gradient background with Coal India logo top-left, green title, and a footer strip of mining icons (excavator, dumper, washery, coal heap, train, power plant, handshake); full-width P&L table
H1 expenditure ₹75,215 cr (+14%): other expenses 23,536 (+16%), employee benefits 22,800 (+4%), contractual 15,985 (+14%), cost of materials 6,012 (+24%), D&A 4,682 (-6%), changes in inventories 4,470 (+202%), finance costs 666 (+21%), stripping adjustment -2,935.
Light green-to-yellow gradient background with Coal India logo top-left, green title, and a footer strip of mining icons (excavator, dumper, washery, coal heap, train, power plant, handshake); expense breakdown table
H1 PBT by subsidiary (₹ crore): MCL 6,575 (+7%), NCL 5,938 (-19%), SECL 2,911 (+54%), CCL 1,814 (+55%), WCL 1,352 (+76%), ECL 655 (loss to profit from -581), CMPDIL 420, BCCL 83 (-59%), CIL standalone 291; consolidated 20,448 (+15%).
Light green-to-yellow gradient background with Coal India logo top-left, green title, and a footer strip of mining icons (excavator, dumper, washery, coal heap, train, power plant, handshake); subsidiary table with 'Loss to Profit' labels and green/red variance
H1 PAT by subsidiary (₹ crore): MCL 4,881, NCL 4,506 (-16%), SECL 2,174 (+91%), CCL 1,353 (+60%), WCL 1,011 (+77%), ECL 493 (loss to profit), CMPDIL 311, CIL standalone 205, BCCL 56 (-55%); consolidated 15,397 (+19%).
Light green-to-yellow gradient background with Coal India logo top-left, green title, and a footer strip of mining icons (excavator, dumper, washery, coal heap, train, power plant, handshake); subsidiary PAT table
Section break introducing trade receivables and financial ratio analysis.
Light green-to-yellow gradient background with Coal India logo top-left, green title, and a footer strip of mining icons (excavator, dumper, washery, coal heap, train, power plant, handshake); two ellipses (grey 'Trade Receivables Analysis', green 'Ratio Analysis') joined by an ampersand
Consolidated gross trade receivables fell to ₹13,462 cr on 30.09.2026 from ₹15,834 cr (30.06) and ₹15,985 cr (31.03.2026), down ₹2,523 cr; largest balances WCL 3,770 and MCL 3,353; biggest reductions BCCL (-1,048), SECL (-831), ECL (-672). Figures before adjustment of unbilled incentive and coal quality variance.
Light green-to-yellow gradient background with Coal India logo top-left, green title, and a footer strip of mining icons (excavator, dumper, washery, coal heap, train, power plant, handshake); four-date subsidiary table with green down arrows
Receivables by customer (₹ crore, 30.09.2026 vs 31.03.2026): MAHAGENCO 3,588 (+89), APGENCO 1,930, NTPC 1,107 (-720), SAIL 773, TVNL 701, APPDCL 644, UPRVUNL 623 (+340), DPL 480, RINL 391, RRVUNL 367, DVC 266 (-1,537), others 2,622; total 13,462 (-2,523).
Light green-to-yellow gradient background with Coal India logo top-left, green title, and a footer strip of mining icons (excavator, dumper, washery, coal heap, train, power plant, handshake); customer table with variance arrows and footnote
Ratios 30.09.26 vs 31.03.26: debt-equity 0.13 vs 0.12; current ratio 1.81 vs 1.86; quick ratio 1.65 vs 1.62; debtor turnover 0.76 vs 0.81 months; inventory turnover 1.04 vs 1.22 months; EBITDA margin 29% vs 32%; operating margin 18% vs 19%; gross margin 23% vs 25%; net margin 17% vs 18% (higher explosives, PoL and contractual costs); EPS ₹24.94 (H1, not annualised) vs ₹50.46; book value per share ₹206.84 vs ₹193.26.
Light green-to-yellow gradient background with Coal India logo top-left, green title, and a footer strip of mining icons (excavator, dumper, washery, coal heap, train, power plant, handshake); three-column ratio table with a remarks column explaining each move
Section break introducing the revenue and expenditure variance analysis for H1 and Q2.
White slide with illustrated finance collage on the left (bank building, globe, rising arrow, rupee bag, notes) and bold black right-aligned title
Sale of product ₹88,859 cr vs ₹78,155 cr (+14%). FSA volume 327.79 MT (+19.32, impact ₹4,036 cr) at ₹2,144.49/t (+₹55.64, ₹1,824 cr); e-auction 49.31 MT (+12.93, ₹3,802 cr) at ₹3,083.95/t (₹707 cr); washed coal & other 7.45 MT (-3.23, -₹914 cr) at ₹4,487.34/t (₹1,234 cr). Overall realisation ₹2,310.34/t (+5%), sales 384.55 MT (+8%); plus ₹15.29 cr sale of energy.
Light green-to-yellow gradient background with Coal India logo top-left, green title, and a footer strip of mining icons (excavator, dumper, washery, coal heap, train, power plant, handshake); header KPI row then three grouped segment tables (FSA, E-Auction, Washed Coal) with impact and remarks, summary rows and a note bar
Excluding other charges, sale of product ₹62,308 cr vs ₹55,839 cr (+12%). FSA ₹1,471.52/t (+₹9.72), e-auction ₹2,303.34/t, washed coal ₹3,645.25/t; volume impacts FSA ₹2,825 cr, e-auction ₹2,911 cr, washed coal -₹773 cr. Overall realisation ₹1,620.29/t (+3%).
Light green-to-yellow gradient background with Coal India logo top-left, green title, and a footer strip of mining icons (excavator, dumper, washery, coal heap, train, power plant, handshake); same segment table structure as page 30
₹1,575 cr vs ₹1,318 cr (+20%), driven by a ₹63 cr increase in inflated mileage income and a ₹204 cr increase in stripping activity provision reversal.
Light green-to-yellow gradient background with Coal India logo top-left, green title, and a footer strip of mining icons (excavator, dumper, washery, coal heap, train, power plant, handshake); one-row table then 'Reason of Variance' bullet box
Other income for H1 2026-27 was ₹4,694 crore versus ₹3,756 crore a year earlier (+₹938 cr, +25%). Reasons of variance: interest on deposits up ₹1,160 cr, interest on income-tax refunds down ₹303 cr, misc income up ₹80 cr.
Light green-to-yellow gradient background with Coal India logo top-left, green title, and a footer strip of mining icons (excavator, dumper, washery, coal heap, train, power plant, handshake); a four-column header table (current, prior, Inc/Dec, Inc/Dec %) above a teal 'Reason of Variance' label and a bordered bullet box
Cost of materials consumed for H1 2026-27 was ₹6,012 crore versus ₹4,851 crore a year earlier (+₹1,161 cr, +24%). Reasons of variance: explosives up ₹430 cr, oil & lubricants up ₹678 cr, HEMM/spares/timber up ₹53 cr.
Light green-to-yellow gradient background with Coal India logo top-left, green title, and a footer strip of mining icons (excavator, dumper, washery, coal heap, train, power plant, handshake); a four-column header table (current, prior, Inc/Dec, Inc/Dec %) above a teal 'Reason of Variance' label and a bordered bullet box
Employee benefit expenses for H1 2026-27 was ₹22,800 crore versus ₹21,923 crore a year earlier (+₹877 cr, +4%). Reasons of variance: basic + DA up ₹207 cr, NCWA provision for non-executive salaries (July–Sep 2026) ₹499 cr, bonus up ₹74 cr, CMPS superannuation up ₹86 cr.
Light green-to-yellow gradient background with Coal India logo top-left, green title, and a footer strip of mining icons (excavator, dumper, washery, coal heap, train, power plant, handshake); a four-column header table (current, prior, Inc/Dec, Inc/Dec %) above a teal 'Reason of Variance' label and a bordered bullet box
Finance cost for H1 2026-27 was ₹666 crore versus ₹552 crore a year earlier (+₹114 cr, +21%). Reasons of variance: borrowing cost up ₹70 cr (mainly BCCL, ECL) and unwinding of discount on mine closure plan revision up ₹44 cr.
Light green-to-yellow gradient background with Coal India logo top-left, green title, and a footer strip of mining icons (excavator, dumper, washery, coal heap, train, power plant, handshake); a four-column header table (current, prior, Inc/Dec, Inc/Dec %) above a teal 'Reason of Variance' label and a bordered bullet box
Depreciation & amortisation for H1 2026-27 was ₹4,682 crore versus ₹4,972 crore a year earlier (-₹290 cr, -6%). Reasons of variance: depreciation on other mining infrastructure up ₹58 cr and stripping-asset amortisation up ₹252 cr, offset by the absence of last year's ₹553 cr SECL impairment of exploration assets in safety-zone coal blocks.
Light green-to-yellow gradient background with Coal India logo top-left, green title, and a footer strip of mining icons (excavator, dumper, washery, coal heap, train, power plant, handshake); a four-column header table (current, prior, Inc/Dec, Inc/Dec %) above a teal 'Reason of Variance' label and a bordered bullet box
Contractual expenses for H1 2026-27 was ₹15,985 crore versus ₹14,020 crore a year earlier (+₹1,965 cr, +14%). Reasons of variance: outsourcing for coal and OB up ₹1,868 cr, transport & wagon loading up ₹145 cr, other contractual down ₹48 cr.
Light green-to-yellow gradient background with Coal India logo top-left, green title, and a footer strip of mining icons (excavator, dumper, washery, coal heap, train, power plant, handshake); a four-column header table (current, prior, Inc/Dec, Inc/Dec %) above a teal 'Reason of Variance' label and a bordered bullet box
Other expenses for H1 2026-27 was ₹23,536 crore versus ₹20,283 crore a year earlier (+₹3,252 cr, +16%). Reasons of variance: rates & taxes up ₹2,777 cr on high offtake, power up ₹264 cr, provisions for debtors up ₹73 cr, P&M repairs up ₹37 cr.
Light green-to-yellow gradient background with Coal India logo top-left, green title, and a footer strip of mining icons (excavator, dumper, washery, coal heap, train, power plant, handshake); a four-column header table (current, prior, Inc/Dec, Inc/Dec %) above a teal 'Reason of Variance' label and a bordered bullet box
Q2 PBT (₹ crore): MCL 3,349 (+15%), NCL 2,541 (-31%), CCL 795 (+197%), SECL 772, WCL 378, BCCL 186 and ECL 139 (all loss to profit), CMPDIL 260, CIL standalone 80; consolidated 8,728 (+46%).
Light green-to-yellow gradient background with Coal India logo top-left, green title, and a footer strip of mining icons (excavator, dumper, washery, coal heap, train, power plant, handshake); subsidiary table with loss-to-profit labels
Q2 PAT (₹ crore): MCL 2,482 (+17%), NCL 1,890 (-29%), SECL 655, CCL 523 (+187%), WCL 282, CMPDIL 195, BCCL 124, ECL 116, CIL standalone 52; consolidated 6,547 (+57%).
Light green-to-yellow gradient background with Coal India logo top-left, green title, and a footer strip of mining icons (excavator, dumper, washery, coal heap, train, power plant, handshake); subsidiary PAT table
Q2 sale of product ₹43,724 cr vs ₹36,074 cr (+21%). FSA 159.71 MT (+17.02, ₹3,580 cr) at ₹2,191.94/t (₹1,411 cr); e-auction 22.79 MT (+7.67, ₹2,280 cr) at ₹3,082.21/t; washed coal 3.81 MT (-3.33, -₹727 cr) at ₹4,410.47/t. Overall realisation ₹2,346.21/t (+7%), sales 186.32 MT (+13%); plus ₹9.61 cr sale of energy.
Light green-to-yellow gradient background with Coal India logo top-left, green title, and a footer strip of mining icons (excavator, dumper, washery, coal heap, train, power plant, handshake); segment price/volume tables with impact and remarks
Excluding other charges ₹30,691 cr vs ₹25,532 cr (+20%); FSA ₹1,509.53/t, e-auction ₹2,283.38/t (slightly lower, -₹6 cr impact), washed coal ₹3,614.38/t; overall realisation ₹1,647.24/t (+6%).
Light green-to-yellow gradient background with Coal India logo top-left, green title, and a footer strip of mining icons (excavator, dumper, washery, coal heap, train, power plant, handshake); segment tables as on page 42
₹455 cr vs ₹479 cr (-5%), due to a ₹31 cr decrease in stripping activity provision reversal.
Light green-to-yellow gradient background with Coal India logo top-left, green title, and a footer strip of mining icons (excavator, dumper, washery, coal heap, train, power plant, handshake); one-row table and reason box
Other income for Q2 2026-27 was ₹2,654 crore versus ₹2,140 crore a year earlier (+₹514 cr, +24%). Reasons of variance: interest on deposits up ₹715 cr, interest from the Income Tax Department down ₹202 cr.
Light green-to-yellow gradient background with Coal India logo top-left, green title, and a footer strip of mining icons (excavator, dumper, washery, coal heap, train, power plant, handshake); a four-column header table (current, prior, Inc/Dec, Inc/Dec %) above a teal 'Reason of Variance' label and a bordered bullet box
Cost of materials consumed for Q2 2026-27 was ₹2,752 crore versus ₹2,289 crore a year earlier (+₹463 cr, +20%). Reasons of variance: explosives up ₹185 cr, oil & lubricants up ₹243 cr, HEMM/spares/timber up ₹35 cr.
Light green-to-yellow gradient background with Coal India logo top-left, green title, and a footer strip of mining icons (excavator, dumper, washery, coal heap, train, power plant, handshake); a four-column header table (current, prior, Inc/Dec, Inc/Dec %) above a teal 'Reason of Variance' label and a bordered bullet box
Employee benefit expenses for Q2 2026-27 was ₹11,777 crore versus ₹10,944 crore a year earlier (+₹832 cr, +8%). Reasons of variance: basic + DA up ₹166 cr, NCWA provision ₹499 cr, bonus up ₹66 cr, CMPS contribution up ₹40 cr.
Light green-to-yellow gradient background with Coal India logo top-left, green title, and a footer strip of mining icons (excavator, dumper, washery, coal heap, train, power plant, handshake); a four-column header table (current, prior, Inc/Dec, Inc/Dec %) above a teal 'Reason of Variance' label and a bordered bullet box
Finance cost for Q2 2026-27 was ₹339 crore versus ₹287 crore a year earlier (+₹52 cr, +18%). Reasons of variance: borrowing cost up ₹30 cr (mainly BCCL, ECL), unwinding of discount up ₹22 cr.
Light green-to-yellow gradient background with Coal India logo top-left, green title, and a footer strip of mining icons (excavator, dumper, washery, coal heap, train, power plant, handshake); a four-column header table (current, prior, Inc/Dec, Inc/Dec %) above a teal 'Reason of Variance' label and a bordered bullet box
Depreciation & amortisation for Q2 2026-27 was ₹2,379 crore versus ₹2,664 crore a year earlier (-₹285 cr, -11%). Reasons of variance: other mining infrastructure depreciation up ₹25 cr and stripping amortisation up ₹130 cr, against a ₹388 cr SECL exploration-asset impairment in the prior-year quarter.
Light green-to-yellow gradient background with Coal India logo top-left, green title, and a footer strip of mining icons (excavator, dumper, washery, coal heap, train, power plant, handshake); a four-column header table (current, prior, Inc/Dec, Inc/Dec %) above a teal 'Reason of Variance' label and a bordered bullet box
Contractual expenses for Q2 2026-27 was ₹7,326 crore versus ₹6,205 crore a year earlier (+₹1,121 cr, +18%). Reasons of variance: outsourcing for coal and OB up ₹1,099 cr, transport & wagon loading up ₹71 cr, other contractual down ₹49 cr.
Light green-to-yellow gradient background with Coal India logo top-left, green title, and a footer strip of mining icons (excavator, dumper, washery, coal heap, train, power plant, handshake); a four-column header table (current, prior, Inc/Dec, Inc/Dec %) above a teal 'Reason of Variance' label and a bordered bullet box
Other expenses for Q2 2026-27 was ₹11,878 crore versus ₹10,061 crore a year earlier (+₹1,817 cr, +18%). Reasons of variance: rates & taxes up ₹1,535 cr on high offtake, power up ₹145 cr, provisions for doubtful debts up ₹133 cr.
Light green-to-yellow gradient background with Coal India logo top-left, green title, and a footer strip of mining icons (excavator, dumper, washery, coal heap, train, power plant, handshake); a four-column header table (current, prior, Inc/Dec, Inc/Dec %) above a teal 'Reason of Variance' label and a bordered bullet box
Closing slide with 'Thank You' over an aerial photo of a forested reservoir (reclaimed mine landscape).
Light green-to-yellow gradient background with Coal India logo top-left, green title, and a footer strip of mining icons (excavator, dumper, washery, coal heap, train, power plant, handshake); wide landscape photo band across the middle with large translucent white text
Częste pytania dotyczące tego slajdu i podstawowej treści prezentacji.
For July–September 2026, revenue from operations was ₹44,179 crore (+21% year on year), profit before tax ₹8,728 crore (+46%) and profit after tax ₹6,547 crore (+57%), with EBITDA of ₹11,447 crore and a 26% EBITDA margin on revenue.
H1 FY27 revenue from operations was ₹90,434 crore (+14%) and PAT ₹15,397 crore (+19%). Coal production slipped 2% to 321.00 MT, while offtake rose 8% to 384.20 MT, drawing raw coal stock down 49% to 66.58 MT.
Coal India filed it with the BSE and NSE as part of its H1 2026-27 results disclosure. The exchange cover letter has been removed; the 52 slides are otherwise as filed.
Indian fiscal year 2026-27 (FY27) runs from April 2026 to March 2027, so Q2 FY27 is July–September 2026 and H1 is April–September 2026.
ECL, BCCL, CCL, NCL, WCL, SECL, MCL and NEC for physical performance, plus CMPDIL and CIL standalone for profit. MCL was the largest profit contributor (H1 PBT ₹6,575 crore), and ECL moved from loss to profit.
Yes. The page offers the original PDF and an editable PPTX converted from it. Tables and text can be edited, though some charts may come through as images.
The Q2 coal offtake table (slide 13) repeats the H1 figures (384.20 MT), while the Q2 summary card on slide 11 shows Q2 offtake of 186.34 MT. Use the summary card and the Q2 sales quantity (186.32 MT) for the quarter.
Yes. Its structure — highlight slides, KPI cards, subsidiary tables, P&L, expense breakdown and one 'Reason of Variance' slide per cost line — works for any multi-entity group results deck.
Original exchange filing including cover letter

Create Your Own Slides
Turn your ideas into professional presentations in seconds with 2slides AI.
Odwołuj się do profesjonalnych projektów, wybierz swój styl i generuj slajdy z idealnym renderowaniem tekstu. Napędzane przez Nano Banana—zacznij tworzyć swoją prezentację teraz.
Twój Agent AI dla slajdów. Oszczędzaj czas, błyszcz szybciej dzięki inteligentnemu tworzeniu prezentacji.


© 2026 2slides. Wszelkie prawa zastrzeżone.